Precision Support Resistance MT5
- Indicadores
-
Young Ho Seo
 Harmonic Pattern Indicator - Repainting + Japanese Candlestick Pattern Scanner + Automatic Channel + Many more
https://www.mql5.com/en/market/product/4488 - Versión: 7.3
- Actualizado: 28 febrero 2022
- Activaciones: 5
Introducción al indicador de soporte y resistencia
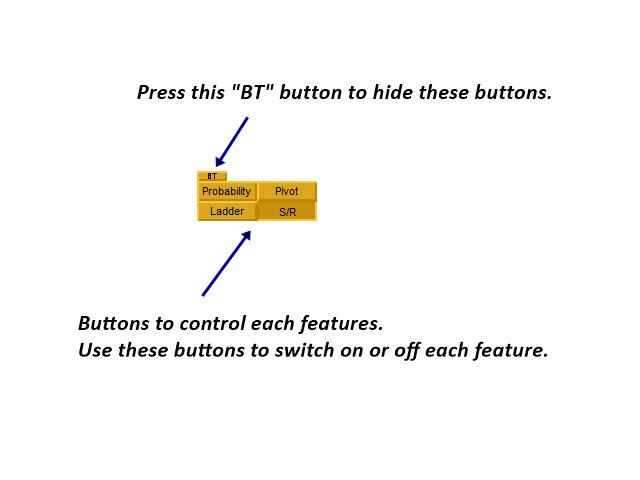
El soporte y la resistencia son los niveles de precios importantes a tener en cuenta durante el mercado intradiario. Estos niveles de precios a menudo se prueban antes del desarrollo de una nueva tendencia o a menudo detienen la tendencia existente causando un cambio de tendencia en este punto. Un soporte y una resistencia muy precisos son indispensables para los operadores experimentados. Muchas estrategias típicas de trading, como la ruptura o la inversión de tendencia, pueden jugarse bien alrededor de estos niveles de soporte y resistencia. Los soportes y resistencias de precisión son herramientas de soporte y resistencia altamente precisas diseñadas para operadores serios. Además de la detección precisa de los niveles de soporte y resistencia, Precision Support and Resistance ofrece cuatro funciones adicionales que le ayudarán a ganar en sus operaciones. Entre ellas se incluyen la detección de velas de decisión, el cálculo de probabilidad dentro de la vela, el análisis de pivote y el análisis de escalera. Cualquiera de estas funciones puede activarse o desactivarse según sus preferencias.
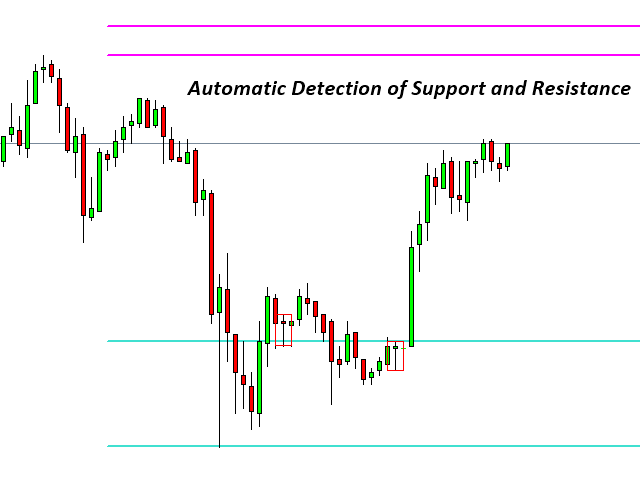
Soportes y resistencias
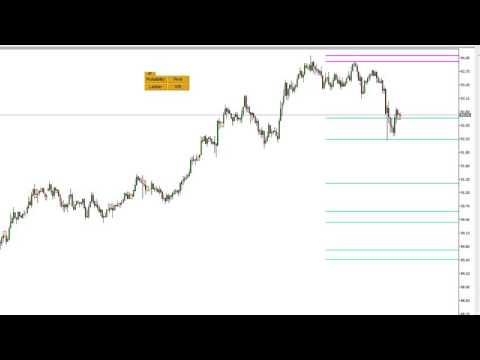
Utilizamos el enfoque de densidad y geometría para calcular los niveles de soporte y resistencia. A menudo observará que los niveles de soporte y resistencia detectados predicen con mucha precisión dónde el precio penetra con fuerza o dónde el precio retrocede con fuerza. De acuerdo con sus preferencias, se puede desarrollar alguna estrategia de negociación sensata.
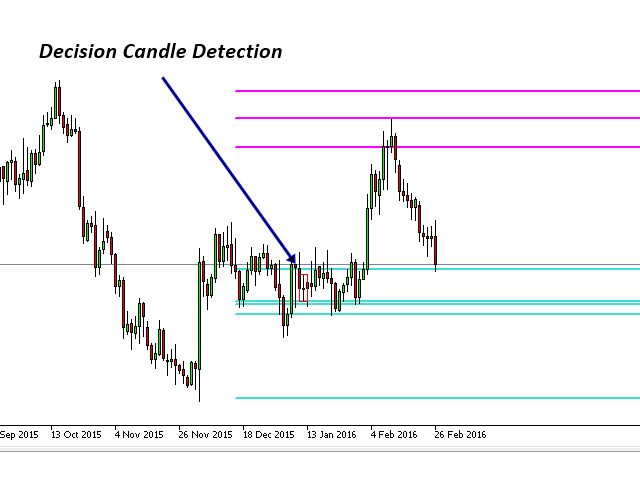
Detección de Velas de Decisión
El módulo de detección de velas de decisión alerta a los operadores de un posible gran movimiento. La vela de decisión es el patrón típico que aparece antes del inicio de una fuerte reversión o una fuerte continuación de la tendencia actual. Por lo tanto, se recomienda vigilar la aparición de esta vela de decisión en sus operaciones, especialmente si están alrededor de un nivel importante de soporte y resistencia.
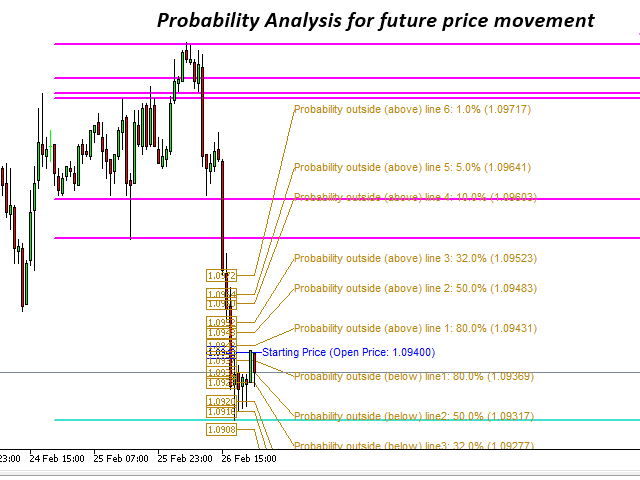
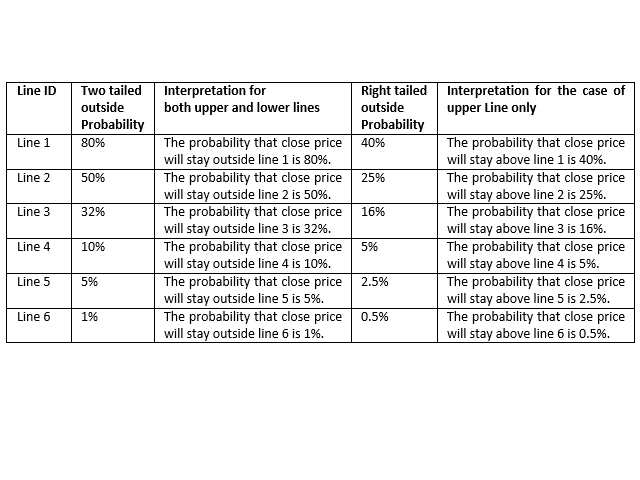
Cálculo de la probabilidad dentro de la vela
La probabilidad Intra-Candle es la predicción estadística del rango futuro del precio de cierre para el horizonte proyectado. Esta herramienta mostrará niveles de 1%, 5%, 10%, 32%, 50%, 80%. El par de líneas se dibujará por encima y por debajo del precio de apertura de la vela actual. 50% de probabilidad significa que la probabilidad de que el precio de cierre esté fuera de estas líneas es el 50% desde el precio de apertura de la vela. En lugar de hacer conjeturas, puede estimar con precisión cuando el precio tocará el nivel de soporte y resistencia o cuando el precio tocará la línea de media móvil o cuando el precio tocará las líneas de la banda de Bollinger, etc.
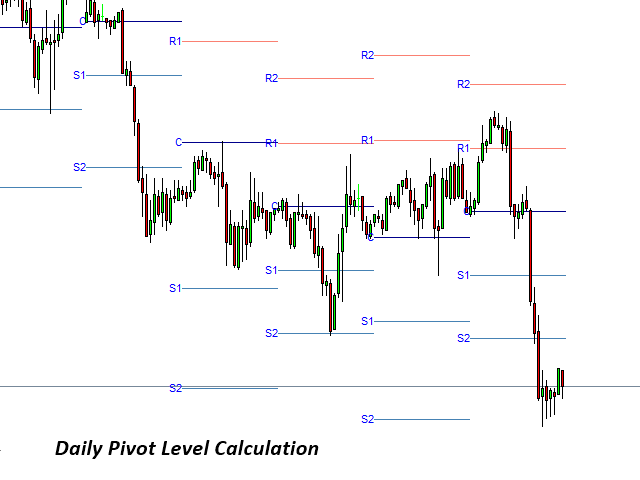
Análisis de pivote
Hemos añadido la técnica estándar de análisis de pivote. El análisis de pivote puede ser usado en dos propósitos. En primer lugar, puede utilizar el nivel de pivote para confirmar dos veces los niveles de soporte y resistencia. En segundo lugar, puede utilizar el nivel de pivote para confirmar la tendencia aproximada si ese es su interés. Por ejemplo, si el precio cerró por debajo de S1 o S2 ayer, entonces se puede decir que la tendencia actual es bajista. El análisis de pivote incorporado sólo proporciona pivote diario y usted puede elegir el número de días que desea mostrar los niveles de pivote.
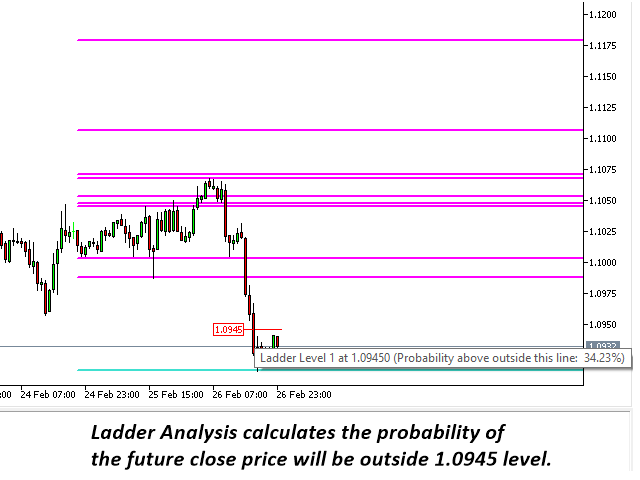
Análisis de escalera
En pocas palabras, el análisis de escalera responderá a la pregunta de cuál es la probabilidad de que el precio de cierre se mantenga fuera del nivel especificado de su interés. Por ejemplo, usted cree que el nivel 1.2400 es importante y quiere averiguar cuál es la probabilidad de que el precio de cierre realmente termine por encima de este importante nivel. Entonces puede utilizar este Análisis Escalonado para encontrar la probabilidad.
Configuración de Entrada
La configuración por defecto funciona bien para la mayoría de los pares de divisas y marcos de tiempo. Cambiar los parámetros de entrada es extremadamente simple y auto explicativo como siempre. La mayoría de las veces usted utilizará la configuración por defecto.
Guía de Estrategias de Trading
Puede utilizar Precision Support Resistance junto con cualquiera de los siguientes análisis técnicos.
Guía para el indicador de resistencia de soporte (Guía de estrategia principal)
Guía del indicador de detección de patrones armónicos
Guía para el Indicador de Oferta y Demanda
Guía para el patrón de triángulo, cuña descendente, cuña ascendente y canal
Guía para el Indicador de Onda de Elliott
Nota Importante
Este es un producto listo para usar. Por lo tanto, no aceptamos ninguna solicitud de modificación o personalización de este producto. Además, no proporcionamos ninguna biblioteca de códigos ni soporte para la codificación de este producto.