Pair Trading Station MT5
- Indicadores
-
Young Ho Seo
 Harmonic Pattern Indicator - Repainting + Japanese Candlestick Pattern Scanner + Automatic Channel + Many more
https://www.mql5.com/en/market/product/4488 - Versión: 7.2
- Actualizado: 13 octubre 2021
- Activaciones: 5
Cómo utilizar Pair Trading Station
La Estación de Operaciones de Pares se recomienda para el marco temporal H1 y puede utilizarla para cualquier par de divisas. Para generar señales de compra y venta, siga los siguientes pasos para aplicar la Estación de Comercio de Pares a su terminal MetaTrader.
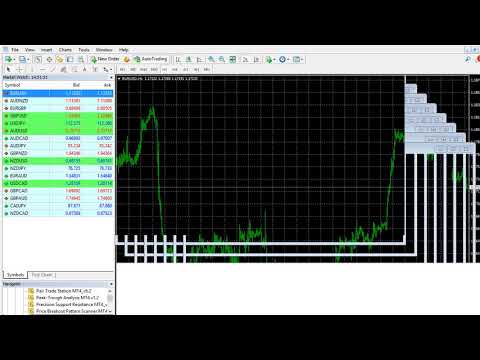
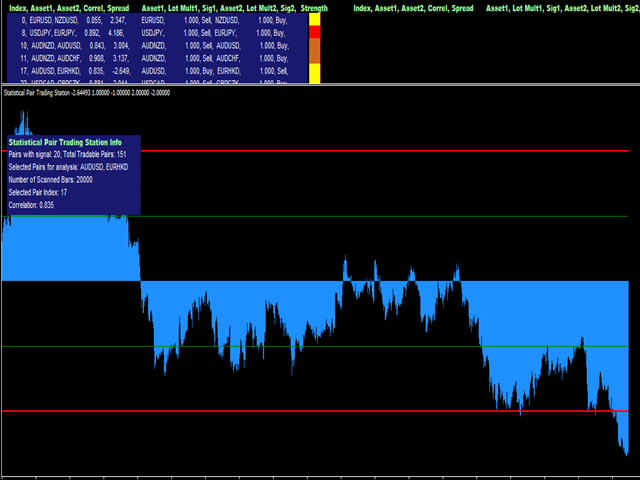
- Cuando cargue la estación de comercio de pares en su gráfico, la estación de comercio de pares evaluará los datos históricos disponibles en sus plataformas MetaTrader para cada par de divisas. En su gráfico, la cantidad de datos históricos disponibles se mostrará para cada par de divisas al principio para su información. La condición mínima para el cálculo de las estadísticas de negociación de pares depende realmente de los datos históricos disponibles. Por ejemplo, para EURUSD y GBPUSD, MetaTrader Terminal debe tener datos históricos coincidentes para calcular las estadísticas de trading de pares para estos pares. Cuando no hay suficientes datos históricos, puede hacer algunas cosas. En primer lugar, puede abrir gráficos para ese par de divisas y MetaTrader puede cargar algunos de los datos históricos. En segundo lugar, puede utilizar el centro de datos históricos para cargar los datos históricos de forma manual.
- En segundo lugar, tiene que decidir el nivel de correlación para la estación de comercio de pares para generar señales de comercio. Un nivel de correlación más alto le dará señales de operación más precisas, pero podría obtener menos señales de operación. Según nuestra experiencia, la correlación debe ser superior a 0,7.
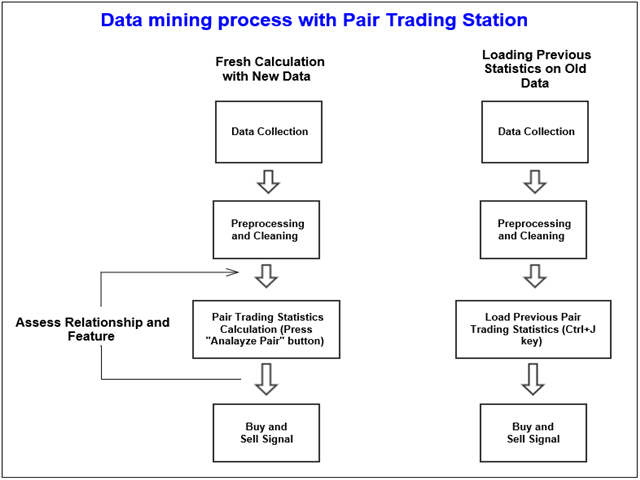
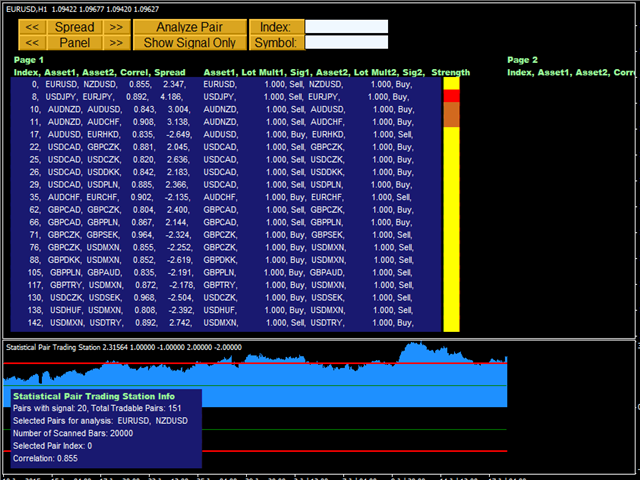
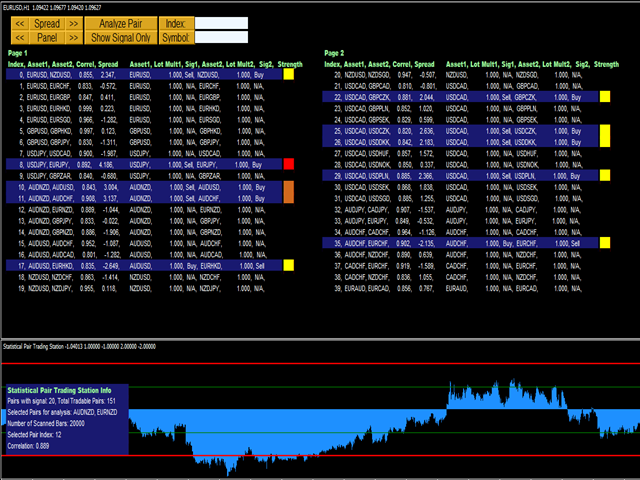
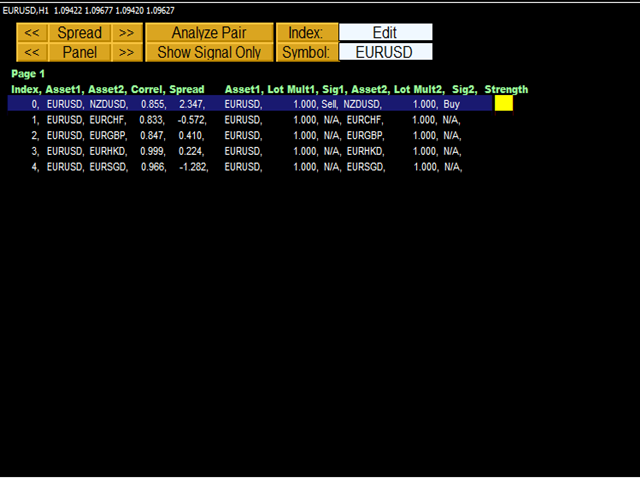
- Una vez que haya establecido la cantidad de barras que se utilizarán en el cálculo y el nivel de correlación, es hora de pedirle a su Estación de Operaciones de Pares que realice un cálculo intensivo para generar señales de operación. Simplemente haga clic en el botón "Analizar Par" para proceder al cálculo. El cálculo puede tardar entre 30 segundos y varios minutos. El tiempo de cálculo depende principalmente de dos factores, incluyendo la cantidad de barras a utilizar y el número de pares de divisas en su vigilancia del mercado. Si ya ha calculado las estadísticas de negociación de pares últimamente, no tiene que volver a realizar el cálculo intensivo porque la estación de negociación de pares guarda las últimas estadísticas de negociación de pares. Para cargar las últimas estadísticas, sólo tiene que pulsar "Ctrl "+ J en su teclado.
Debe Leer y Seguir
Mantenga la cantidad correcta de símbolos en su reloj de mercado. De lo contrario, puede sobrecargar su cpu y memoria. Comience primero con 8 símbolos importantes en la vigilancia del mercado, luego aumente gradualmente el número a medida que entienda el proceso.
Muchos operadores no son conscientes de la cantidad de datos históricos que se cargan en sus gráficos. Por defecto, normalmente se cargan pocos datos históricos, preestablecidos por su broker. Para aumentar rápidamente los datos históricos en sus gráficos para muchos pares de divisas, en el centro histórico, puede descargar sólo los datos históricos H1 para un procesamiento rápido. Una vez calculadas y guardadas las estadísticas de negociación de pares, no tiene que preocuparse de si su broker sobrescribe o borra sus datos históricos porque la Estación de Negociación de Pares seguirá generando señales utilizando la información guardada.
Variable de entrada Descripción
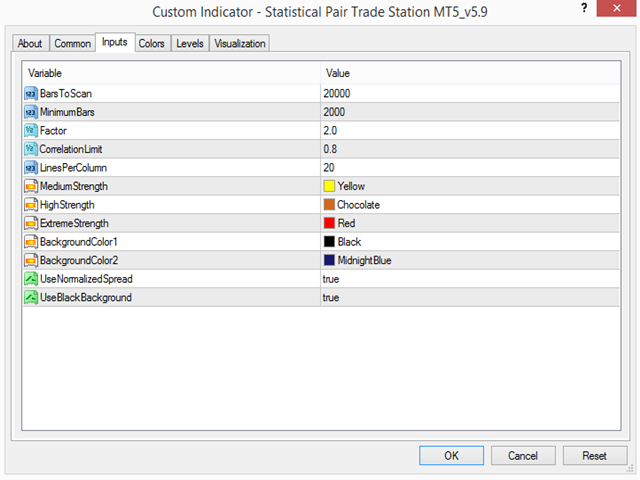
- Barras a escanear para el cálculo: Para calcular las estadísticas de trading de pares, necesita especificar cuántos datos históricos va a utilizar en el cálculo. Compruebe los pares de divisas con menor y mayor cantidad de datos históricos para hacerse una idea de la cantidad de datos históricos disponibles en su terminal MetaTrader. A continuación, elija una buena cantidad de datos para calcular las estadísticas de negociación de pares.
- Barras mínimas para calificar para el cálculo: Pair Trading Station omitirá el cálculo si el par de divisas tiene menos de barras mínimas
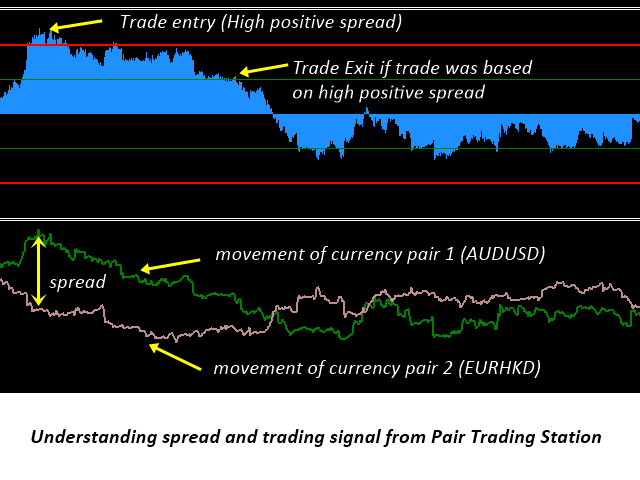
- Factor mínimo para calificar para la señal: normalmente la señal se califica a partir del factor 2 como en la puntuación z de la desviación estándar
- Límite de correlación para emparejar pares: Si la correlación es demasiado baja, Pair Trading Station omitirá el cálculo.
- Líneas por columna cuando se muestra la señal: Esta variable especificará cuántas líneas de señal se mostrarán por columna en su gráfico
- Color para señal de fuerza media:
- Color de
- control
- para la señal de fuerza media Color para la señal de fuerza alta:
- Color de
- control
- para la señal de intensidad alta Color para la señal de intensidad extrema: Color de control para la señal de intensidad extrema
Nota importante
Este producto está disponible en la tienda. Por lo tanto, no aceptamos ninguna modificación personal o solicitud de personalización. Para nuestros productos, no proporcionamos ninguna biblioteca de código o cualquier apoyo para su codificación.


You can tell that so much work has gone into building the product, so far its a massive secondary confirmation tool for my trading decisions!