Tick Hour Tick MT5
- Indicadores
- Versión: 4.9
- Actualizado: 19 noviembre 2021
- Activaciones: 5

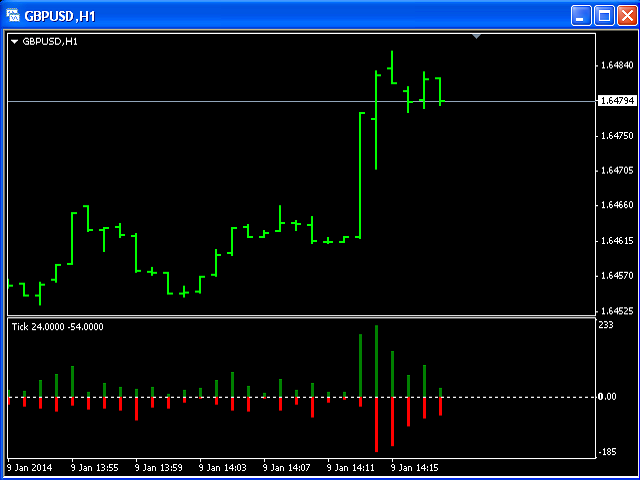
Este indicador está diseñado para el marco de tiempo H1 y muestra:
- Suma de puntos cuando el precio sube (Histograma Verde).
- Suma de puntos cuando el precio baja (histograma rojo).
En otras palabras, por el número y la proporción de puntos alcistas y bajistas, se puede hacer un análisis técnico del estado del mercado.
Si el histograma verde prevalece sobre el rojo, se puede concluir que en este momento los compradores son más fuertes que los vendedores, y viceversa, si el histograma rojo prevalece sobre el verde, los vendedores son más fuertes que los compradores.