FORTS Total Orders
- Indicadores
-
Dmitriy Skub
 Education: engineer-physicist, with specialization - automatic control systems.
Make programs on C++ for about 25 years. At now - I use C# only.
I'm interested in trading from 2005.
From 2013 - FORTS only (no FOREX). From 2024 - Cripto, too - Versión: 1.5
- Actualizado: 1 diciembre 2021
- Activaciones: 5
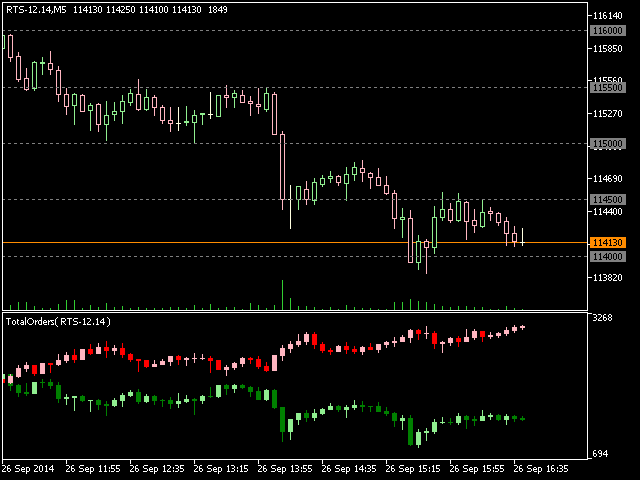
Este indicador muestra la relación del número de órdenes de compradores/vendedores para el mercado de futuros FORTS de Rusia. Ahora, puede recibir esta información en tiempo real en su terminal МetaТrader 5. Esto le permite desarrollar estrategias comerciales totalmente nuevas o mejorar las existentes.
Los datos sobre la relación del número de órdenes se reciben de la base de datos (texto CSV o binario a discreción del usuario). Así, al finalizar una sesión de negociación y desactivar el terminal (o PC), los datos se guardan y se cargan en el gráfico cuando se vuelve a iniciar el terminal.
Puede utilizar FORTS All Saver o cualquier otra utilidad que guarde datos en el mismo formato para mantener la base de datos del ratio del número de órdenes.
La relación del número de órdenes se muestra en forma de dos gráficos de velas (para compradores y vendedores). El marco temporal mínimo permitido es М1 (un minuto). Por lo tanto, se puede ver los cambios de la relación del número de órdenes dentro de la barra y examinar su dinámica en comparación con las barras vecinas.
Configuración
Usar archivo CSV: Sí - el historial se toma de un archivo CSV; No - el historial se toma de un archivo binario. Naturalmente, el fichero debe estar disponible en el directorio del terminal.
Utilizar directorio común: Sí - utiliza la carpeta común de todos los terminales para acceder a la base de datos del historial; No - cada terminal MT5 instalado en el sistema utiliza su propio directorio: "MQL5\Files\TotalOrders".
File Name Prefix - prefijo para formar el nombre del fichero. El nombre del fichero está formado por un prefijo, el atributo COMPRA/VENTA, el nombre del símbolo y la extensión. Por ejemplo "TotalPedidosCOMPRA-GAZR-6.14.CSV". Si se establece una línea vacía como prefijo, se utiliza el prefijo por defecto "TotalOrders".
Periodo de visualización del historial - periodo del historial que se muestra en el gráfico. Puede establecerse desde un día (día de negociación) hasta un año y no depende del marco temporal del gráfico. Por supuesto, el historial debe estar físicamente presente en el directorio correspondiente del PC del usuario.
Esquema de colores del gráfico - esquema de colores del indicador. Se puede seleccionar de la lista - colores oscuros, colores claros, colores claros alternos, blanco sobre negro y negro sobre blanco.
Mostrar Valores en el Gráfico - mostrar/ocultar los valores actuales de Apertura/Altura/Baja/Cierre como dígitos en la ventana del indicador.
Propuesta para usuarios interesados:
Si tienes ideas para mejorar este o cualquiera de mis otros productos, por favor escríbeme. Obtendrás un gran descuento para cualquiera de mis productos si la idea se lleva a cabo.
Por favor, escriba todas sus sugerencias en la pestaña Comentarios de esta página, para que podamos tener una prueba documental de las ideas y ver quién es el primer autor.