Alligator Steps
- Indicadores
- Versión: 1.42
- Actualizado: 23 marzo 2020
- Activaciones: 5

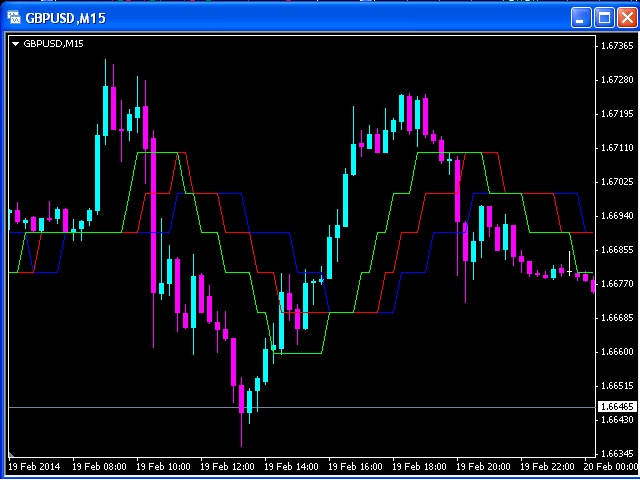
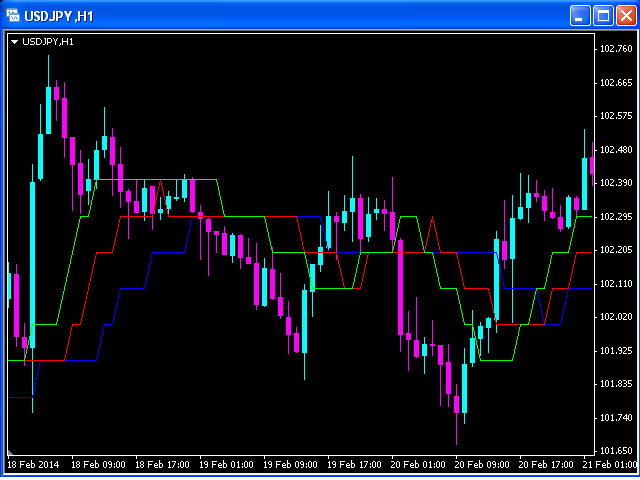
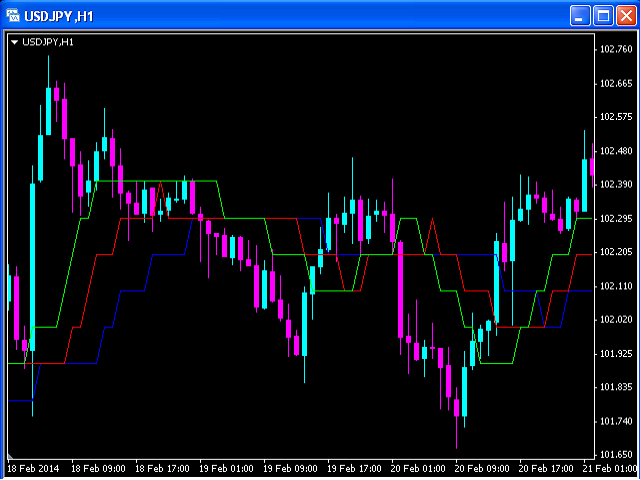
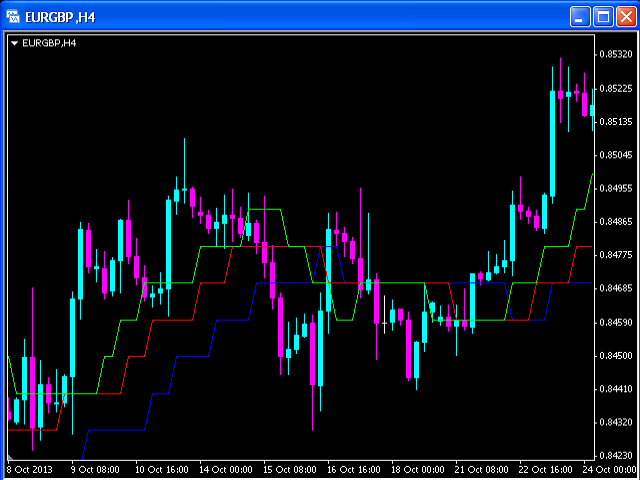
Este indicador se basa en el indicador Alligator clásico.
El indicador propuesto tiene la capacidad de aumentar un efecto suave en el indicador Alligator.
Este indicador podría desempeñar un papel importante en la determinación de las líneas de soporte y resistencia.
El soporte se produce cuando los precios a la baja se detienen, cambian de dirección y comienzan a subir. El soporte suele considerarse como un "suelo" que sostiene o mantiene los precios. La resistencia es un nivel de precios en el que los precios al alza se detienen, cambian de dirección y comienzan a bajar.