Topical levels

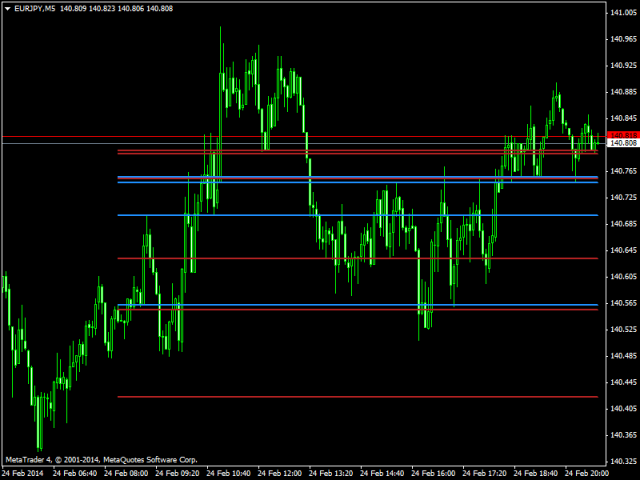
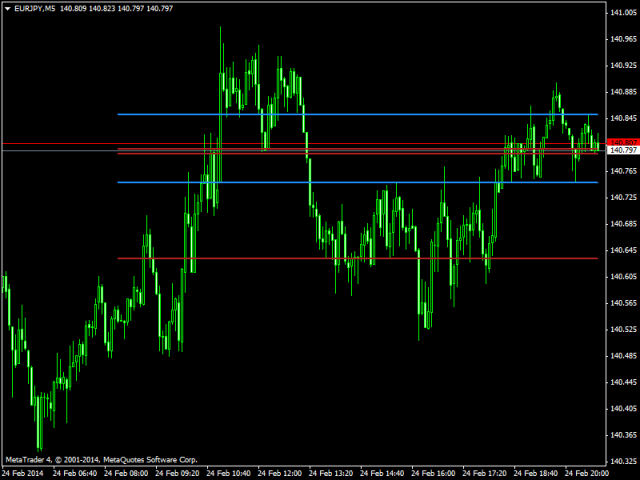
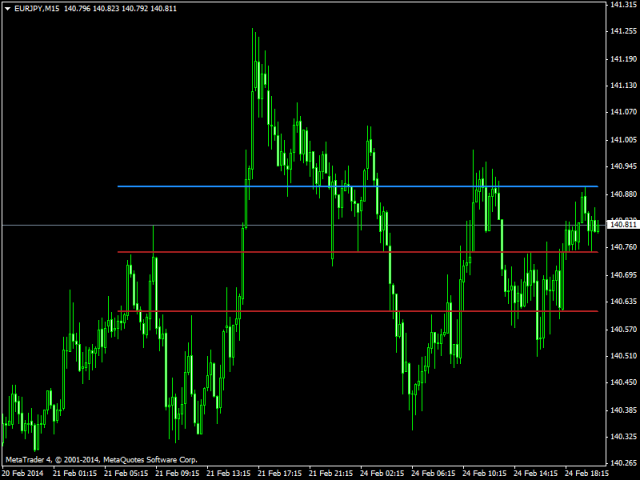
显著指标计算的价格水平,如果红的水平,那么价格将其分解,如果蓝到了。如果价格接近蓝色级别低于他的罢工toskoree总价,如果顶部更容易从水平反弹。同样,如果价格移动到红色顶层,它很可能是故障的水平,如果低于,则有可能反弹。
因为酒吧的水平已失去意义从计划中删除后得出水平等于CalculationBars 。
非常适合用于交易市场上挂单:停止改正的趋势和限制, SL和TP水平下一个最低/最高价格设定。与此交易建议的比例SL / TP为不小于1/2。
 
 设置及说明:
CalculationBars - 酒吧来计算的水平;
LineLength -个长度的线棒;
Filtr- 滤噪平滑的价格,价值较低的级别越高( 1 〜100 ) ;
UpColor -色水平,该价格打破了;
DnColor - 色水平,该价格打破了;
LineWidth- 线宽,线的粗细;
推荐产品
Auto Fibo Pro m
DMITRII GRIDASOV
“Auto FIBO Pro” Crypto_Forex 指标 - 是交易中的绝佳辅助工具! - 指标自动计算并放置在图表斐波那契水平和局部趋势线(红色)上。 - 斐波那契水平指示价格可能反转的关键区域。 - 最重要的水平是 23.6%、38.2%、50% 和 61.8%。 - 您可以将其用于反转剥头皮或区域网格交易。 - 还有很多机会可以使用 Auto FIBO Pro 指标来改进您当前的系统。 - 它具有信息价差掉期显示 - 它显示所连接的外汇对的当前价差和掉期。 - 显示屏还显示账户余额、净值和保证金。 - 可以将信息价差掉期显示定位在图表的任何角落: 0 - 左上角,1 - 右上角,2 - 左下角,3 - 右下角。 点击这里查看高质量的交易机器人和指标! 这是仅在此 MQL5 网站上提供的原创产品。
VR Cub
Vladimir Pastushak
VR Cub 这是获得高质量切入点的指标。该指标的开发是为了促进数学计算并简化对仓位入场点的搜索。多年来,该指标所针对的交易策略已被证明其有效性。交易策略的简单性是其巨大的优势,即使是新手交易者也能成功进行交易。 VR Cub 计算开仓点以及获利和止损目标水平,这显着提高了效率和易用性。查看使用以下策略进行交易的屏幕截图,了解简单的交易规则。 设置、设置文件、演示版本、说明、问题解决,可以从以下位置获取 [博客] 您可以在以下位置阅读或撰写评论 [关联] 版本为 [MetaTrader 5] 计算入场点的规则 开仓 要计算入场点,您需要将 VR Cub 工具从最后一个高点拉伸到最后一个低点。 如果第一个点在时间上早于第二个点,交易者等待柱线收于中线上方。 如果第一个点在时间上晚于第二个点,交易者等待柱线收于中线下方。 根据上述条件,严格在 柱线收盘 后建仓。 换句话说,如果我们在小时图上进行交易,那么从最高点到最低点的时间距离必须超过24小时,最高点和最低点之间的点数必须大于或等于平均价格变动每天。 维持和改变市场地位 可以有多个未平仓头寸;每个头寸都可以单独修改。 VR Cub
Super Reversal Pattern
Parfait Mujinga Ndalika
Super Reversal Pattern Indicator Unlock the power of advanced pattern recognition with our Super Reversal Pattern Indicator. Designed for traders seeking precision and reliability, this indicator identifies one of the most effective reversal patterns in technical analysis, offering a significant edge in your trading strategy. Key Features: Non-Repainting Accuracy: Enjoy the confidence of non-repainting technology. Once a Super Reversal Pattern is detected, it remains static, providing consiste
Rainbow Price Visualizer
Vincent Jose Proenca
Rainbow Price Visualizer v1.21 See where the market really breathes. Turns your MT4 chart into an ultra-precise heatmap that highlights price zones favored by big players. Why it matters 300 price levels at 0.2‑pip resolution — microscopic detail. 8 visual themes (Rainbow, Fire, Ocean…) for instant readibility. Smart opacity: low noise fades, real zones pop. Lightweight rendering with automatic cleanup. Fully customizable: saturation, opacity, resolution, history depth. Bands project into the f
The indicator displays the data of the Stochastic oscillator from a higher timeframe on the chart. The main and signal lines are displayed in a separate window. The stepped response is not smoothed. The indicator is useful for practicing "manual" forex trading strategies, which use the data from several screens with different timeframes of a single symbol. The indicator uses the settings that are identical to the standard ones, and a drop-down list for selecting the timeframe. Indicator Paramet
Price Magnets
Ivan Simonika
Price Magnet — Price Density and Attraction Levels Indicator Price Magnet is a professional analytical tool designed to identify key support and resistance levels based on statistical Price Density. The indicator analyzes a specified historical period and detects price levels where the market spent the most time. These zones act as “magnets,” attracting price action or forming a structural base for potential reversals. Unlike traditional Volume Profile tools, Price Magnet focuses on price-time d
Alpha Trend sign Alpha Trend sign 是我么长期以来非常受欢迎的交易工具,它可以验证我们的交易系统,并且明确的提示交易信号,并且信号不会漂移。 主要功能: •  根据市场显示活跃区域,根据指标可以很直观的判断当前行情是属于趋势行情,还是震荡行情。    并根据指标的指示箭头切入市场,绿色箭头提示买入,红色箭头提示卖出。 •  建议使用5分钟以上的时间周期进行交易,避免因为小周期波动出现频繁的交易信号。 •  您也可以开启信号提示,以免错过最佳的交易时机。 •  本指标不但可以很好的预测趋势行情,也可以在宽幅震荡行情中获利。 •  本指标本着大道至简的原则,适合不同阶段的交易者使用。 注意事项: •  Alpha Trend sign 有明确的进出场信号,不建议逆势操作,以免造成损失。 •  Alpha Trend sign 是特别成熟的指标,我们团队人手一个,使用它可以实现稳定盈利。     
Trend Oscillator mw
DMITRII GRIDASOV
趋势振荡器 - 是一种高级自定义 Crypto_Forex 指标,高效的交易工具! - 使用高级新计算方法 - 参数“计算价格”有 20 个选项。 - 有史以来最平滑的振荡器。 - 绿色表示上升趋势,红色表示下降趋势。 - 超卖值:低于 5,超买值:超过 95。 - 使用此指标,有很多机会升级标准策略。 - 具有 PC 和移动警报。 ....................................................................................................................... 点击这里查看高质量的交易机器人和指标! 这是仅在此 MQL5 网站上提供的原创产品。
The indicator detects and displays 3 Drives harmonic pattern (see the screenshot). The pattern is plotted by the extreme values of the ZigZag indicator (included in the resources, no need to install). After detecting the pattern, the indicator notifies of that by a pop-up window, a mobile notification and an email. The indicator highlights the process of the pattern formation and not just the complete pattern. In the former case, it is displayed in the contour triangles. After the pattern is com
这是一个预测蜡烛收盘价的指标。 该指标主要用于 D1 图表。 该指标适用于传统外汇交易和二元期权交易。 该指标可以用作独立的交易系统,也可以作为您现有交易系统的补充。 该指标分析当前蜡烛,计算蜡烛本身内部的某些强度因素,以及前一根蜡烛的参数。 因此,该指标预测市场走势的进一步方向和当前蜡烛的收盘价。 由于这种方法,该指标既适用于短期盘中交易,也适用于中长期交易。 该指标允许您设置指标在分析市场情况期间将产生的潜在信号的数量。 在指标设置中有一个特殊的参数。 此外,该指标可以通过图表上的消息、电子邮件以及推送通知的形式通知新信号。感谢您的关注!交易愉快! 购买后一定要写信给我! 我会给你我的交易指标的建议! 还可以获得奖金!
Crypto_Forex 指标 HTF Ichimoku 适用于 MT4。 - Ichimoku 指标是最强大的趋势指标之一。HTF 表示 - 更高时间框架。 - 此指标非常适合趋势交易者以及与价格行动条目的组合。 - HTF Ichimoku 指标允许您将更高时间框架的 Ichimoku 附加到当前图表。 - 上升趋势 - 红线高于蓝线(并且两条线都在云层上方)/ 下降趋势 - 红线低于蓝线(并且两条线都在云层下方)。 - 仅当价格突破 Ichimoku 云层顶部边界时才打开买入订单。 - 仅当价格突破 Ichimoku 云层底部边界时才打开卖出订单。 - HTF Ichimoku 指标提供了捕捉大趋势的机会。 点击这里查看高质量的交易机器人和指标! 它是仅在此 MQL5 网站上提供的原创产品。
Happy Scalping Indicator
Leandro Bernardez Camero
这个指标是为 激进的 scalping 和 快速进入二元期权 设计的 ,它会在 每根蜡烛图 上生成信号,帮助你随时了解市场的动向。 加入 Happy Scalping 频道: MQL5 不重绘 :当前蜡烛的信号在 实时 生成,这意味着它可以在蜡烛形成过程中发生变化,具体取决于价格是上涨还是下跌,与前一根蜡烛的收盘价相比。 但是,一旦蜡烛 关闭 ,信号的颜色就会 完全固定 。它不会变化、消失或移动。 你看到的就是最终的信号。 为什么这样设计? 因为许多 scalper 重视即时获得信号,特别是在 价格突破或剧烈波动 时,他们可以在价格波动的同一秒钟内抓住这些快速的点数。 另一方面,也有一些交易者更喜欢等待 蜡烛收盘后的确认 ,他们也可以完美使用这个指标。 这两种方法都是有效的 ,该系统可以适应这两种风格。 重要提示: 查看视频,了解如何在实时市场中操作, 如何入场交易,何时交易,何时最好避免交易 。 该指标非常强大 ,但和任何工具一样, 理解其逻辑非常重要 ,才能最大化利用它。 如果有任何疑问,请随时联系我。我会帮你解答。
Noize Absorption Index MT4
Ekaterina Saltykova
5 (1)
Noize Absorption Index - is the manual trading system that measures the difference of pressure between bears forces and bulls forces. Green line - is a noize free index that showing curent situation. Zero value of index shows totally choppy/flat market.Values above zero level shows how powerfull bullish wave is and values below zero measures bearish forces.Up arrow appears on bearish market when it's ready to reverse, dn arrow appears on weak bullish market, as a result of reverse expectation. S
Infinity Trend Pro
Yaroslav Varankin
1 (1)
This is a trend indicator without redrawing Developed instead of the binary options strategy (by the color of the Martingale candlestick) Also works well in forex trading When to open trades (binary options) A signal will appear in the place with a candle signaling the current candle It is recommended to open a deal for one candle of the current timeframe M1 and M5 When a blue dot appears, open a deal up When a red dot appears, open a trade down. How to open trades on Forex. When a signal is rec
Trendiness Index
Libertas LLC
5 (3)
"The trend is your friend" is one of the best known sayings in investing, because capturing large trendy price movements can be extremely profitable. However, trading with the trend is often easier said than done, because many indicators are based on price reversals not trends. These aren't very effective at identifying trendy periods, or predicting whether trends will continue. We developed the Trendiness Index to help address this problem by indicating the strength and direction of price trend
Wave Wolf MT4
Andrei Salanevich
Wave Wold MT4外汇指标旨在搜索狼波并将其显示在交易终端的当前窗口中。 对于在交易中使用狼波的交易者来说,这是一个很好的指标。 它在交易策略中的应用将显着提高其效率和盈利能力。 有关指标的信息 与其他Wolf wave指标不同,Wave Wold MT4外汇指标具有许多显着提高其有效性的功能: 第一个是打开的Windows5point参数(真值)提供信息支持,即扩展了狼波出现在其上的图表的窗口。 例如,如果EURUSD、AUDUSD和GBPUSD图表是开放的,并且每个图表都安装了Wave WOLD MT4指标,那么如果检测到欧元模型,相应的图表将自动被带到其他图表的顶部,这在交易大量工具时变得非常方便。  第二个功能是MACD上的内置发散分析,用户可以自己选择参数(默认设置(12,26,9))。 顺便说一下,通常振荡器的值不显示在工作窗口上,只反映在形成点(5)时的价格标签的颜色上,特别是,如果标签的颜色是蓝色,则没有发散,如果颜色是红 如何使用指标 Wave WOLD MT4指标显示第4个形成点的假设Wolf模型和第5个点的形成区域(所谓的甜区,以黄色显示)。 如
An indicator of pattern #31 ("Long Island") from Encyclopedia of Chart Patterns by Thomas N. Bulkowski. The second gap is in the opposite direction. Parameters: Alerts - show alert when an arrow appears   Push - send a push notification when an arrow appears (requires configuration in the terminal) GapSize - minimum gap size in points ArrowType - a symbol from 1 to 17 ArrowVShift - vertical shift of arrows in points   ShowLevels - show levels ColUp - color of an upward line ColDn - color of a
Crypto_Forex 指标“晨星模式”适用于 MT4。 - 指标“晨星模式”是价格行为交易的非常强大的指标:无需重绘,无延迟。 - 指标检测图表上的看涨晨星模式:图表上的蓝色箭头信号(见图片)。 - 带有 PC、手机和电子邮件警报。 - 还有它的兄弟 - 看跌“黄昏之星模式”指标可用(点击以下链接)。 - 指标“晨星模式”非常适合与支撑/阻力位结合使用。 ................................................................................................................. 点击这里查看高质量的交易机器人和指标! 这是仅在此 MQL5 网站上提供的原创产品。
ZhiBiCCI MT4
Qiuyang Zheng
【ZhiBiCCI】指标适合所有的周期使用,也适合所有的市场品种。 【ZhiBiCCI】绿色实线是逆转看涨背离。绿色虚线是经典的看涨背离。 【ZhiBiCCI】向红色实线是反向看跌背离。红色虚线是古典看跌背离。 【ZhiBiCCI】可以在参数里面设置(Alert、Send mail、Send notification),设置为(true)就可以发送即时信号到警报窗口、电子邮件、即时消息。 参数设置说明: 【displayAlert】:这是警报开关,设置成true,如果出现箭头就会自动警报提示;设置成false,则不会警报提示。 【sendmail_NO_OFF】:这是发送邮件的开关,设置成true,如果出现箭头就会发送邮件到你在MT4设置好的邮箱里面;设置成false,则不会发邮件。 【sendnotification_NO_OFF】:这是发送即时消息的开关,设置成true,如果出现箭头就会发送消息到你的移动设备;设置成false,则不会发消息。 更多好用的指标网址: https://www.mql5.com/en/users/zhengqiuyang/seller
This is a new strategy for SUPPLY DEMAND areas It is based on a calculation using the tick volume to detect the big price action in market for both bear /bull actions this smart volume action candles are used to determine the supply and demand areas prices in between main supply and demand lines indicate sideway market  up arrows will be shown when prices moves above the main supply and the secondary supply lines Down arrows will be shown when prices moves below the main demand and the secondary
Trend Monitor
Pavel Zamoshnikov
4 (4)
The indicator generates early signals basing on ADX reading data combined with elements of price patterns. Works on all symbols and timeframes. The indicator does not redraw its signals. You see the same things on history and in real time. For better visual perception signals are displayed as arrows (in order not to overload the chart). Features Easy to use. Filter configuration only requires selection of sensitivity in the " Sensitivity of the indicator " input. Signals can be filtered using
Trend Ray
Andriy Sydoruk
The indicator shows the potential trend direction by cyclical-wave dependence. Thus, all the rays of the intersection will be optimal rays, in the direction of which the price is expected to move, taking into account the indicator period. Rays can be used as a direction for potential market movement. But we must not forget that the approach must be comprehensive, the indicator signals require additional information to enter the market.
PZ Harmonacci Patterns
PZ TRADING SLU
3.17 (6)
可以说,这是您可以为MetaTrader平台找到的最完整的谐波价格形成自动识别指标。它检测19种不同的模式,像您一样认真对待斐波那契投影,显示潜在的反转区域(PRZ),并找到合适的止损和获利水平。 [ 安装指南 | 更新指南 | 故障排除 | 常见问题 | 所有产品 ] 它检测19种不同的谐波价格形态 它绘制了主要,衍生和互补的斐波那契投影(PRZ) 它评估过去的价格走势并显示每个过去的形态 该指标分析其自身的质量和性能 它显示合适的止损和获利水平 它使用突破来表明合适的交易 它在图表上绘制所有样式比率 它实现了电子邮件/声音/视觉警报 受斯科特·M·卡尼(Scott M. Carney)的书的启发,该指标旨在满足最纯粹和最熟练的交易者的需求。但是,它采取了一种使交易更容易的方式:在向交易发出信号之前,它会等待Donchian朝正确方向突破,从而使交易信号非常可靠。 斐波那契投影与向量无关 它实现了电子邮件/声音/推送警报 它绘制了ABCD投影 重要提示: 为了符合 Scott M. Carney先生 的商标申诉,某些图案名称已重命名为不言自明的替代方式, Scott M.
Trend Scanner
Vladimir Kalendzhyan
4.33 (6)
By purchasing this indicator, you have the right to receive a free copy of one of   my other indicator's or advisor’s!  (All future updates are included. No limits) . To get it , please contact me by  mql5 message ! The Trend Scanner trend line indicator displays the trend direction and its changes. The indicator works on all currency pairs and  timeframes. The indicator simultaneously displays multiple readings on the price chart: the support and resistance lines of the currency pair, the exist
Title : Market Bias Indicator - Oscillator-Based Trading Tool Introduction : Discover the potential of the "Market Bias Indicator," a revolutionary oscillator-based trading tool designed for precise market analysis. If you're in search of a robust alternative to traditional bias indicators, your quest ends here. Market Bias Indicator offers unparalleled accuracy in identifying market sentiment and is your gateway to confident trading decisions. Recommended Trading Pairs : Market Bias Indicator i
The Th3Eng PipFinite indicator is based on a very excellent analysis of the right trend direction with perfect custom algorithms. It show the true direction and the best point to start trading. With StopLoss point and Three Take Profit points. Also it show the right pivot of the price and small points to order to replace the dynamic support and resistance channel, Which surrounds the price. And Finally it draws a very helpful Box on the left side on the chart includes (take profits and Stop loss
The indicator detects and displays Shark harmonic pattern (see the screenshot). The pattern is plotted by the extreme values of the ZigZag indicator (included in the resources, no need to install). After detecting the pattern, the indicator notifies of that by a pop-up window, a mobile notification and an email. The indicator highlights the process of the pattern formation and not just the complete pattern. In the former case, it is displayed in the contour triangles. After the pattern is comple
Chart Patterns Detect 15 patterns (Ascending Triangle, Descending Triangle, Rising Wedge, Falling Wedge, Bullish Flag, Bearish Flag, Bullish Rectangle, Bearish Rectangle Symmetrical triangle, Head and Shoulders, Inverted Head and Shoulders, Triple top, Triple Bottom, Double Top, Double Bottom) Use historical data to calculate the probability of each pattern to succeed (possibility to filter notification according to the chance of success) gives graphic indication about the invalidation level and
The   Trendlines Oscillator   helps traders identify trends and momentum based on the normalized distances between the current price and the most recently detected bullish and bearish trend lines. The indicator features bullish and bearish momentum, a signal line with crossings, and multiple smoothing options. USAGE The   Trendlines Oscillator   works by systematically: Identifying pivot highs and lows. Connecting pivots to form bullish (support) and bearish (resistance) trendlines. Measuring
该产品的买家也购买
Scalper Inside PRO
Alexey Minkov
4.74 (69)
An exclusive indicator that utilizes an innovative algorithm to swiftly and accurately determine the market trend. The indicator automatically calculates opening, closing, and profit levels, providing detailed trading statistics. With these features, you can choose the most appropriate trading instrument for the current market conditions. Additionally, you can easily integrate your own arrow indicators into Scalper Inside Pro to quickly evaluate their statistics and profitability. Scalper Inside
Gann Made Easy
Oleg Rodin
4.83 (156)
Gann Made Easy 是一个专业且易于使用的外汇交易系统,它基于使用先生理论的最佳交易原则。 W.D.江恩。该指标提供准确的买入和卖出信号,包括止损和获利水平。您甚至可以使用推送通知在旅途中进行交易。 购买后请联系我,即可免费获得交易指导和超棒的额外指标! 您可能已经多次听说过江恩交易方法。通常 Gann 的理论不仅对于新手交易者而且对于那些已经有一定交易经验的人来说都是非常复杂的东西。这是因为江恩的交易方法在理论上并不那么容易应用。我花了几年时间来完善这些知识,并将最好的原则应用到我的外汇指标中。 该指标非常易于应用。您所需要的只是将其附加到您的图表并遵循简单的交易建议。该指标不断进行市场分析工作并寻找交易机会。当它检测到一个好的入口点时,它会为您提供一个箭头信号。该指标还显示止损和获利水平。 换句话说,当您像先生一样进行交易时,该指标会为您提供最佳江恩建议。江恩亲自告诉你此时此刻该做什么。但最好的部分是您不需要了解任何有关江恩交易原则的知识,因为该指标会为您完成整个市场分析工作。
M1 Sniper
Oleg Rodin
5 (20)
M1 SNIPER 是一款易于使用的交易指标系统。它是一个专为 M1 时间框架设计的箭头指标。该指标可以作为独立的系统在 M1 时间框架下进行剥头皮交易,也可以作为您现有交易系统的一部分使用。虽然该交易系统专为 M1 时间框架交易而设计,但它也可以用于其他时间框架。我最初设计此方法是为了交易 XAUUSD 和 BTCUSD。但我发现这种方法在其他市场交易中也同样有用。 指标信号既可以顺势交易,也可以逆势交易。我教授一种特殊的交易技巧,帮助您利用指标信号进行双向交易。该方法基于使用特殊的动态支撑位和阻力位区域。 购买后,您可以立即下载 M1 SNIPER 箭头指标。此外,我还为所有 M1 SNIPER 工具用户免费提供下方屏幕截图所示的 Apollo Dynamic SR 指标!这两个指标的组合可以帮助您更轻松、更准确地利用 M1 时间框架进行交易。 购买后请联系我,免费获取交易提示和奖励指标! 祝您交易成功!
Linear Trend Predictor — 结合切入点和方向支撑线的趋势指标。按照突破高/低价通道的原理运作。该指标算法过滤市场噪音,考虑波动性和市场动态。 指示器功能  使用平滑方法,显示市场趋势和开立买入或卖出订单的切入点。  适合通过分析任何时间范围内的图表来确定短期和长期的市场走势。  输入参数可适应任何市场和时间范围,允许交易者独立定制指标。  设定的指示信号不会消失,也不会重新绘制——它是在蜡烛收盘时确定的。  几种类型的通知以箭头组合。  该指标既可以作为独立的交易系统使用,也可以作为其他交易系统的补充。  可供任何经验水平的交易者使用。 主要参数 Volatility Smoothing Level - 指标的主要参数,允许您配置指标以实现舒适的操作。 它的数字范围是 1 到 100,从而增加了您可以获得更长趋势运动的平滑度。 通过少量的数字,您可以获得短期走势并快速退出交易。 使用指标进行交易的时刻:  红线和箭头表示下降趋势和卖出开盘信号。止损应根据前一个上分形来设置。  黄线和箭头表示上升趋势和买入开盘信号。止损应根据前一个下分形来设置。
Dynamic Scalper System
Vitalyi Belyh
5 (1)
“ Dynamic Scalper System ”指标专为在趋势波内进行剥头皮交易而设计。 已在主要货币对和黄金上进行测试,并可与其他交易工具兼容。 提供顺势短线建仓信号,并提供额外的价格变动支持。 指标原理: 大箭头决定趋势方向。 在趋势波内,我们采用一种生成小箭头形式的剥头皮交易信号的算法。 红色箭头代表看涨方向,蓝色箭头代表看跌方向。 敏感的价格变动线会沿着趋势方向绘制,并与小箭头信号协同作用。 信号运作方式如下:当线在适当时刻出现时,将形成入场信号;在出现线时,持仓;线完成后,平仓。 建议的操作时间范围为M1 - H4。 箭头在当前K线上方形成,如果下一根K线已开仓,则不会重新绘制上一根K线上方的箭头。 输入参数 Trend Wave Period - 趋势方向(大箭头)的周期,改变趋势波的时间间隔。值 1 表示趋势方向的最长持续时间,参数值越大,持续时间越短。 Scalper Arrows Period - 信号箭头(小箭头)的计算周期,改变入场信号的生成频率。值 3 表示最频繁的生成频率,参数值越大,箭头频率越低,准确度越高。 这些参数可以根据不同的时间范
Atomic Analyst
Issam Kassas
5 (4)
首先值得强调的是,该交易指标是非重绘、非延迟的指标,这使其成为手动和机器人交易的理想选择。 用户手册:设置、输入和策略。 Atomic Analyst是一种PA价格行动指标,利用价格的力量和动量来寻找市场上更好的机会。配备了高级过滤器,可帮助去除噪音和假信号,并提高交易潜力。使用多层复杂的指标,Atomic Analyst扫描图表,并将复杂的数学计算转化为任何初学者都能理解并用来做出一致交易决策的简单信号和颜色。 “Atomic Analyst”是专为新手和经验丰富的交易者量身定制的综合交易解决方案。它将高级指标和一流功能融合为一体的交易策略,使其成为所有类型交易者的多功能选择。 日内交易和剥头皮策略:专为快速准确的日内交易和短期交易而设计。 日内和摆动交易策略:可用作追求价格大幅波动的日内和摆动交易者的可靠工具。 多货币和市场:凭借其可靠的精度,在不同的工具和市场上运作。 多个时间框架:可在多个时间框架上使用,性能良好。 稳定性:所有指标均不重绘、不重绘和不滞后,确保可靠的信号。 信号清晰度:提供箭头信号,用于清晰的入场和出场点。 实时警报:通过交易入场、SL和TP警报通知交易者
Trend Lines PRO
Roman Podpora
5 (1)
TREND LINES PRO 帮助您了解市场真正的方向转变点。该指标显示真实的趋势反转点以及主要参与者重新入场的时机。 您可以看到 BOS线、 趋势变化和更高时间框架的关键水平——无需复杂的设置或不必要的干扰。信号不会重绘,并在K线收盘后仍然保留在图表上。 VERSION MT 5    -   与……搭配使用时,可发挥其最大潜力   RFI LEVELS PRO 指示器 该指标显示的内容: 实际变化 趋势(BOS 线) 一旦信号出现,它就始终有效!这与会重绘的指标有着重要的区别,后者可能会发出信号后又改变信号,从而导致资金损失。现在,您可以更精准、更准确地进入市场。此外,还有一个功能,会在箭头出现后为K线着色,直到达到目标价位(止盈)或出现反转信号为止。 重复条目   以及主要玩家的充值 为了提高寻找入场点时的视觉清晰度,我们创建了一个模块,该模块首先显示买入/卖出区域,并在该区域内寻找最佳入场点。此外,我们还加入了智能逻辑来管理止损位,该逻辑会随着时间的推移逐步降低止损位的大小,从而降低入场交易时的初始风险(移动止损位)。 信号强度水平(BOS) 该指标采用三个显著性等级来衡量
NAM Order Blocks
NAM TECH GROUP, CORP.
3.67 (3)
MT4多時限訂單塊檢測指示器。 特徵 -在圖表控制面板上完全可自定義,提供完整的交互。 -隨時隨地隱藏和顯示控制面板。 -在多個時間範圍內檢測OB。 -選擇要顯示的OB數量。 -不同的OB用戶界面。 -OB上的不同過濾器。 -OB接近警報。 -ADR高低線。 -通知服務(屏幕警報|推送通知)。 概括 訂單塊是一種市場行為,它指示從金融機構和銀行收取訂單。著名的金融機構和中央銀行帶動了外匯市場。因此,交易者必須知道他們在市場上正在做什麼。當市場建立訂單塊時,它會像發生大多數投資決策的範圍一樣移動。 訂單建立完成後,市場將朝著上升和縮小的方向發展。訂單大宗交易策略的關鍵術語是它包括機構交易者正在做的事情。由於它們是主要的價格驅動因素,因此包括機構交易在內的任何策略都可以。 您將在任何時間範圍內實時看到訂單塊,使用我們的控制面板,您將能夠在所選的歷史記錄週期內檢測常規,拒收和未大寫的訂單塊。 現在您可以接收到訂單塊接近警報,我們在MT4上顯示屏幕通知,並將通知推送到您的手機!
GOLD Impulse with Alert
Bernhard Schweigert
4.67 (12)
这个指标是我们2个产品 Advanced Currency IMPULSE with ALERT  +   Currency Strength Exotics 的一个超级组合。 它适用于所有时间框架,并以图形方式显示8种主要货币和一种符号的强势或弱势冲动! 该指标专门用于显示任何符号的货币强度加速,如黄金、异国货币对、商品、指数或期货。这是它的第一个指标,任何符号都可以被添加到第9行,以显示黄金、白银、石油、DAX、US30、MXN、TRY、CNH等的真实货币强度加速(冲动或速度)。 建立在新的基础算法上,它使识别和确认潜在的交易更加容易。这是因为它以图形方式显示了一种货币的强势或弱势是否正在加速,并测量了这种加速的速度--把它想象成你汽车中的速度表。当你加速时,事情显然会发生得更快,这在外汇市场上也是一样的,即如果你配对的货币正在向相反的方向加速,你就会发现一个潜在的有利可图的交易。 动态市场斐波那契28水平被用作警报触发器,将适应市场活动。如果冲动击中黄色触发线,你将收到警报。然后你就知道作为一个交易员应该做什么。货币对和方向已经给出。只需点击警报按钮,就可以切换到该货
MTF Supply Demand Zones
Georgios Kalomoiropoulos
4.82 (22)
下一代自动化供需区。适用于任何图表的创新算法。所有区域都是根据市场的价格行为动态创建的。 两种类型的警报 --> 1) 当价格触及区域时 2) 当新区域形成时 你不会再得到一个无用的指标。您将获得一个完整的交易策略和经过验证的结果。     新的功能:     价格触及供需区时发出警报     创建新的供应/需求区时发出警报     推送通知警报     以点为单位的区域宽度标签     关于 MTF 的又一个时间表。因此,现在您将能够看到高于当前 3 个时间帧,而不是高于当前 2 个时间帧     启用/禁用警报/区域/MTF 功能的按钮 您获得的优势:     消除交易中的情绪。     客观化您的交易条目。     通过高概率设置提高您的利润。     节省绘图区域的时间。     像专业人士一样交易金融市场。     任何市场的即时多时间框架分析。 你在图表上看到了什么?     蓝色和红色矩形是当前时间范围的供需区。     虚线样式线是当前上方第一个时间范围内的供需区域。     实线样式线是当前上方第二个时间范围内的
Currency Strength Exotics
Bernhard Schweigert
4.88 (33)
目前8折优惠! 对任何新手或专家交易者来说都是最好的解决方案! 这个指标是专门用来显示任何符号的货币强度,如异国货币对、商品、指数或期货。它是同类产品中的第一个,任何符号都可以添加到第9行,以显示黄金、白银、石油、DAX、US30、MXN、TRY、CNH等的真实货币强度。这是一个独特的、高质量的、负担得起的交易工具,因为我们已经纳入了一些专有的功能和一个新的公式。想象一下,你的交易将如何改善,因为你能够准确地确定新趋势或剥头皮机会的触发点? 用户手册:点击这里   https://www.mql5.com/en/blogs/post/708876 它适用于所有时间框架。你将很快能够看到TREND! 根据新的基础算法设计,它使识别和确认潜在交易变得更加容易。这是因为它以图形方式显示了8种主要货币和一种符号的强弱。 该指标显示了8种主要货币(澳元加元瑞士法郎欧元英镑日元新西兰美元)的强弱线,再加上一个符号! 该指标显示了符号的真实价值。例如:对于XAUUSD(黄金):价格以美元报价。如果黄金在上涨,你怎么能知道是黄金的强势还是美元的弱势?只有当黄金走强时,我们才会进行交易。该指
MetaForecast M4
Vahidreza Heidar Gholami
5 (2)
MetaForecast能够根据价格数据中的谐波来预测和可视化任何市场的未来走势。虽然市场不总是可预测的,但如果价格中存在模式,MetaForecast可以尽可能准确地预测未来。与其他类似产品相比,MetaForecast通过分析市场趋势可以生成更精确的结果。 输入参数 Past size (过去的尺寸) 指定MetaForecast用于创建生成未来预测模型的柱数量。该模型以一条黄色线绘制在所选柱上。 Future size (未来的尺寸) 指定应预测的未来柱数量。预测的未来以粉色线表示,并在其上绘制了蓝色回归线。 Degree (程度) 此输入确定了MetaForecast将在市场上进行的分析级别。 Degree 描述  0 对于程度0,建议使用较大的值来设置“过去的尺寸”输入,以覆盖价格中的所有高峰、低谷和细节。  1 (建议的) 对于程度1,MetaForecast可以理解趋势,并通过较小的“过去的尺寸”生成更好的结果。  2 对于程度2,除了趋势,MetaForecast还可以识别反转点。对于大于1的程度,必须使用较高的“细节”和“噪音减少”输入值。  大于2 不建议使用大于
Super Reversal Indicator with Alert 概述 Super Reversal Indicator with Alert 是一款多时间周期交易工具,旨在通过结合随机指标动量、供需区域以及价格反转信号,帮助交易者识别高概率的市场反转机会。 该指标通过清晰的视觉信号和实时提醒,帮助交易者发现潜在的市场转折点。 核心功能 多时间周期随机指标分析 使用来自更高时间周期的随机振荡器(用户可自定义) 识别动量变化和交叉信号 包含超买和超卖水平,帮助实现更精准的入场 反转拒绝信号 检测关键价位上的强烈拒绝形态 识别以下位置的反转 日内高点卖出反转 日内低点买入反转 在图表上直接绘制箭头,直观清晰 供需区域 自动绘制来自 H4 和 D1 时间周期的重要区域 标记 供应区(潜在卖出区域) 需求区(潜在买入区域) 区域会动态更新并延伸至图表 智能提醒系统 弹出提醒 声音提醒 手机推送通知 邮件提醒(可选) 提醒触发条件包括 随机指标信号 拒绝信号 价格进入区域 可视化信号 在图表上显示买入和卖出箭头 清晰标注反转条件 界面简洁,易于阅读 交易逻辑 该指标结合三大核心要素来识别反
Introducing the Delta Volume Profile Indicator - Unleash the Power of Institutional Precision!  Technical Indicator: Are you ready to trade like the pros? The Delta Volume Profile Indicator is no ordinary tool. It’s a high-precision, cutting-edge indicator that puts the power of institutional-grade trading in your hands. This unique indicator analyses delta volume distribution in real-time, revealing the market's hidden buy/sell imbalances that the biggest financial institutions rely on to antic
Order Block Hunter
Noha Mohamed Fathy Younes Badr
5 (10)
Order block hunter indicator is the best indicator for  hunt the order blocks that area where there has been a large concentration of limit orders waiting to be executed Order blocks are identified on a chart by observing previous price action and looking for areas where the price experienced significant movement or sudden changes in direction .This indicator does that for you by using very complicated codes and helps you to take the best areas To buy and sell because it make marks at the best a
Dynamic Forex28 Navigator
Bernhard Schweigert
4.43 (7)
Dynamic Forex28 Navigator - 下一代外汇交易工具。 当前 49% 折扣。 Dynamic Forex28 Navigator 是我们长期流行的指标的演变,将三种功能合二为一: 高级货币强度 28 指标 (695 条评论)+ 高级货币 IMPULSE 带警报 (520 条评论)+ CS28 组合信号(奖励)。 有关指标的详细信息 https://www.mql5.com/en/blogs/post/758844 下一代强度指标提供什么? 您喜欢的原始指标的一切,现在通过新功能和更高的精度进行了增强。 主要特点: 专有货币强度公式。  所有时间范围内的平滑和准确的强度线。 非常适合识别趋势和精确进入。 动态市场斐波那契水平(市场斐波那契)。  此指标独有的独特功能。 斐波那契应用于货币强度,而不是价格图表。 适应实时市场活动以获得准确的反转区域。 实时市场动量。  第 9 行显示市场是活跃还是被动。 对于定时交易至关重要。 全面的警报和显示。  每种货币最强的买入和卖出动量。 ​​28 对的双重动量买入和卖出。 超买/超卖警告外部范围和止损。 反转
Advanced Supply Demand
Bernhard Schweigert
4.91 (299)
现在优惠 40%! 任何新手或专业交易者的最佳解决方案! 该指标是一款独特、高质量、且价格合理的交易工具,因为我们已经整合了许多专有功能和新公式。 依据此更新,您将能够显示双重时间帧区域。 您不仅可以显示一个较高的时间帧,还可以同时显示图表时间帧,加上更高的时间帧:显示嵌套时区。 供需双方所有交易者都会喜欢它。 :) 重要信息披露 高级供需的最大潜力,请访问 https://www.mql5.com/zh/blogs/post/720245   想象您的交易如何得以改善,是因为您能够精准定位入场或目标位吗? 构建于新的底层算法,它可以更轻松地识别出买卖双方之间的潜在失衡。 这是因为它以图形方式展示供需最强劲区域,及其过去的表现(显示旧区域)。 这些功能旨在帮助您更轻松地发现最佳入场区域和价位。 现在您可以针对您的交易品种和时间帧来优化和编辑区域强度! 高级供需指标适用于所有产品和时间帧。 它是一个新的公式,非常新的功能是两个区域强度函数可由用户输入进行调整! 这在交易中是一大优势。 当您学习如何使用专有功能,例如带有价格游离最小 X 因子的区域强度时,您能够判断该区域强劲与否。 供需
RFI levels PRO
Roman Podpora
5 (1)
该指标能够准确显示反转点和价格回落区域。     行业领军人物 。您能洞察新趋势的形成,并以最高的精准度做出决策,掌控每一笔交易。 与……结合时,展现其最大潜力     趋势线专业版   指标  VERSION MT5 该指标显示的内容: 新趋势开始时的反转结构和反转水平及其激活。 显示屏   获利了结   和   止损   风险回报比最低的水平     RR 1:2       。 具有智能减值逻辑的止损。 显示指定指标中两种趋势类型的反转形态。 指标: 根据     趋势线     (全球趋势变化) 潮流专业版     (趋势快速变化) 简单有效   扫描器   实时趋势(新增)。 多时间框架工具筛选。 展示   利润   在 LOGIC AI 信号之后。 以下列出今日走势积极的金融工具。(RB键) 能够为终端启用通知(警报)功能,并向移动设备推送通知。 逻辑人工智能     — 利用人工智能寻找最佳切入点。 只有在启用 MTF(多时间框架分析)模式时,该功能才可用。 兼容性。 当与趋势线指标结合使用时,该指标能发挥其最大潜力。 这     RFI LEVELS PRO    
Adaptive Volatility Range
Stanislav Konin
5 (3)
Adaptive Volatility Range [AVR] is a powerful tool for identifying key trend reversal points. AVR accurately reflects the Average True Range (ATR) of volatility, taking into account the Volume-Weighted Average Price (VWAP). The indicator adapts to any market volatility by calculating the average volatility over a specific period, ensuring a stable rate of profitable trades. You receive not just an indicator but a professional automated trading system , AVR-EA . Advantages: Automated Trading Sys
TPSpro RFI Levels
Roman Podpora
4.86 (28)
俄语说明 /  英文 说明   -  MT5 版本 主要功能: 显示卖家和买家的活跃区域! 该指标显示所有正确的买入和卖出的初始脉冲水平/区域。当这些水平/区域被激活时,即开始寻找入场点的位置,水平线会改变颜色,并填充特定颜色。此外,还会显示箭头,以便更直观地了解情况。 LOGIC AI - 激活模板时显示用于搜索入口点的区域(圆圈) 为了提高视觉清晰度,添加了使用人工智能搜索入口点的显示区域的功能。 显示更高时间范围内的级别/区域(MTF 模式) 新增使用更高时间间隔显示级别/区域的功能。此外,该指标还具有自动趋势检测功能 (   TPSproTREND PRO   )。 独立的专业分步交易算法 该算法专为顺势和逆势的日内交易而设计。每个活动模板均提供详细的说明。 适用于不同的时间范围 TPSpro RFI 水平指标可用于图表上的任何时间间隔,从分钟(M1)到每月(MN)。 图形和声音警报 该指标提供图形和声音提示,让您不会错过交易信号。 此外,还支持手机通知。 简单有效的活性模板扫描器 这是一个非常紧凑的主动模式扫描仪,当在一个方向上的所有时间间隔内激活模式时,它会自动发出警报并
BTMM State Engine Pro MT4
Garry James Goodchild
BTMM State Engine Pro is a MetaTrader 4 indicator for traders who use the Beat The Market Maker approach: Asian session context, kill zone timing, level progression, peak formation detection, and a multi-pair scanner from a single chart. It combines cycle state logic with a built-in scanner dashboard so you do not need the same tool on many charts at once. What it does Draws the Asian session range; session times can follow broker server offset or be set in inputs. Tracks level progression (L
TrendLine PRO MT4
Evgenii Aksenov
4.83 (167)
Trend Line PRO   指标是一个独立的交易策略。 它显示趋势变化,交易的入口点,以及自动计算三个级别的止盈和止损保护 Trend Line PRO  非常适合所有元交易者符号:货币,金属,加密货币,股票和指数 该指标用于真实账户交易,这证实了该策略的可靠性 您可以在这里找到使用   Trend Line PRO   和真实信号的机器人:   https://robomarket.org/product-category/signals/ 目前,Trend Line PRO指标的售价为75美元。 促销后价格为 149 美元 。 趋势线专业的优点 永远不要重绘它的信号; 将其作为独立策略的可能性; 它有三个自动水平止盈和止损水平  该指标具有iCustom信号缓冲区,允许您基于它创建交易机器人 具有通知功能 该指标已证明其在真实账户交易中的有效性 如何设置和优化趋势线PRO指标: 通过更改幅度参数以及 TP 和 SL 水平,将重点放在指标面板上的利润上 您可以使用以下方式自动优化指标参数: Optimizer Utility 详细说明(ENG): 这里 趋势线PRO指标如
Currency Strength Wizard
Oleg Rodin
4.85 (59)
货币强度向导是一个非常强大的指标,为您提供成功交易的一体化解决方案。该指标使用多个时间范围内所有货币的数据来计算这个或那个外汇对的力量。此数据以易于使用的货币指数和货币电力线的形式表示,您可以使用它们来查看这种或那种货币的力量。 您所需要的只是将指标附加到您要交易的图表上,该指标将向您显示您交易的货币的真实强度。该指标还向您显示买卖量压力的极值,您可以在顺势交易时利用这些压力。该指标还显示了基于斐波那契的可能目标。该指标可用于各种交易时间范围。该指标支持各种货币对的交易。 该指标为您提供所有类型的警报,包括推送通知。 购买后请联系我。我将与您分享我的交易技巧,并免费为您提供丰厚的红利指标! 祝您交易愉快,获利丰厚!
Volatility Trend System - a trading system that gives signals for entries. The volatility system gives linear and point signals in the direction of the trend, as well as signals to exit it, without redrawing and delays. The trend indicator monitors the direction of the medium-term trend, shows the direction and its change. The signal indicator is based on changes in volatility and shows market entries. The indicator is equipped with several types of alerts. Can be applied to various trading ins
Buy Sell Arrow Swing MT4
Sahib Ul Ahsan
3 (2)
Looking for a powerful yet lightweight swing detector that accurately identifies market structure turning points? Want clear, reliable buy and sell signals that work across any timeframe and any instrument? Buy Sell Arrow MT Swing is built exactly for that — precision swing detection made simple and effective. This indicator identifies Higher Highs (HH) , Higher Lows (HL) , Lower Highs (LH) , and Lower Lows (LL) with remarkable clarity. It is designed to help traders easily visualize market stru
Trend indicator AI
Ramil Minniakhmetov
4.49 (84)
趋势人工智能指标是一个伟大的工具,将加强交易者的市场分析结合趋势识别与可操作的进入点和逆转警报。 该指标使用户能够自信和精确地驾驭外汇市场的复杂性 除了主要信号,趋势Ai指标识别在回调或回调期间出现的次要入口点,使交易者能够利用既定趋势内的价格修正。 重要优势: *MT4及MT5工程 *明确买入或卖出信号 ·不重绘 *适用于所有资产 小心我不卖EA或设置电报它骗局. 所有设置免费在这里的博客。  重要! 购买后立即与我联系,以获得指示和奖金! 真实的操作监控以及我的其他产品可以在这里找到: https://www.mql5.com/en/users/mechanic/seller&nbsp ; 设置和输入: 建议为所有资源设置默认设置。 第...
Auto Optimized Parabolic RSI: 高级 3D 动量引擎 大多数零售指标之所以失效,是因为它们依赖于静态输入,一旦市场波动率发生变化,这些输入就会崩溃。Auto Optimized Parabolic RSI 通过不断重新计算自身的数学优势,解决了“指标衰退”的问题,将机构级别的量化自适应能力直接引入您的 MT5 终端。 核心优势:定制的内存 3D 优化   标准的自动优化器通常会导致 MT5 平台卡顿,因为它们通过标准的指标调用使终端超载。该工具完全绕过了这些性能瓶颈。内部引擎采用定制的原生基于 RAM 的计算器构建,每次加载图表或更改时间周期时,它都会执行极速的 3D 网格搜索。它同时扫描 RSI 周期(频率)、SAR 步长(加速度)和 SAR 最大值(速度限制),在绝对的毫秒级时间内测试数以万计的参数组合,且完全不会拖慢您的平台。它不是仅仅寻找一个“不错”的设置,而是映射整个参数空间,以寻找资产当前动量结构的绝对全局最大值。 严格的财务评分与逼真的交易模拟   与基于抽象“指标点数”进行优化评分的业余工具不同,该引擎的 3.10 版本严格与资金数学挂钩。每
Matrix Arrow Indicator MT4
Juvenille Emperor Limited
5 (3)
矩阵箭头指标 MT4 是一种独特的 10 合 1 趋势,遵循 100% 非重绘多时间框架指标 ,可用于所有符号/工具:外汇、商品、加密货币、指数、股票。  Matrix Arrow Indicator MT4 将在其早期阶段确定当前趋势,从多达 10 个标准指标中收集信息和数据,它们是: 平均定向运动指数 (ADX) 商品渠道指数 (CCI) 经典 Heiken Ashi 蜡烛 移动平均线 移动平均收敛散度 (MACD) 相对活力指数 (RVI) 相对强弱指数 (RSI) 抛物线SAR 随机振荡器 威廉姆斯的百分比范围 当所有指标给出有效的买入或卖出信号时,相应的箭头将打印在图表上,在下一根蜡烛/柱线开盘时,指示强劲的上升趋势/下降趋势。用户可以选择使用哪些指标,并可以单独调整每个指标的参数。 Matrix Arrow Indicator MT4 仅从选定的指标中收集信息,并仅根据其数据打印箭头。 Matrix Arrow Indicator MT4 还可以为所有新信号发送终端、推送通知或电子邮件警报。无论您是黄牛、日内交易者还是波段交易者, Matrix Arrow Indicat
Scalper Vault
Oleg Rodin
5 (36)
Scalper Vault 是一个专业的剥头皮系统,为您提供成功剥头皮所需的一切。该指标是一个完整的交易系统,可供外汇和二元期权交易者使用。推荐的时间范围是 M5。 该系统为您提供趋势方向的准确箭头信号。它还为您提供顶部和底部信号以及江恩市场水平。无论您拥有何种交易经验,该系统都易于使用。您只需要遵循简单的规则并每天重复该过程。 建议将此系统用于主要货币对。感谢您的关注! 请注意,该指标在策略测试器中可能无法正常工作。因此,我建议仅在模拟或真实账户的真实交易条件下使用该系统。 指示器提供所有类型的警报,包括推送通知。 购买指标后请与我联系。我将免费与您分享我的个人交易建议和出色的奖励指标! 祝您交易愉快,盈利!
目前八折优惠! 对任何新手或专家交易者来说都是最好的解决方案! 这个仪表板软件适用于28种货币对。它基于我们的两个主要指标(高级货币强度28和高级货币冲动)。它对整个外汇市场提供了一个伟大的概述。它显示高级货币强度值,货币运动速度和28个外汇对在所有(9)时间段的信号。想象一下,当你可以使用图表上的单一指标观察整个市场,以确定趋势和或剥头皮的机会时,你的交易将得到改善 我们已经在这个指标中建立了一些功能,使你更容易识别强势和弱势货币,同时识别和确认潜在的交易。该指标以图形方式显示货币的强势或弱势是增加还是减少,以及它在所有时间段的表现。 增加的新功能是动态市场斐波那契水平,它适应当前的市场条件变化,这是一个已经在我们的高级货币强度28和高级货币冲动指标中使用的成熟的加分项。 在交易时,总是将弱势货币和强势货币配对,这个新指标将帮助你做到这一点。 用户手册:点击这里  https://www.mql5.com/en/blogs/post/708783 特点  显示每个时间段的ACS28和GAP-speed(冲动)的货币强度值。 列:颜色代码以7种颜色显示货币强度:强势
作者的更多信息
A new interpretation of the classical indicator in the form of an oscillator for a more accurate representation of the situation on the market. Less lagging than the standard Alligator. All settings are fully accessible, such as the type and prices for which it is built. Thanks to the additional parameters, it became possible to fine tune. Distinctive features Does not redraw. Additional parameters for fine tuning. Works on all timeframes and symbols. Suitable for manual trading and developmen
FREE
SFT Full OsMA
Artem Kuzmin
4 (1)
A classic indicator with advanced features for more accurate display of the market situation. All settings of all moving averages are available, such as the moving average type and the priced used in its calculation. It is also possible to change the appearance of the indicator - line or histogram. Additional parameters provide the ability of fine tuning. Distinctive features Does not redraw. Additional parameters for fine tuning. Displayed as a line or as a histogram. Works on all timeframes a
FREE
The support and resistance levels are among the main components of the entire technical analysis. They are used both by professional traders and by beginners. Prices usually move within the price channels. The upper boundary of such a channel is called resistance, and the lower one is support. This indicator plots fractal support and resistance lines at the highest and lowest local price values (fractals). Distinctive features Does not redraw. Clear and understandable signals. It is possible to
SFT Go Trend
Artem Kuzmin
Opening positions in the direction of the trend is one of the most common trading tactics. The main idea is that the probability of the trend continuation is higher than that of its change. This indicator determines the direction of a local movement, marking the beginning of a trend with a large dot and its continuation with a line of the corresponding color. Distinctive features No Repaint. Simple and accurate settings. Clear and understandable signals. Works on all timeframes and symbols. Sui
This highly informative indicator applies overbought/oversold levels for more accurate representation of the market situation. It is also possible to change the appearance of the indicator - line or histogram. Additional parameters enable more fine-tuning, while trading can be inside the channel and along a trend. Distinctive features Oversold/overbought levels; Does not redraw. Displayed as a line or a histogram; Works on all timeframes and symbols. Suitable for manual trading and development
MACD indicator with overbought and oversold zones. Two display options - classic lines and a histogram. Can be used to detect a possible reversal or pullback in price, as well as for channel strategies All settings are simple and straightforward - all like a standard indicator, but with additional support and resistance levels Can be used both separately and together with other indicators
Awesome oscillator with overbought and oversold zones. A series of OBS indicators (overbought and oversold) - these are indicators enhanced with overbought and oversold zones. This makes it possible to determine when the instrument is trending, as well as when it is flat. Works on all timeframes, all currency pairs, metals and cryptocurrencies. Can be used with binary options. Settings OBS Period - period of overbought and oversold calculation
Accelerator indicator with overbought and oversold zones. A series of OBS indicators (overbought and oversold) - these are indicators enhanced with overbought and oversold zones. This is the standard indicator, but it provides additional possibilities for the analysis of any market. Thanks to a special algorithm, this indicator has overbought zones =70 and =100, as well as oversold zones -70 and -100, which allows you to use it to determine the possible reversal or pullback of the price, as well
The Bears indicator with overbought and oversold zones. Two display options - as a line and as a histogram.  A series of OBS indicators (overbought and oversold) - these are indicators enhanced with overbought and oversold zones. This is the standard indicator, but it provides additional possibilities for the analysis of any market. Thanks to a special algorithm, this indicator has overbought zones =70 and =100, as well as oversold zones -70 and -100, which allows you to use it to determine the
Bulls indicator with overbought and oversold zones. Two display options - as a line and as a histogram. OBS (overbought and oversold) indicator series - are indicators that have been provided with overbought and oversold zones. This is the standard indicator, but it provides additional possibilities for the analysis of any market. Thanks to a special algorithm, this indicator has overbought zones =70 and =100, as well as oversold zones -70 and -100, which allows you to use it to determine the p
The Force Index indicator with overbought and oversold zones. Two display options - as a line and as a histogram.  A series of OBS indicators (overbought and oversold) - these are indicators enhanced with overbought and oversold zones. Settings OBS Period - overbought/oversold calculation period Force Period - period of Force Price MA - prices for MA calculation Method MA - MA calculation method Line or Histo - display by line or histogram
Multicurrency indicator Any chart obs is a price chart with a percentage scale. Can be displayed as a line and as a histogram. There is also a reverse function available, it mirrors the chart. The name of an instrument to be displayed is specified in the input parameters, the current symbol is used on default. The indicator doesn't have lags as it is not smoothed with any formulas, but bound to a percentage scale, what allows detecting the price equilibrium, the overbought and oversold state. Th
The Accumulation indicator with overbought and oversold zones. Two display options - as a line and as a histogram.  A series of OBS indicators (overbought and oversold) - these are indicators enhanced with overbought and oversold zones.  Simple and straightforward settings that are easy to match to the right tool In the indicator, you can adjust: Display depth of the indicator Color of indicator levels
指标提供良好的信号,趋势反转 或离开该单位时,价格变动的可能方向。 功能和设置: Sensitivity       = 3         - (下图中为例)的多个信号的灵敏度为1〜 5 ,较高的值; DeepBars        = 3000 - 深度计显示; ZeroBarCalc     = FALSE;  - 用于在零杆的计算,如果是这样的信号将被使用,但目前的蜡烛结束前可能会消失; UseAlert          = FALSE;   - 包容警告; AlertSound      = TRUE;   - 声音; AlertMessage = TRUE;         - 显示; AlertMail          = FALSE;   - 发送消息到邮局; FileSound          = “ alert2.wav ” ; - 文件磬;
The indicator is based on pair trading methods. It is not redrawn unlike similar indicators. Shows correlation between two selected instruments in percent for a predetermined period, and the positions of the instruments relative to each other. Has a function for reverse display of any of the analyzed symbols - for instruments with negative correlation. Can be drawn as a line or as a histogram. Settings: Symb1 - first symbol name. Revers1 - reverse display of the first symbol. Symb2 - second symb
Trend Factor
Artem Kuzmin
An indicator for entering with trend and timely exiting. It has sensitivity setting, by adjusting which it can be applied to both long-term and short-term speculation.  The highest sensitivity = 1, with this setup, you can even scalp on M1. No lag, does not withdraw after candlestick closure.  One of the use options: enter after a candlestick closes, if the vertical line consists of squares of the same color; exit if the color of two or more squares changes. Before using it, be sure to analyze t
The indicator builds fractals on extrema of the OsMA indicator Appears on the chart as a fractal or a fractal channel. It has a flexible setting and, in contrast to the standard fractals, lags only by 1 bar. Settings: DeepBars - the indicator's depth of display; Sensitivity_1_or_2 - 1 - for small periods of OsMA, 2 - for large periods; Arrow_or_channel - display on the chart fractals or channel; FastMA - period of the fast moving average;  SlowMA - period of slow moving average;  SignalSMA - per
Good Filtr
Artem Kuzmin
This is an indicator for additional signal filtering. It can be used as an additional filter in a trading system. The indicator does not redraw its data and can be used both in forex trading and with binary options. It has 3 operation modes and flexible sensitivity settings. The indicator uses multiple buffers, therefore it can be easily used in various Expert Advisors.
Flat Factor
Artem Kuzmin
5 (1)
The indicator is designed for visual determining market directions. It allows to determine the distance from a price and helps in drawing correct conclusions. Perfectly defines flat zones, horizontal intraday trends and trend movements, and an additional setting allows to use the indicator on any instrument. Does not redraw its readings. You get professional trading indicator for a reasonable price. Settings: Period_FF = 7 - indicator period Sensitivity_FF = 5 - sensitivity in % Wish you all su
Extremum bars
Artem Kuzmin
The indicator colors bars displaying prices of overbought and oversold areas on the chart. It will help you to estimate moments when market climate changes and the price has its local extreme values. It can be used both independently and as a good supplement to any channel trading system. And this indicator is easy-to-use in expert advisors due to usage of indicator buffers instead of graphical objects. Settings ExtPeriod = 100 — indicator period; Sensitivity = 80 — indicator sensitivity.
This is a moving average which can move not only to the right/left, but also up/down. You can also select a mode of displaying the indicator (as a line or as dots) and all other settings of a standard moving average. If you overlay several indicators in one window, you can clearlier determine price channels setting each border individually. Settings Line_or_Dot - mode of displaying the indicator: true - as a line, false - as dots; MA_period - moving average period; MA_shift_X - number of candle
Alarm arrow indicator of increased sensitivity After closing the candle the arrows do not disappear Allows you to enter the transaction on time at the lowest price movements Can be used on any currency pairs, metals and cryptocurrency Suitable for working with binary options Distinctive features Does not redraw; Determines the price correction; Advanced settings for fine tuning; Works on all timeframes and on all symbols; Suitable for trading currencies, metals, options and cryptocurrency (Bitco
SFT Full MACD
Artem Kuzmin
A classic indicator with advanced features for more accurate display of the market situation. All settings of all moving averages are available, such as the moving average type and the priced used in its calculation. It is also possible to change the appearance of the indicator - line or histogram. Additional parameters provide the ability of fine tuning. Distinctive features Does not redraw. Additional parameters for fine tuning. Displayed as a line or as a histogram. Works on all timeframes a
This highly informative indicator applies overbought/oversold levels for more accurate representation of the market situation. All moving average settings are available, including average type and price it is based on. It is also possible to change the appearance of the indicator - line or histogram. Additional parameters enable more fine-tuning, while trading can be inside the channel and along a trend. Distinctive features Oversold/overbought levels; Does not redraw. Additional parameters for
Arrow indicator, to determine adjustments and local trends The arrow appears on the current bar and after closing the bar will not disappear. Allows you to enter the transaction at the very beginning of the movement Thanks to the flexible settings you can use on any currency pairs, metals and cryptocurrency Can be used when working with binary options Distinctive features Does not redraw. Additional parameters for fine tuning. Works on all timeframes and symbols. Suitable for trading curren
Opening positions in the direction of the trend is one of the most common trading tactics. This indicator determines the direction of the local movement and colors the candles on the chart in the appropriate color. Allows you to enter the transaction at the very beginning of the movement Thanks to the flexible settings you can use on any currency pairs, metals and cryptocurrency Can be used when working with binary options Distinctive features Does not redraw. Additional parameters for fine
One of the main components of successful trading is the correct determination of the direction of the market. This indicator shows the general directionality of the price movement and is painted in the corresponding color. Allows you to conduct trend and counter trend trading It works on all timeframes, on any currency pairs, metals and cryptocurrency Can be used when working with binary options Distinctive features Does not redraw; Simple and clear settings; Works on all timeframes and symbols
Arrow indicator, for determining price reversals Arrow appears on the closed bar Allows you to enter the transaction at the very beginning of the turn Can be used on any currency pairs, metals and cryptocurrency Suitable for working with binary options Distinctive features Determines the price correction; Advanced settings for fine tuning; It works on all timeframes and on all symbols; Suitable for trading currencies, metals, options and cryptocurrency (Bitcoin, Litecoin, Ethereum, etc.) Suitab
筛选:
无评论
回复评论