Relative Momentum Index
- Indicadores
-
Libertas LLC
 Libertas LLC is a software company by enterprising math nerds. We make high quality and complex mathematical tools in a user-friendly and easy to use package for retail investors.
 - Versión: 1.2
- Actualizado: 1 diciembre 2021
- Activaciones: 20
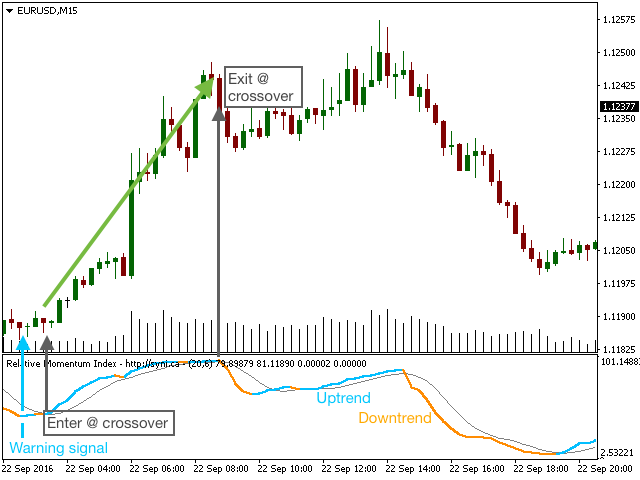
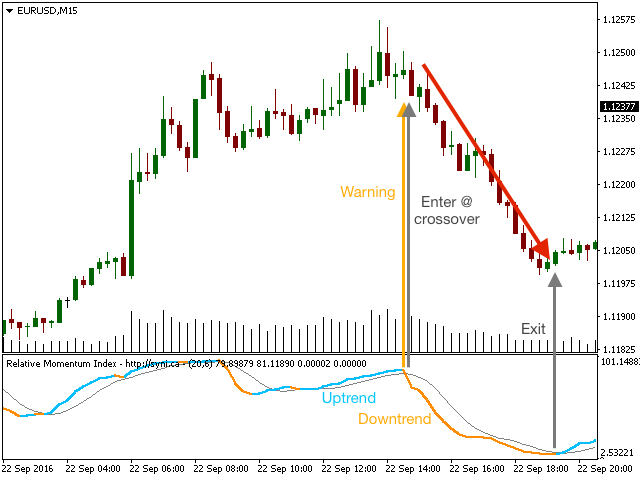
El Relative Momentum Index (RMI ) fue desarrollado por Roger Altman y presentado en su artículo de febrero de 1993 en la revista Technical Analysis of Stocks & Commodities. Como su nombre indica, el Relative Momentum Index añade un componente de impulso al RSI tradicional, diseñado para aumentar la fiabilidad disminuyendo las oscilaciones espurias entre los niveles definidos de sobrecompra y sobreventa.
Este indicador Relative Momentum Index tiene 2 componentes. Un cambio en el color de la línea del RMI proporciona una señal de advertencia de un movimiento alcista o bajista del precio. Esta tendencia se confirma cuando la línea RMI cruza la línea de señal de control. Vea las capturas de pantalla. En el uso en tiempo real, el indicador RMI proporciona un buen equilibrio entre la velocidad de entrada y la fiabilidad, y es uno de los favoritos de nuestro grupo.
Alertas: Hemos añadido alertas de mensaje y correo electrónico seleccionables por el usuario tanto para un cambio en el color de la línea del RMI (es decir, señales de advertencia) como para el cruce del RMI de la señal de control (es decir, confirmación de la tendencia). Tenga en cuenta que el destinatario del correo electrónico y la información smtp deben especificarse en MT4/options antes de utilizar las alertas por correo electrónico.
Parámetros
- Longitud RMI (Por defecto=20): # de barras utilizadas para calcular el RMI
- Longitud de la señal (Por defecto=6): # barras utilizadas para calcular la señal de control
- Longitud del impulso (por defecto = 4): # barras utilizadas para calcular el componente de impulso dentro de la señal RMI
- Activar/desactivar alertas: Activa (si es verdadero) o desactiva (si es falso) todas las alertas
- Alertas cuando el RMI cambia de color: Si es verdadero, alertará cuando el RMI cambie de color (es decir, señal de advertencia).
- Alertas cuando RMI cruza la señal ctrl: Si es verdadero, alertará cuando RMI cruce la señal de control (es decir, confirmación de tendencia)
- Activar mensaje de alerta: Si es true, activa las alertas de mensaje
- Activar sonido de alertas: Si es verdadero, activa el sonido de las alertas
- Activar alertas por correo electrónico: Si es true, activa las alertas por email
iCustom
Los desarrolladores pueden utilizar el siguiente código con iCustom:
iCustom(NULL,0,"Relative Momentum Index",20,6,4,false,false,false,false,false,false,0,0); // Valor actual de la señal de control

iCustom(NULL,0,"Relative Momentum Index",20,6,4,false,false,false,false,false,false,1,0); // Valor actual de la tendencia alcista del RMI

iCustom(NULL,0,"Relative Momentum Index",20,6,4,false,false,false,false,false,false,2,0); // Valor actual de la tendencia bajista del RMI

iCustom(NULL,0,"Relative Momentum Index",20,6,4,false,false,false,false,false,false,3,0); // RMI actual sin valor de tendencia


Good