EMA Separation
- Indicadores
-
Libertas LLC
 Libertas LLC is a software company by enterprising math nerds. We make high quality and complex mathematical tools in a user-friendly and easy to use package for retail investors.
 - Versión: 1.2
- Actualizado: 1 diciembre 2021
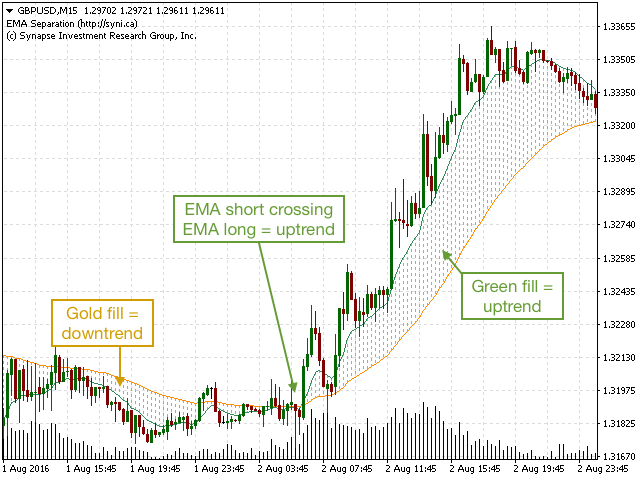
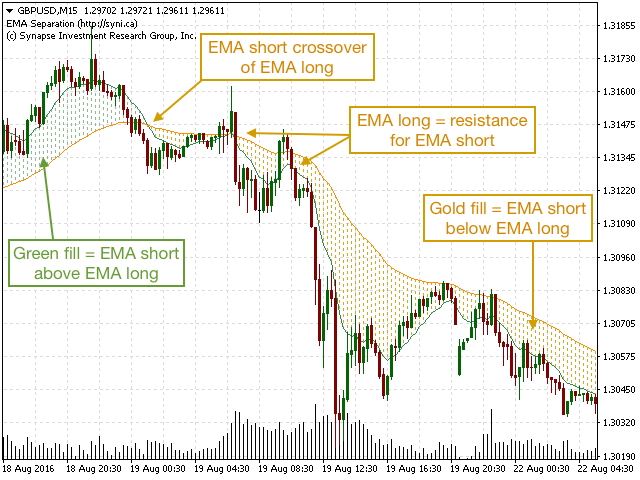
La Separación EMA traza 2 medias móviles exponenciales y un relleno entre ellas. El relleno se colorea de forma diferente según se trate de una tendencia alcista (EMA de periodo corto por encima de la EMA de periodo largo) o bajista (EMA de periodo corto por debajo de la EMA de periodo largo). Esta es una pequeña herramienta para ayudar a visualizar la diferencia entre las medias de corto y largo plazo. Esperamos que la disfrute.
La Separación EMA también se puede emparejar con nuestro Coeficiente de Separación EMA gratuito
Parámetros
- Periodo corto (Por defecto=10): # Barras utilizadas para calcular la EMA de periodo corto
- Periodo largo (Por defecto = 50): # de barras utilizadas para calcular la EMA de periodo largo


good