Choppiness Index
- Indicadores
-
Libertas LLC
 Libertas LLC is a software company by enterprising math nerds. We make high quality and complex mathematical tools in a user-friendly and easy to use package for retail investors.
 - Versión: 1.4
- Actualizado: 1 diciembre 2021
- Activaciones: 20
"Wouldn't we all love to reliably know when a stock is starting to trend, and when it is in flat territory? An indicator that would somehow tell you to ignore the head fakes and shakeouts, and focus only on the move that counts?"
El Choppiness Index es un indicador no direccional diseñado para determinar si el mercado está agitado (cotizando lateralmente) o no agitado (cotizando dentro de una tendencia en cualquier dirección). Es un indicador oscilante entre -50 (muy tendencial) y +50 (muy agitado).
Hay muchas estrategias para operar utilizando el indicador de entrecortado:
1. Comprar o vender la ruptura que rebota de valores extremos del Índice de Choppiness.
- Cuando el IC se mueve por debajo de +11,8 (entrecortado a tendencial) después de rebotar desde un valor alto del IC, esto puede indicar una tendencia próxima. Busque la confirmación de la dirección en el precio
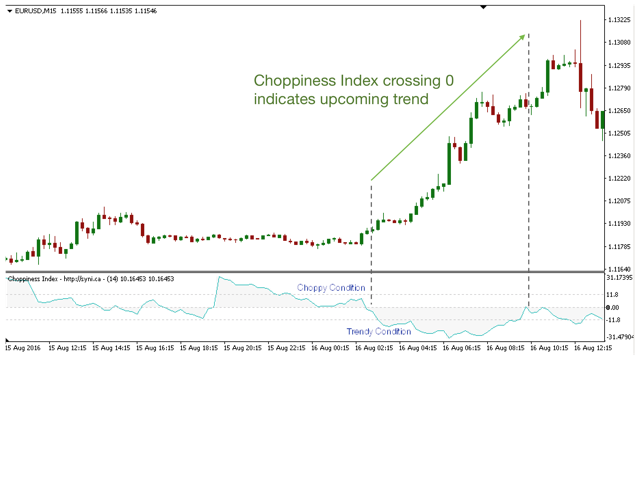
- Para una operación más conservadora, espere hasta que el IC pase de 0 (como se muestra en la captura de pantalla)
2. 2. Siga la tendencia con el Choppiness Index (cuándo salir y cuándo no)
- Si el precio está en tendencia pero el IC no ha superado el umbral de +11,8 más de tres veces, es probable que la operación continúe. Si el IC cruza +11,8 tres veces o más, entonces es probable que la tendencia se detenga
3. Afine el rendimiento de su estrategia de negociación confirmando las condiciones actuales del mercado ANTES de iniciar una operación. Muchas estrategias de negociación funcionan mejor en condiciones de mercado específicas. Elija cuantitativamente el grado deseado de inestabilidad/tendencia utilizando el IC.
Detalles adicionales
- Los umbrales se utilizan comúnmente con el Choppiness Index para determinar los movimientos entrecortados frente a los movimientos tendenciales. Los valores más comunes son los populares retrocesos de Fibonacci: +11,8 para el umbral alto (picado) y -11,8 para el umbral bajo (tendencia).
- El Choppiness Index combina bien con las líneas de tendencia y el reconocimiento de patrones tradicionales.
Alertas
Las alertas por correo electrónico, mensaje y sonido pueden activarse/desactivarse para los siguientes eventos. Tenga en cuenta que el destinatario del correo electrónico y la información SMTP deben especificarse en MetaTrader 4/opciones antes de utilizar las alertas por correo electrónico.
- Choppiness Index está cruzando 0
- Choppiness Index está por encima del umbral superior (choppy) seleccionable por el usuario (Por defecto=11.8)
- Choppiness Index está por debajo del umbral inferior (tendencia) seleccionable por el usuario (Por defecto=-11.8)
Parámetros
- Periodo CHOP (Por defecto=14): número de barras utilizadas para los cálculos del indicador
- Suavizado CHOP (Predeterminado=1): periodo de suavizado opcional aplicado al Índice de Choppiness. 1=sin suavizado, >1 = mayor suavizado (utilizando este valor como periodo de suavizado)
- Trazar círculos cuando CI > umbral superior: Verdadero = los cruces se resaltan con círculos
- Trazar círculos cuando CI < umbral inferior: Verdadero = los cruces se resaltan con círculos
- Trazar círculos cuando CI cruza cero: Verdadero = los cruces se resaltan con círculos
- Activar/desactivar todas las alertas: Verdadero = se permiten las alertas, falso = se detienen todas las alertas
- Alerta cuando elIC cruza 0: Si es verdadero, alerta cuando el valor del Índice de Choppiness cruza 0
- Alerta cuando el IC supera el umbral superior: Si es verdadero, alerta cuando el valor del índice de picado supera el umbral superior (picado) definido por el usuario.
- Umbral superior de alerta (Predeterminado=11,8): Umbral de alerta superior definido por el usuario
- Alerta cuando el IC está por debajo del umbral inferior: Si es verdadero, alerta cuando el valor del Índice de picado está por debajo del umbral inferior (de picado) definido por el usuario
- Umbral de alerta inferior (Predeterminado=-11,8): Umbral inferior de alerta definido por el usuario
- Activar mensaje de alerta: Mensaje de alerta
- Activar sonido de alerta: Alerta sonora
- Activar alertas por correo electrónico: Alerta por correo electrónico

Thanks