Ehlers Instantaneous Trend
- Indicadores
-
Libertas LLC
 Libertas LLC is a software company by enterprising math nerds. We make high quality and complex mathematical tools in a user-friendly and easy to use package for retail investors.
 - Versión: 1.0
- Activaciones: 20
Catch major price movements, early in the trend. Alerts you to enter at the likely beginning of a trend, and if it's incorrect, quickly alerts you to exit to limit any loss. Designed to capture large, profitable price movements, with early entrance to maximize your returns.
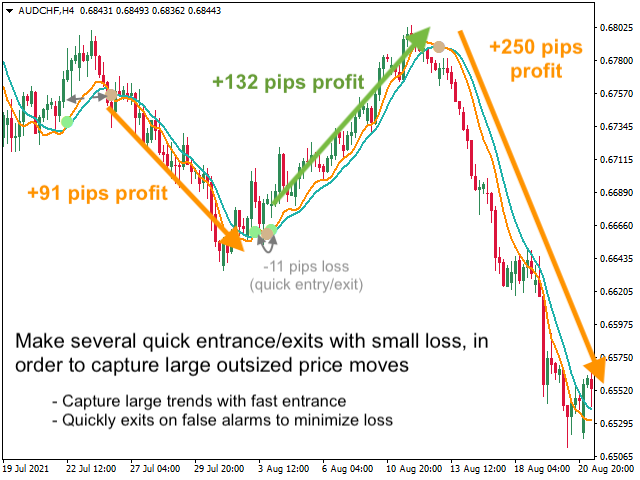
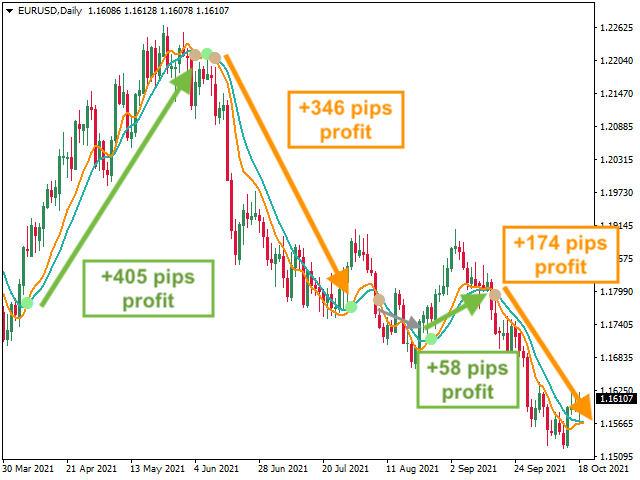
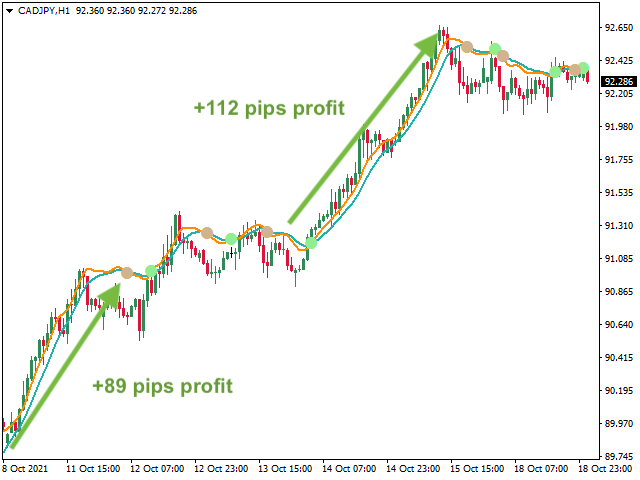
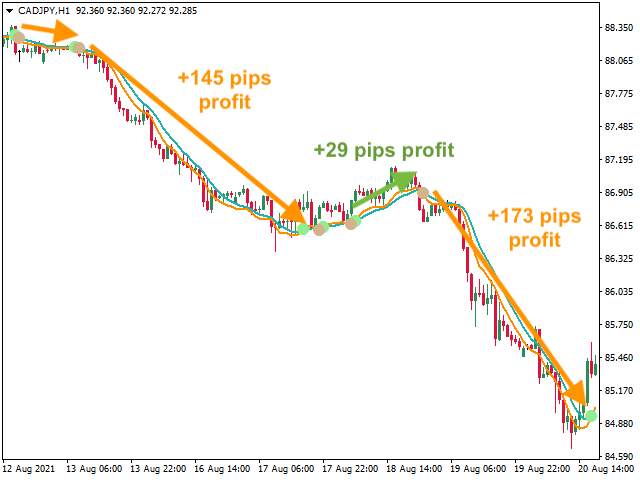
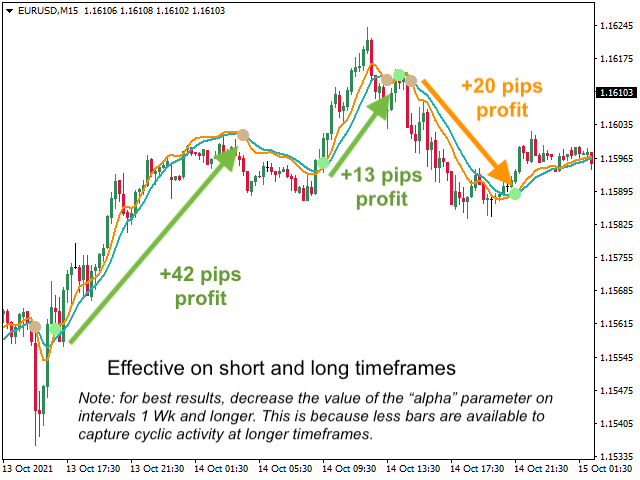
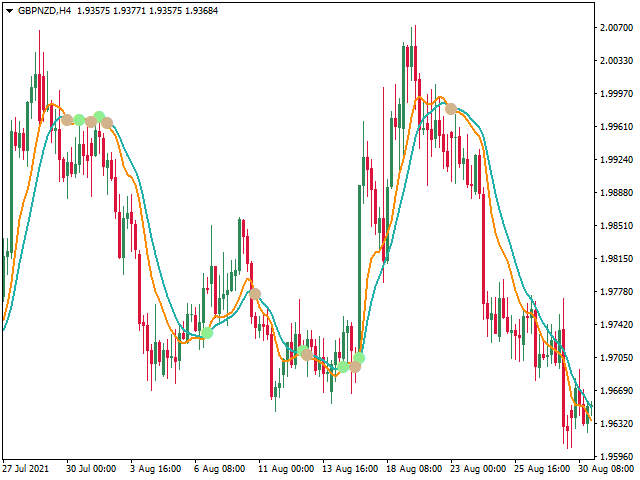
Como se muestra en las capturas de pantalla, el comportamiento típico es varias entradas/salidas rápidas con pequeñas pérdidas, y luego la captura de una gran tendencia con altos beneficios.
El indicador deTendencia Instantánea es un método de retardo reducido para detectar tendencias de precios. Fue descrito originalmente por John F. Ehlers [Ehlers JF (2002) The Instantaneous Trendline, Stocks & Commodities 20:2 (28-32)]. Matemáticamente, trata el mercado como si tuviera 2 actividades superpuestas: tendencias y ciclos. La tendencia y las actividades cíclicas se combinan para formar la acción general de los precios. Sin embargo, para un operador tendencial, la actividad cíclica puede ser "ruidosa" y peligrosa.
La ecuación de la Tendencia Instantáneaaísla y elimina la actividad cíclica (ciclo dominante del mercado) de la acción del precio. Al eliminar este ruido cíclico, pretendemostrar rápidamente las tendencias subyacentes de los precios.
Esto incluye algunas variantes de cálculo, y el uso de alertas ayudará al operador consciente de las tendencias asupervisar múltiples activos a lo largo del día
El comportamiento típico sonvarias entradas/salidas rápidas con pequeñas pérdidas, y luegola captura de una gran tendencia con grandes beneficios.
Alertas
Se pueden activar alertas por mensaje, sonido y correo electrónico cuando la tendencia se mueve al alza o a la baja. Se pueden dibujar círculos opcionales (activados/desactivados en Parámetros) que corresponden al inicio de la alerta.
Parámetros
- Alfa (0.07 por defecto): Constante de sensibilidad, valores más altos son más sensibles a tendencias de menor duración. Para obtener mejores resultados, disminuya el valor de alfa para intervalos muy largos (semanales o mensuales), ya que en estos intervalos largos hay menos barras disponibles para calcular la actividad cíclica, y alfa debe ajustarse para tendencias de mayor duración.
- Rellenar región de tendencia: Rellenar con color la región entre el indicador y las líneas de control
- Habilitar color de barras: Cambie el color de las barras a verde/rojo (o un color personalizado) según la tendencia instantánea sea alcista o bajista. Tenga en cuenta que también puede ajustar los colores de las líneas de las barras.
- Ocultar líneas: Oculta el indicador y las líneas de control (se utiliza si sólo desea mostrar puntos o relleno)
- Dibujar punto al cruzar: Dibuja un círculo en los puntos en los que la línea del indicador cruza el control, indicando una nueva dirección de tendencia.
- Activarmensaje de alerta: Si es verdadero, activa los mensajes de alerta (cuando la línea del indicador cruza el control).
- Activarsonido de alertas: Si es verdadero, activa el sonido de alertas(cuando la línea del indicador cruza el control)
- Activar alertaspor email: Si es true, activa las alertas por email(cuando la línea del indicador cruza el control)
- Alerta en la apertura de la vela: Si es verdadero, espera a la apertura de la siguiente vela para activar una alerta (no inmediatamente cuando se produce el cruce) para reducir los falsos disparos.
- Colores: Opciones para especificar colores personalizados para los diferentes componentes del indicador (línea del indicador, línea de control, puntos, etc)