Aggression Volume
- Indicadores
-
Flavio Javier Jarabeck
 We are a closed brotherhood of traders whose ultimate goal is to profit through well-studied, structured, and automated trades. As a result, we publish dozens of MT5 indicators (FREE and paid) to the global MQL5 community. 80% of our published products are high-quality free indicators so beginner
 - Versión: 1.1
- Actualizado: 6 junio 2020
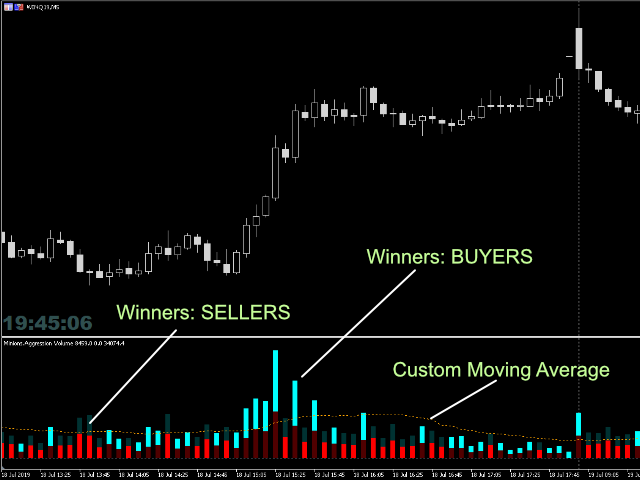
El Indicador de Volumen de Agresión es el tipo de indicador que rara vez se encuentra en la comunidad MQL5 porque no se basa en los datos de Volumen estándar proporcionados por la plataforma Metatrader 5. Requiere el escrutinio de todos los Ticks de tráfico solicitados en la plataforma...
Dicho esto, el indicador de Volumen de Agresión solicita todos los Datos de Tick de su Broker y los procesa para construir una versión muy especial de un Indicador de Volumen, donde las agresiones de Compradores y Vendedores se trazan en forma de Histograma.
Además, puede cruzar todos estos datos de Volumen contra un SMA de N-período (incluido en el indicador) y tener como un umbral para el Volumen actual, en comparación con su comportamiento pasado.
Espero que este indicador sirva bien a aquellos que operan con el Método Wyckoff, traders de Acción de Precios, o aquellos adictos a las herramientas de confirmación...
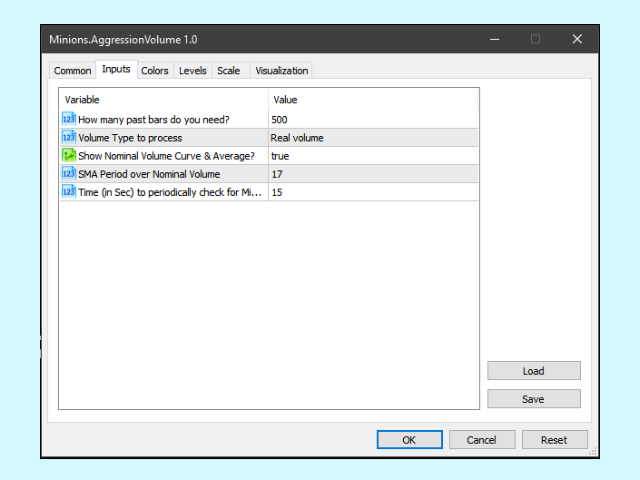
AJUSTES
- ¿Cuántas barras pasadas quieres procesar? De esta forma evitas sobrecargar tu Metatrader y te centras en tu objetivo principal.
- Tipo de Volumen a procesar: Volumen Real o Volumen en Ticks
- ¿Mostrar Media Móvil Simple en el indicador?
- Ajuste del periodo de la Media Móvil Simple
- Tiempo (en segundos) para comprobar periódicamente si faltan barras... Esto es necesario porque no todos los brokers trabajan sin problemas proporcionando ticks para Metatrader. Entonces, en este caso, El indicador reforzará la carga de cualquier barra faltante. Por favor, tenga en cuenta que este indicador podría comportarse "raro" (barras incompletas) cuando el mercado está cerrado.
Este indicador NO FUNCIONARÁ para Brokers y/o Mercados sin ÚLTIMO PRECIO en su feed, como por ejemplo, Pares de Divisas - que sólo tienen precios de OFERTA y COMPRA.
Si te gusta este indicador, todo lo que estoy pidiendo es un poco de revisión (no un comentario, pero una revisión!) ...
Esto significará MUCHO para mí... Y de esta manera puedo seguir regalando cosas interesantes de forma gratuita ...
¡Sin ataduras! ¡Nunca!
¡Larga vida y prosperidad!
;)


Great ..... Just some time take time to get data from server.....