Waves Follower
- Indicadores
-
Mihails Babuskins
 Senior developer for financial markets.
Contact me: Forex.terminology@outlook.com
🔵 Telegram group link: https://t.me/CommunityAndChat - Versión: 1.2
- Actualizado: 21 enero 2025
- Activaciones: 20
- Póngase en contacto conmigo después del pago para enviarle el archivo PDF del manual del usuario.
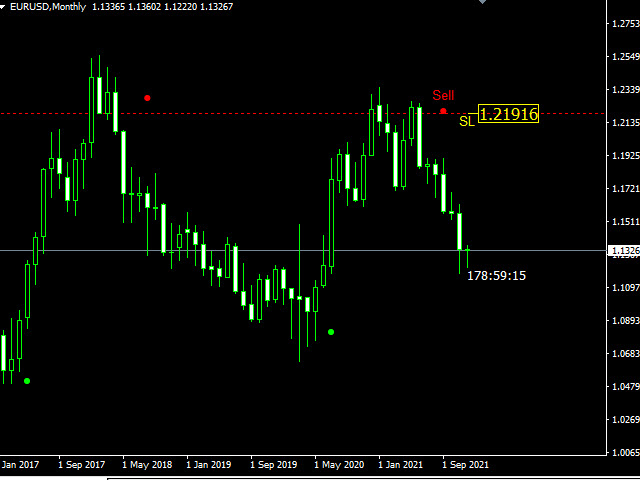
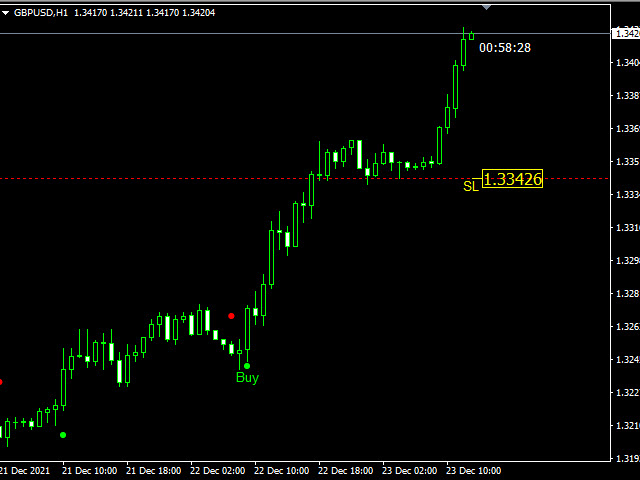
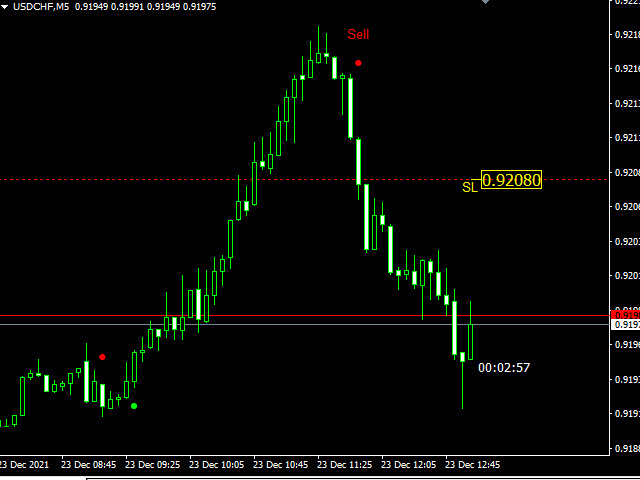
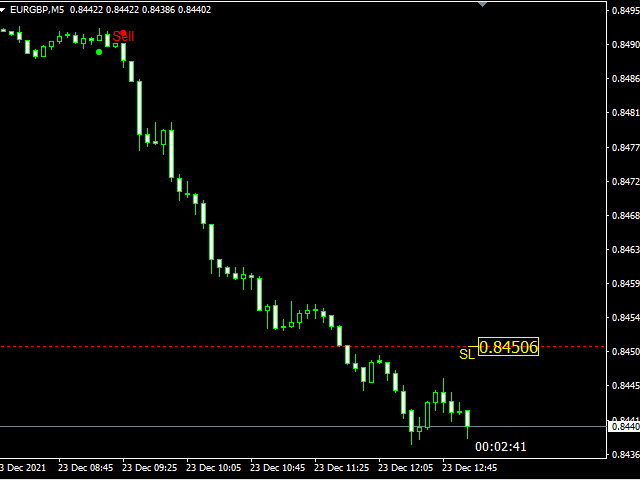
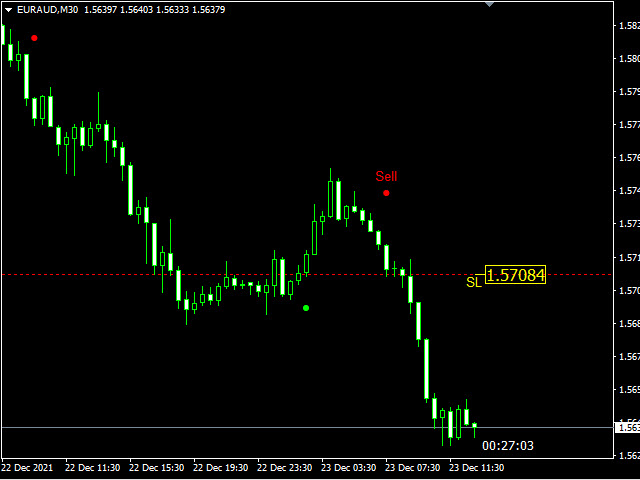
Este indicador da una señal cuando la probabilidad de inicio de una tendencia es alta.
Para calcular los puntos de entrada, utiliza una combinación de algunos indicadores como "Moving Average", "ADX", RSI con puntos de soporte y resistencia.
Este indicador es un seguidor de tendencia y no determina que TP porque no es necesario, utiliza el sistema de arrastre de stop-loss (Por supuesto, el indicador determina el SL, pero tiene que moverlo usted mismo porque no es un Expert-Advisor).
Es muy sencillo de utilizar.
Es mejor utilizarlo en M30 time-frame o superior (M30, H1, H4, D1 son recomendados).
Se puede combinar con otros indicadores o sistemas de trading para mejorar los resultados de las operaciones.
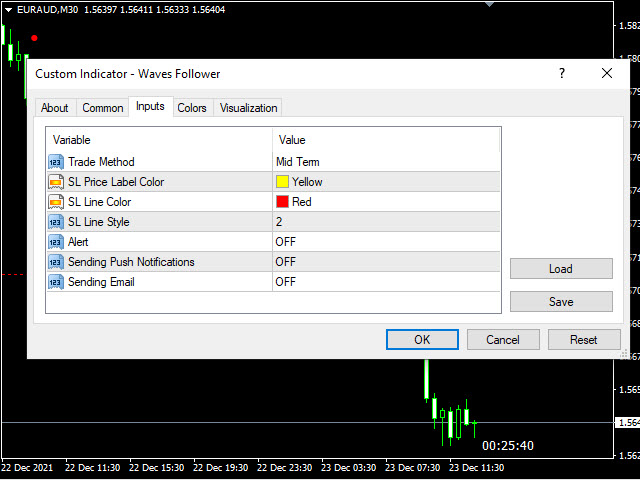
Parámetros del indicador:
- Método de negociación (corto, medio y largo plazo)
- SL Price Label Color (establecer el color de la etiqueta de stop-loss)
- Color de la línea SL
- Estilo de la línea SL
- Alerta (ON, OFF)
- Envío de Notificaciones Push (ON, OF)


El usuario no ha dejado ningún comentario para su valoración