Trend Filter MT4
- Indicadores
-
KEENBASE SOFTWARE SOLUTIONS
 Keenbase Trading desarrolla indicadores profesionales y Asesores Expertos (Expert Advisors) para MetaTrader 4 y MetaTrader 5, diseñados para ayudar a los traders a tomar decisiones de trading más informadas.
 - Versión: 1.0
- Activaciones: 5
"La tendencia es tu amiga" es uno de los dichos más antiguos y conocidos de los mercados financieros. Sin embargo, este mensaje sólo representa la mitad del cuadro. El dicho correcto debería ser: "La tendencia es tu amiga sólo hasta que termina".
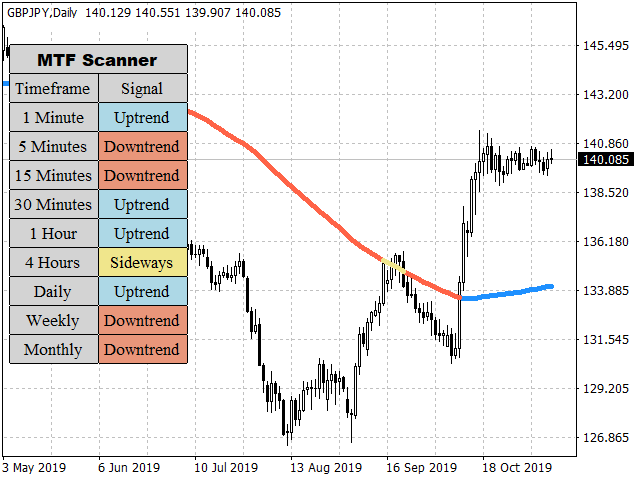
El filtro de tendencia KT resuelve este problema indicando claramente el inicio de una tendencia alcista y de una tendencia bajista mediante una ecuación de promediación de las series de precios. Si la dirección de la tendencia no está clara, muestra la tendencia como lateral mostrando la incertidumbre en el mercado.
Características
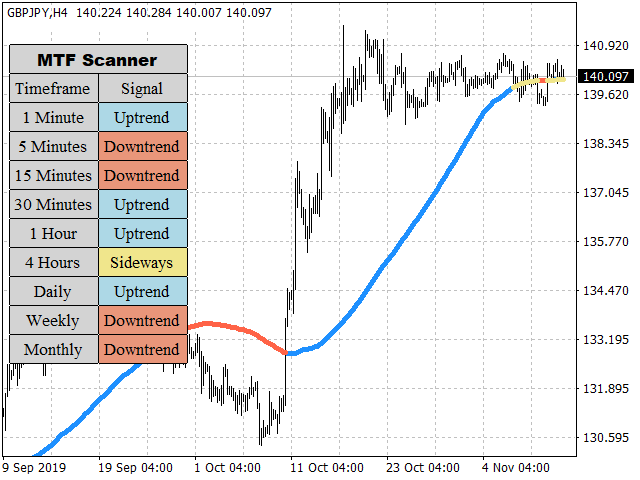
- Obtenga una visión más amplia con un mtf-dashboard incorporado, que muestra la dirección de la tendencia en cada marco temporal.
- Cuando se implementa, mejora drásticamente el rendimiento de las estrategias de negociación de tendencias.
- Muestra claramente la tendencia del mercado sin complicaciones.
- Evita las malas operaciones manteniéndose al margen mientras dure la incertidumbre.
- Se puede importar en un asesor experto con un simple código.
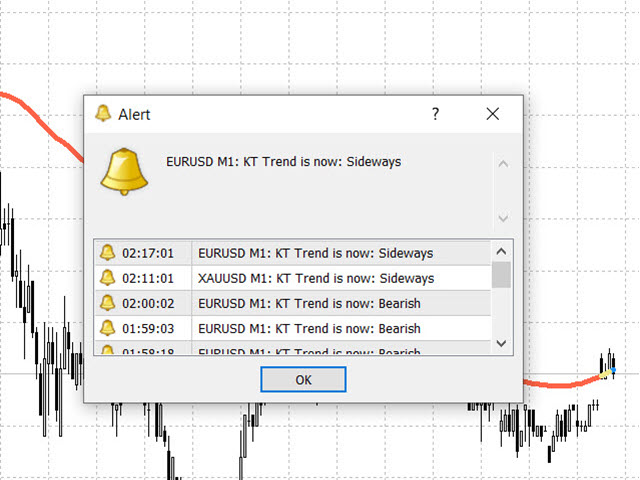
- Incluye todas las alertas de Metatrader.
Tendencia alcista
En una tendencia alcista, el movimiento general del precio de un activo es ascendente, con máximos y mínimos consecutivos más altos. Una estrategia de trading de tendencia normalmente sólo busca operaciones largas durante una tendencia alcista.
Tendencia bajista
En una tendencia bajista, el movimiento general del precio de un activo es descendente, con mínimos y máximos consecutivos más bajos. Una estrategia de negociación de tendencia normalmente sólo busca operaciones cortas durante una tendencia bajista.
Mercado lateral