Conheça o Mercado MQL5 no YouTube, assista aos vídeos tutoriais
Como comprar um robô de negociação ou indicador?
Execute seu EA na
hospedagem virtual
hospedagem virtual
Teste indicadores/robôs de negociação antes de comprá-los
Quer ganhar dinheiro no Mercado?
Como apresentar um produto para o consumidor final?
Indicadores Técnicos para MetaTrader 4 - 16

Bitcoin Predictor é um indicador baseado em seta projetado para prever reversões de preços. Esta ferramenta pode ser usada com BTC e outras criptomoedas. Também pode ser usado com moedas também. Mas você precisa verificar primeiro quais pares funcionam melhor. Alguns pares e prazos podem funcionar muito bem. Você é livre para testar e ver você mesmo. O indicador é muito fácil de usar. Tudo que você precisa é seguir as setas. O indicador pode funcionar como um sistema autônomo ou fazer parte de q

"Experience the full power on EURUSD!" Title: ChanLun Structure and SMC System Description: This indicator combines ChanLun Theory (Bi, Duan, Zhongshu) with Smart Money Concepts (SMC) to analyze market structure. It visualizes the market in three distinct layers—Pen, Segment, and Wave—and automatically identifies Premium, Discount, and Optimal Trade Entry (OTE) zones. The tool features an Interactive Hybrid Control System , allowing traders to manage the chart using keyboard hotkeys or mouse int
FREE

Introducing the Pivot Point Selector Indicator: Your Ultimate Tool for Custom Pivot Levels Are you ready to take your trading to the next level? Say hello to the Pivot Point Selector Indicator, a game-changing tool that puts you in control of your pivot levels. This innovative indicator empowers you to choose three specific points that will determine the pivot level calculations, giving you unparalleled customization and precision in your trading strategy. Key Features and Benefits: Custom Pivo
FREE

Indicator designed for both beginners and professionals. RECOMMEHDATION Trade with this indicator for 2-3 weeks and you will feel significant progress in your trading. This indicator is developed based on the use of HMA, Laguerre, CCI . The indicator is clear and does not require any setting. Does not redraw and works by opening bar. It works on timeframes M1-D1. I use timeframe M5 to enter the market.
FREE

This indicator is a multifunctional technical analysis tool based on the combination of an adaptive exponential moving average and volatility filters calculated through the Average True Range (ATR). It is designed to accurately identify the current price direction, highlight key trend reversal areas, and visualize potential turning zones. The algorithm is built upon the dynamic construction of a trend ribbon using two levels of volatility — outer and inner ranges. The outer boundaries serve as i

O indicador procura velas de impulso e apresenta-as no gráfico. Inclui um filtro de sombras. Também encontra níveis de rutura das Bandas de Bollinger. Pode ativar o painel de instrumentos de várias moedas nas definições. Os alertas podem ser seleccionados entre o gráfico atual ou a lista completa. Blog-Link - Retest and Fake Breakout with UPD1
Padrões de negociação: Teste de tendência. Falso Breakout. Outros.
EURUSD, GBPUSD, XAUUSD, ... M15, M30, H1.
Parâmetros de entrada.
Básicos. Bars Co

O Indicador SMC Sessions é uma ferramenta de precisão desenvolvida para traders de Smart Money que se baseiam em conceitos de TIC, busca por liquidez e estratégias baseadas em sessão . Ele mapeia perfeitamente as zonas críticas de negociação baseadas em sessão, utilizando os conceitos mais comprovados e populares utilizados por traders de nível institucional. Este indicador de sessão completo sobrepõe seu gráfico com as estratégias de intervalo mais eficazes e de alta probabilida

GAP DETECTOR
FVG in trading refers to "Fair Value Gap", . It is a concept used in technical analysis to identify areas on a price chart where there is a discrepancy or gap between supply and demand. These gaps can occur due to rapid movements in price, usually as a result of important news or economic events, and are usually filled later as the market stabilizes. The GAP DETECTOR indicator is designed to identify fair value gaps (FVG) on the price chart and filter them using volatility to dete
FREE

Apresentando o Parabolic Predictor Dashboard , um indicador de painel multisímbolo avançado, multiquadro e sem repintura baseado no popular Indicador Parabólico. Ele filtra os sinais parabólicos tradicionais para identificar a tendência exata e prever os níveis de entrada e saída do mercado.
Este indicador não é apenas um painel. Com um clique no símbolo, você pode ver a direção da tendência, níveis de entrada precisos e obter níveis de lucro em uma nova janela de gráfico. E com nosso sist

Indicador de múltiplas moedas e multiprazos Inside Bar (IB). Nos parâmetros, você pode especificar quaisquer moedas e prazos desejados. O painel exibe o último padrão da barra interna (e da barra mãe) encontrado, a posição atual do preço e o rompimento dos níveis das barras mãe e interna. Você pode definir o tamanho e a cor das barras e do texto nas células. O indicador também pode enviar notificações quando os níveis são quebrados. Ao clicar em uma célula com ponto final, o símbolo e ponto fin

Stop Guessing, Start Sniping: Introducing SR Sniper! Tired of entry points that seem random? The SR Sniper indicator is your new essential tool for finding high-probability trades with surgical precision. It's designed to cut through the market noise, giving you clear Buy and Sell signals right at the most critical price zones. This powerful indicator combines the dynamic analysis of the Commodity Channel Index (CCI) with automatic Support and Resistance (S/R) detection —and then filters everyt
FREE

VWAP and Moving Average A combination of Supertrend and Moving Average to create a converging trade setup Input parameters: signal mode: set it to true if you want to plug it into STAT (Signal Tester and Trader) arrow shift: distance between fast EMA line to arrow on chart turn on moving average signal for converging setup VWAP period MA period MA averaging method MA pricing method upper level limit ( VWAP ) lower level limit ( VWAP ) You can find the best setting for 4 hour EURUSD on this v
FREE

What is the ADX_DI Indicator? ADX_DI is an advanced technical analysis indicator developed for MetaTrader platform. It combines Average Directional Index and Directional Indicator components to analyze market trend strength and direction. What Does It Do? Measures Trend Strength : ADX line shows the strength of market trends Determines Direction : DI+ (green) and DI- (red) lines identify trend direction Detects Trend Changes : DI+ and DI- crossovers provide trend reversal signals Automatic Alert
FREE
O indicador Multi-Timeframe ATR é uma versão avançada do indicador padrão ATR para MetaTrader 4 que permite aos traders visualizar a volatilidade de qualquer período de tempo diretamente no gráfico em que estão trabalhando. Ao contrário do ATR padrão — que só mostra os dados do período ativo do gráfico — esta versão permite escolher outro período, por exemplo exibir o ATR diário enquanto opera em um gráfico M15 ou H1. Como funciona:
O indicador obtém os valores de ATR a partir do períod
FREE
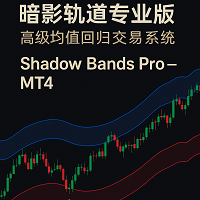
Shadow Bands Pro – MT4 说明(中英文) English Description (MT4) Shadow Bands Pro – Advanced Reversion System for MT4 Shadow Bands Pro is a non-repainting (on candle close) trend-reversal and mean-reversion indicator designed for traders who need clear, rule-based entries and exits.
By combining a dynamic volatility band, entity-break logic, and a built-in statistics panel, it helps you quickly see where price is stretched and where high-probability reversals may occur. Key Features Non-repainting on
FREE

Fibonacci Retracement object is an object that has been provided by metatrader 4 platform. But Fibonacci Retracement object doesn't automated adjust the chart. You have to put and manage it manually to the chart. Because of that, this indicator was created. If you like using filbonacci retracement indicator, highly recommended to use Automated Fibonacci Retracement Indicator if you want to get better result in here:
https://www.mql5.com/en/market/product/95515
LT Automated Fibonacci Retraceme
FREE

This indicator is not only for trading but also for learning, thanks to it, you can learn to identify trend, support and resistance.
You've probably heard about the Dow trend theory, where higher highs and higher lows indicate an uptrend, and lower highs and lower lows indicate a downtrend. This indicator determines this trend based on the Dow Theory. You just need to enter a number representing the number of candles between extremes. The optimal solution is the number 3 (H1 TF), unless you wa
FREE

Full Stochastic - is Stochastic Oscillator which displays all three essential lines: %K Slow K %D Standard Stochastic Oscillators displays only Slow K and %D.
Why it is important to analyze all three lines in SO? Standard SO users must choose if they want to use fast or slow SO. In case of fast SO traders set the slowing parameter typically to 1 or 2, or if they want to use slow SO, they set the slowing parameter usually to 3 or more. With Full Stochastic you can have both!
Full Stochastic Par
FREE
Other profitable programs https://www.mql5.com/en/users/ifyjava/seller The FNCD indicator represents an advanced technical analysis tool that combines Fisher transformation with statistical price normalization to create a sophisticated oscillator. The foundation begins with Z-score normalization, where price data is standardized by calculating how many standard deviations the current price sits from its moving average over a specified period. This normalization process transforms raw price mov
FREE

The Keltner Channel is a volatility-based technical indicator composed of three separate lines. The middle line is an exponential moving average (EMA) of the price. Additional lines are placed above and below the EMA. The upper band is typically set two times the Average True Range (ATR) above the EMA, and the lower band is typically set two times the ATR below the EMA. The bands expand and contract as volatility (measured by ATR) expands and contracts. Since most price action will be encompasse
FREE

Powerful non-repainting tool for intraday or swing tading, part of the Power Lines Trading System, used in real trading on a daily basis with proven solid trading signals. The Power Lines indicator is pretty straightforward and easy to set up and can be used perfectly on every timeframe and with every currency pair or other financial instrument. For intraday trading the using of M5, M15 or M30 timeframes and for swing trading H1, H4 or D are recommended. Avoid M1 and be careful with M5 timeframe
FREE

Fibomathe Indicator: Support and Resistance Tool for MT4 The Fibomathe Indicator is a technical analysis tool designed for MetaTrader 4 (MT4) that assists traders in identifying support and resistance levels, take-profit zones, and additional price projection areas. It is suitable for traders who use structured approaches to analyze price action and manage trades. Key Features Support and Resistance Levels:
Allows users to define and adjust support and resistance levels directly on the chart. L
FREE

The three white soldiers and the three black crows candlestick patterns are reversal patterns that predict a change in the direction of a trend. The pattern consists of three consecutive long-bodied candlesticks that open within the previous candle's real body and a close that exceeds the previous candle's. It's important to note that both formations are only valid when they appear after a strong uptrend or a downtrend, while their efficiency decreases in choppy markets.
Inputs AlertOn - en
FREE
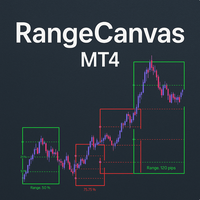
Daily Range Boxes : The indicator draws rectangular boxes around each day's high and low prices, creating a clear visual boundary for the daily trading range. Color-Coded Logic : Green boxes when the current price (or close) is above the daily open Red boxes when the current price is below the daily open Percentage Level Lines : Inside each box, it draws three horizontal lines at: 25% of the daily range 50% of the daily range (midpoint) 75% of the daily range Range Information : Each box displa
FREE

This indicator displays pivot points in the chart, including historical vales, and supports many calculation modes for Pivot Points and S/R levels. [ Installation Guide | Update Guide | Troubleshooting | FAQ | All Products ] It plots historical levels for backtesting purposes
It allows you to select the reference timeframe It implements different Pivot Point calculation modes It implements different SR calculation modes
It implements customizable colors and sizes
Calculation Modes The indicator
FREE

DBD AND RBR CANDLESTICK PATTERN: This indicator based on the concept of two candlestick patterns. DROP BASE DROP (DBD) is a buy candlestick pattern and RALLY BASE RALLY (RBR) is a sell candlestick signal pattern. The arrows indicate potential signal setup for long trade and short trade. This indicator includes pop-up alert, push to phone and send to email alert which can be enabled and disabled. The color and size for DBD and RBR can be changed.

This indicator analyzes the ranges in the selected LookBack Bars and shows the relative strength of the price movement with the Level percentage you set. The blue line indicates that the current price movement is strong, and the yellow line indicates that we are in a flat price movement. The blue line does not determine whether the price action is up or down, it just shows relative strength. Therefore, as seen in the picture, direction can be determined with a simple zigzag indicator on the main

Use with disciplined risk management. Fibonacci entry system based on the golden zone 38.2 - 61.8 where the entry is confirmed at 23.6 with indications of Take Profit 3:1. Automatically plotted Fibonacci contains retracement and expansion Fibonacci in a single indicator. Up to 77% win rate with this system. FTMO challenge pass with 0.50% risk and 1.50% R:R.
Dear Traders, check out my new multi level market liquidity indicator : https://www.mql5.com/en/market/product/73098
Many of you have been trading very good with this indicator, thanks for the support and positive feedbacks ! For more information about market liquidity, a manual on how to use this indicator please send me a message. A lot of information can be found on the net. (search liquidity trading/ inner circle trader)
https://www.youtube.com/watch?v=yUpDZCbNBRI
https://www.youtube.com/

Introducing a powerful, precision-engineered indicator that seamlessly combines Pivot Points, Moving Averages, and Multi-Timeframe Analysis to deliver high-probability Buy and Sell signals in real-time. This tool is your strategic edge, designed to identify trend reversals, market momentum, and optimal trade entries, no matter your preferred trading style.
Our algorithm goes beyond standard indicators—by analyzing multiple timeframes simultaneously, it spots true market turning points while fi
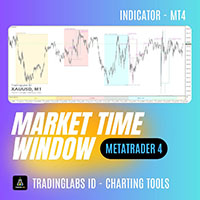
ICT Market Time Cycle – Complete Session & Time Window ICT Market Time Cycle is a professional trading indicator designed to help traders follow the ICT (Inner Circle Trader) methodology with ease.
It automatically displays the main market sessions (Asia, London, and New York), along with Killzones, Silver Bullet windows, and Macro times directly on your chart. With this tool, you no longer need to calculate session times manually – everything is plotted automatically in a clean and professional

The product Divergence Mom Stoch Adx Bears Bulls is designed to find the differences between indicators and price. It allows you to open orders or set trends using these differences. The indicator has 4 different divergence features.
Divergence types Class A Divergence Class B Divergence Class C Divergence Hidden Divergence
Product Features and Rec ommendations There are 5 indicators on the indicator Indicators = Momentum Stochastic Adx Bears Bulls 4 different divergence types are used.
FREE

The purpose of this new version of the MT4 standard indicator provided in your platform is to display in a sub-window multiple timeframes of the same indicator. See the example shown in the picture below. But the display isn’t like a simple MTF indicator. This is the real display of the indicator on its timeframe. Here's the options available in the FFx indicator: Select the timeframes to be displayed (M1 to Monthly) Define the width (number of bars) for each timeframe box Alert pop up/sound/ema
FREE
Smart Liquidity Zones (SLZ) — Your All‑in‑One SMC/ICT Radar for MT4
Why SLZ? Tired of squinting at charts trying to spot liquidity grabs, break‑of‑structure candles and Fair Value Gaps before the smart‑money sharks do? SLZ turns your chart into a tactical map —drawing every high‑probability zone and screaming (politely) when price dives in. Core Edge Powered by a rule‑set distilled from Smart Money Concepts (SMC) and ICT mentorship material, SLZ auto‑marks: Component What it shows Why it
FREE

Indicador Heikin Ashi multimoeda e multitimeframe. Mostra o estado atual do mercado. No painel do scanner você pode ver a direção, força e número de barras da tendência atual. As velas de Consolidação/Reversão também são mostradas em cores. Você pode especificar quaisquer moedas e períodos desejados nos parâmetros. Além disso, o indicador pode enviar notificações quando a tendência muda ou quando velas de reversão e consolidação (dojis) aparecem. Ao clicar em uma célula, este símbolo e ponto fi
This is a custom indicator based on the Exponential Moving Average (EMA) angle, typically used to measure the trend angle of EMA lines. Here are the main parameters and functions of this indicator: Main Parameters: md1: Fast period for EMA, default value is 12. md2: Slow period for EMA, default value is 26. md3: Period for the MACD signal line, default value is 9. Functions: The indicator calculates the MACD indicator and categorizes data into different buffers based on the direction and angle o
FREE

The Smart Liquidity Profile is color-coded based on the importance of the traded activity at specific price levels, allowing traders to identify significant price levels such as support and resistance levels, supply and demand zones, liquidity gaps, consolidation zones, Buy-Side/Sell-Side Liquidity and so on. Smart Liquidity Profile allows users to choose from a number of different time periods including 'Auto,' 'Fixed Range,' 'Swing High,' 'Swing Low,' 'Session,' 'Day,' 'Week,' 'Month,' 'Quar

Dark Oscillator is an Indicator for intraday trading. This Indicator is based on Counter Trend strategy, trying to intercept changes in direction, in advance compared trend following indicators. We can enter in good price with this Indicator, in order to follow the inversion of the trend on the current instrument. It is advised to use low spread ECN brokers. This Indicator does Not repaint and N ot lag . Recommended timeframes are M5, M15 and H1. Recommended working pairs: All. I nst
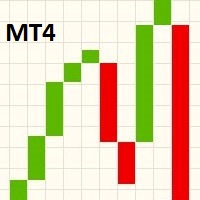
Este indicador mostra um gráfico de Ruptura de Linha no gráfico principal. Para visualizar o gráfico de Ruptura de Linha, você deve alterar o gráfico principal para exibição em linha, em seguida, mudar nas Propriedade (F8), a configuração da cor do "gráfico de linhas" para "None". Em relação a rolagem, zoom +/- ou alterar o par/período do gráfico, o indicador irá redimensionar os blocos na próxima escala para atender a área principal de visualização do gráfico. Gráficos de Ruptura de Linhas foi
FREE

False Breakout Stochastic to be used with our Elliott Wave Indicator as part of the overall strategy on trading the 5th wave.
As we cannot upload multiple files, we have listed this separately. False Breakout Stochastic is best used as a confirmation tool rather than the sole signal indicator The Elliott Wave Indicator Suite is designed around a simple but effective Swing Trading Strategy. The Indicator Suite is great for Stocks, Futures and Forex trading on multiple timeframes You can find the
FREE

1. Os pivôs mensais, semanais e diários são calculados com os dados iniciais e finais de cada período.
2. Isso fornece uma linha fácil no gráfico para identificar onde estão os pivôs e reduzir o erro de cálculo.
3. O indicador ajudará a definir rapidamente os principais pivots do instrumento, mesmo que você não entenda como calcular o pivô.
4. Você também pode comparar pivôs semanais e diários para entender melhor a posição do preço.
5 Este indicador irá ajudá-lo a negociar mais eficientemen
FREE

This indicator uses a different approach from the previous version to get it's trendlines. This method is derived from Orchard Forex, and the process of making the indicator is demonstrated in there video https://www.youtube.com/watch?v=mEaiurw56wY&t=1425s .
The basic idea behind this indicator is it draws a tangent line on the highest levels and lowest levels of the bars used for calculation, while ensuring that the lines don't intersect with the bars in review (alittle confusing? I know
FREE

The SuperTrend AI indicator is a novel take on bridging the gap between the K-means clustering machine learning method & technical indicators. In this case, we apply K-Means clustering to the famous SuperTrend indicator. USAGE Users can interpret the SuperTrend AI trailing stop similarly to the regular SuperTrend indicator. Using higher minimum/maximum factors will return longer-term signals. (image 1) The displayed performance metrics displayed on each signal allow for a deeper interpretat

** All Symbols x All Time frames scan just by pressing scanner button ** *** Contact me to send you instruction and add you in "Harmonic Scanner group" for sharing or seeing experiences with other users. Introduction Harmonic Patterns are best used to predict turning point. Harmonic Patterns give you high win rate and high opportunities for trade in during one day. This indicator detects the best and successful patterns base on Harmonic Trading books . The Harmonic Patterns Scanner Scans All ch

[NEW RELEASE] Horse All in Signal – WinWiFi Robot Series ต้อนรับปีใหม่ 2026 ด้วยความมั่งคั่งและพลังที่คึกคักเหมือนม้าศึก! สัมผัสประสบการณ์การเทรดเหนือระดับกับอินดิเคเตอร์ตัวล่าสุดจาก WinWiFi Robot Series ในชื่อ "Horse All in Signal" เครื่องมือที่จะเปลี่ยนกราฟของคุณให้กลายเป็นสนามทำกำไร ด้วยระบบ AI อัจฉริยะที่สแกน Price Action ในทุกช่วงเวลา คุณสมบัติเด่น (Key Features): AI Price Action Engine: วิเคราะห์พฤติกรรมราคาแบบ Real-time แม่นยำทั้งในช่วงตลาดมีเทรนด์ (Trend) และช่วงพักตัว (Sideway)
FREE

Special offer : ALL TOOLS , just $35 each! New tools will be $30 for the first week or the first 3 purchases ! Trading Tools Channel on MQL5 : Join my MQL5 channel to update the latest news from me SMC é uma abordagem de trading que ajuda os traders a identificar zonas de liquidez, posições institucionais e pontos de reversão importantes no mercado. Ao aproveitar os princípios do SMC, os traders podem navegar pelo mercado de forma mais eficaz, encontrando entradas e saídas ideais.
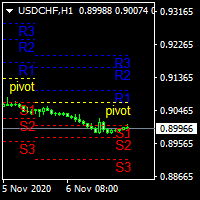
.................................if you need pivot point s levels............................... ............................this is a daily pivot point level creator........................... ...it is for daily pivots and show levels at times period H4 , H1 , M30 , M15 ,M 5... .................................also shows levels for 3 last days.............................. ................can use it with other indicators and see important levels...............
FREE
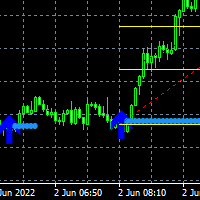
Here is the Double Arrow ArrZZx2 indicator that works best on 5 minutes time frame with Alerts. Good for pairs like NAS100, US30, GER30 and XAUUSD Your buy entry or Sell entry is on the second arrow of the Arr zzz You can confirm your second arrow with Fibonacci retracement levels the 50% level and the 61.8% which is the golden zone The double is good on strong trending markets look for the breakout on the second arrow Look at the screenshots for examples.

EMA Cloud System is a Trading System Invented by Ripster where areas are shaded between two desired EMAs. The concept that the EMA cloud area serves as support or resistance for Intraday & Swing Trading. Can be utilized effectively on 10 Min for day trading and 1Hr/Daily for Swings. Ripster utilizes various combinations of 5-12 EMA clouds 34-50 EMA clouds among others. 8-9, 20-21 EMA clouds can be used as well. Adjust what works for you. Ideally 5-12 or 5-13 EMA cloud acts as sold fluid Trendlin
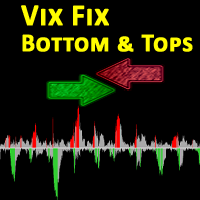
The VIX Fix is a volatility indicator developed by renowned trader Larry Williams. It's designed to measure volatility in assets that don't have options or futures, such as individual stocks and forex markets. Essentially, it acts as a synthetic VIX (Volatility Index) for any asset , providing a gauge of market uncertainty. This modified version of William's indicator helps you to find market bottoms and market tops. It comes with 2 styles: Stochastic and histogram style. Please see screenshot
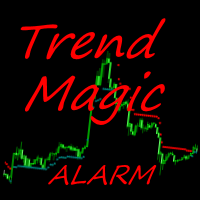
The Trend Magic Alarm shows the direction of a trend and indicates when it changes with a sound, popup window, push or email notice. Blue dots in the chart indicate an uptrend, red dots indicate a downtrend. Levels of former highs + lows give orientation in a chart. Trend Magic Alarm can draw these levels as lines in the chart, see inputs.
Input Parameters Counter : number of bars used for calculation PowerSet : shows how near to the bars the trigger dots are placed DotSize : size of the shown

O indicador exibe níveis técnicos importantes no gráfico. Esses níveis atuam como suporte ou resistência para o movimento dos preços.
Os níveis mais importantes são múltiplos de 100 e 50 pontos. Você também pode exibir níveis em múltiplos de 25 pontos.
Quando o preço atinge o nível, um alerta ou notificação por push é exibido.
Versão para MT5 https://www.mql5.com/pt/market/product/69740 Configurações Show Levels 100 pips - mostra os níveis em múltiplos de 100 pips Show Levels 50 pips - mostr
FREE

"The Squeeze indicator attempts to identify periods of consolidation in a market. In general the market is either in a period of quiet consolidation or vertical price discovery. By identifying these calm periods, we have a better opportunity of getting into trades with the potential for larger moves. Once a market enters into a "squeeze," we watch the overall market momentum to help forecast the market direction and await a release of market energy." The StdATR Squeeze Channel combines standard

Forex Meter Oscillator is an indicator that can give a whole view of forex market from a single chart, measuring currency strenghts among 28 forex pairs (majors and minors). The "oscillator" word is very meaningful: it normalizes currency strenghts in order to provide values in a predefined range (from -1 to 1).
What are normalization's advantages? It's so simple, values will always be in a pre-defined range that reflect exactly the current value compared to the last N values. In this way you w
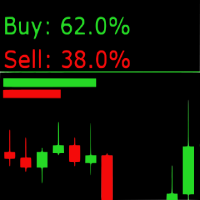
Sentiment Market Indicator: Real-Time Market Sentiment Display The Sentiment Market Indicator is a real-time MQL4 tool that displays current buy/sell sentiment directly on your MetaTrader 4 chart. Designed to support your technical analysis, it provides a visual representation of market positioning to help inform your decision-making process. Key Features Live Sentiment Display
View real-time percentage breakdowns of buy vs. sell sentiment. Customizable Alerts
Set specific thresholds for buy o

It is the main indicator of Turtle Trading Strategy. It provides an excellent advantage for following the trend. It gives a signal to enter the transaction in channel breaks. A sell position is opened when the 20-period lower channel breaks, and a buy position is opened when the upper channel breaks. 2 ATR should be used as the stoploss level. The R-R ratio should be at least 1/2. You can reach the maximum profit opportunity by following the 10-period middle level. Recommended INPUT: 20 Period
FREE

With this easy to set up indicator you can display and set alerts for the following candlestick formations: Bull Breakout, Bear Breakout, Hammer, Pin, Bullish Engulfing, Bearish Engulfing. I'd appreciate if you would review the indicator
Input parameters: ShortArrowColor: The color of the Arrows, displaying a Bearish candle formation LongArrowColor: The color of the Arrows displaying a Bullish candle formation BullishEngulfing: Disabled/Enabled/EnabledwithAlert BearishEngulfing: Disabled/Enab
FREE

Título do produto Smart Heiken Ashi (MT4) – parte da série SmartView Descrição breve Indicador Heiken Ashi com experiência de usuário única na plataforma MetaTrader. Oferece capacidades avançadas não disponíveis anteriormente, como abrir configurações com duplo clique, ocultar e mostrar indicadores sem excluí-los, e exibir a janela do indicador em tamanho completo do gráfico. Projetado para funcionar perfeitamente com o restante da série SmartView Indicators. Visão geral A série SmartView oferec
FREE
Level Box Tool is a powerful and user-friendly custom indicator designed for traders who utilize technical analysis tools like rectangles and trend lines to identify key support, resistance, and price zones. This tool simplifies and speeds up the process of marking chart levels, offering both visual clarity and precision with its fully customizable panel, and now includes price-cross alerts — so you’ll never miss a key level again. MT5 Version - https://www.mql5.com/en/market/
FREE

Please check the " What's new " tab regularly for a complete and up-to-date list of all improvements + parameters. FREE indicator for my trading utility Take a Break . This indicator allows you to manage multiple other EAs with just one Take a Break EA instance. Simply specify the corresponding Chart Group in the indicator(s) and Take a Break EA settings and you are good to go.
Setup examples (Indicator + EA)
As a prerequisite, add the URL https://trading.custom-solutions.it to the list of al
FREE

How would you like to instantly know what the current trend is? How about the quality of that trend? Finding the trend on a chart can be subjective. The Fractal Trend Finder indicator examines the chart for you and reveals what the current trend is based on objective criteria. Using the Fractal Trend Finder you can easily tell if you are trading with the trend or against it. It also identifies those times when the market is not trending. Theoretically, you could trade with the trend when the tre
FREE

This is MT4 version of StochScanner It scans Stochastic from Multi Symbols and Multi Timeframes and displayed on the dashboard on a single chart. . 4 scanning modes: 1. Mode OverBought/OverSold Indicator scans Overbought and OverSold . OverBought : current stochastic is above level 80 and OverSold : current stochastic is below level 20 2. Mode Signal It means if the previous stochastic is on OverBought or OverSold ( either Main Line and Signal Line ) and the current Main Line cross over the curr
MTF Fair Value Gaps Alerts indicator is based on Fair Value Gaps (FVG), Volume imbalance (VI) and Gaps. This indicator will create 2 arrows pointing to the left showing the area of the FVG, VI and Gaps and will never repaint after the candle has been closed .
Inputs: TF (Timeframe of the Alert For Current timeframe use CURRENT)
barshilft : the barshift needs to be the same timeframe as the above TF. barshift format (CURRENT, M1, M5, M15, M30, H1, H4, D1, W1, MN) Send Email: Audible Alert Push N
FREE

G-Labs Market Maker Dashboard - Exclusive Seasonal Offer Elevate your trading with the original G-Labs Market Maker Dashboard, available for a limited time at just $70 USD. Ideal for starter traders, this dashboard has been enhanced with new features and now includes a comprehensive training video. This indicator is for people trading the market makers method and is the entry level dashboard for that strategy is available for both mt4 and mt5. its a market scanner in real time showing peak

MACD divergence Simple edition 原始MACD计算方式,升级为双线MACD,使判断更加直观更加贴合大宗交易平台的研究习惯,同时还会自动用实线标出背离,不用再从0开始苦学钻研。
同时,我还提供了提醒服务,在你忙于家务无暇顾及的时候只需要打开音响,一旦达成背离,第一时间就会让你知晓。
这是一款简单版的看背离指标,MACD的九天均线被称为“信号线”,然后绘制在MACD线的顶部,它可以作为买入和卖出信号的触发器。当MACD越过信号线时,交易员可以买入操作,当MACD穿过信号线以下时,交易者可以卖出或做空操作。移动平均收敛-发散(MACD)指标可以用几种方法解释,但更常见的方法是交叉、散度和快速上升/下降。
FREE

This multicurrency strategy simultaneously determines the strength of the trends, entry points and the take profit levels for each trade. The indicator can determine entry points on any trading period from M1 to D1. For the convenience of users, the indicator renders the entry point (in the form of an arrow), recommended take profit levels (TP1, TP2, TP3) and the recommended stop loss level (SL1, SL2). The options for using the strategy are described below. Full description of the indicator Cosm

Flow Trend Flow trend is designed to detect the market trend with special calculation and a combination of Bolinger band and statistical moving period
to detect the market trend without frequency change and fault.
This indicator is designed with simple parameters to use fast and easy and helpful tools to trade in a pure direction and set your SL/TP with this indicator cloud system.
FREE

his indicator automatically identifies key support and resistance levels by analyzing volume patterns. Unlike traditional S/R tools that rely only on price, Volume S/R finds levels where the market truly reacted. DETECTION LOGIC: - High Volume Zones: Price levels where strong buying/selling occurred - Low Volume Zones: Areas of weak interest - potential breakout or reversal zones
SMART FILTERING: - Nearby levels are automatically merged to avoid chart clutter - Maximum levels limit keeps yo
FREE
O indicador High Low Cloud Trend é uma ferramenta de análise técnica baseada em canais que identifica a direção da tendência e oportunidades de reversão à média através de limites de preço adaptativos. O sistema opera calculando a máxima mais alta e a mínima mais baixa ao longo de um período de retrospectiva especificado, criando limites de canal externos que definem a faixa geral de preço. Um canal interno secundário usa um período mais curto (um quarto do período de retrospectiva principal) pa
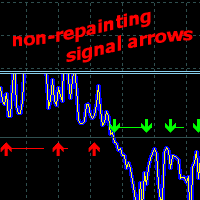
Price Direction Oscillator - é um indicador concebido para detetar movimentos de mercado a curto e médio prazo. Adaptável a qualquer mercado e período,
Consiste numa linha de tendência, um oscilador de volatilidade de mercado e um potencial gerador de sinais de negociação.
Uso do Indicador
Determina a tendência com base na volatilidade do mercado e fornece sinais para a abertura de ordens de COMPRA ou VENDA. Sem redesenhar os seus dados históricos, as setas de sinal não mudam de cor e aparecem
O mercado MetaTrader é um espaço, sem precedentes, para negociar robôs e indicadores técnicos.
Leia o artigo Manual do usuário da MQL5.community para saber mais sobre os serviços exclusivos que oferecemos aos traders: cópia de sinais de negociação, aplicativos personalizados desenvolvidos por freelances, pagamentos automáticos através de sistema de pagamento e a rede em nuvem MQL5.
Você está perdendo oportunidades de negociação:
- Aplicativos de negociação gratuitos
- 8 000+ sinais para cópia
- Notícias econômicas para análise dos mercados financeiros
Registro
Login
Se você não tem uma conta, por favor registre-se
Para login e uso do site MQL5.com, você deve ativar o uso de cookies.
Ative esta opção no seu navegador, caso contrário você não poderá fazer login.