Смотри обучающее видео по маркету на YouTube
Как купить торгового робота или индикатор
Запусти робота на
виртуальном хостинге
виртуальном хостинге
Протестируй индикатор/робота перед покупкой
Хочешь зарабатывать в Маркете?
Как подать продукт, чтобы его покупали
Технические индикаторы для MetaTrader 4 - 16

Этот индикатор является основой для эксперта, который можно отнести к категории "почти Грааль". См. подробности ниже. Этот индикатор отображает проекцию графика ренко на ценовой график. Эта проекция отображается в виде ступенчатой линии, а не в виде "кирпичей" (прямоугольников). См. слайды 1 и 2. Сокращённое название индикатора: LRC – L ine of R enko on the price C hart . Принцип его построения очень прост. Сначала строится сетка горизонтальных линий (уровн
FREE

WaPreviousCandleLevels MT4 shows the previous candle levels, it shows the previous candle Open High Low Close levels (OHLC Levels) in different time frame. It's designed to help the trader to analyse the market and pay attention to the previous candle levels in different time frame. We all know that the OHLC Levels in Monthly, Weekly and Daily are really strong and must of the time, the price strongly reacts at those levels. In the technical analysis, the user can use them as a support and res
FREE
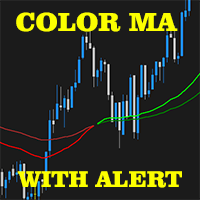
2 EMA Color Alerts Indicator is a powerful tool for any trader looking to stay on top of market movements. By using exponential moving averages (EMAs), this indicator can provide early warning signals for potential market reversals and trend changes. One of the key features of the 2 EMA Color Alerts Indicator is its customizable alerts. With this feature, traders can set their own parameters for receiving alerts, such as the EMA periods and the type of alert (e.g. sound, pop-up, email). This al
FREE
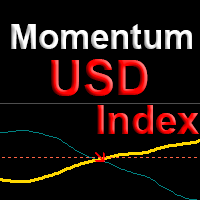
Индикатор показывает точки на продолжение тренда по валютным парам с участием доллара USD с вероятностью более 80%. Работа алгоритма основана на сравнении моментума текущей валютной пары с моментумом индекса доллара DX в текущий момент времени. Использование индекса доллара позволяет оценивать не только текущую пару, а целиком полную картину по всем мажорным валютам сразу. Данный подход увеличивает достоверность и уменьшает количество ложных срабатываний, позволяя строить новые стратегии с высо

Flat Reminder Overview Flat Reminder is a powerful technical analysis tool that identifies and highlights price consolidation zones on your chart. It detects when price action slows down and moves sideways, indicating potential reversal points, continuation setups, or key decision zones in the market. Key Features Consolidation Detection : Automatically identifies flat price zones where market momentum decreases Range Measurement : Calculates and displays the exact range of each consolidation in
FREE

Fibonacci Retracement object is an object that has been provided by metatrader 4 platform. But Fibonacci Retracement object doesn't automated adjust the chart. You have to put and manage it manually to the chart. Because of that, this indicator was created. If you like using filbonacci retracement indicator, highly recommended to use Automated Fibonacci Retracement Indicator if you want to get better result in here:
https://www.mql5.com/en/market/product/95515
LT Automated Fibonacci Retraceme
FREE

Индикатор First RSI level создан для анализа и отображения на ценовом графике уровня, на котором произошло первое пересечение максимального или минимального значения стандартного индикатора RSI, для последующего определения сильных тенденций. Индикатор позволяет отслеживать начало тенденции, не подчиняющейся сигналам стандартной стратегии торговли по индикатору RSI. Когда, к примеру, после достижения уровня перепроданности, цена идет не вверх, а устремляется вниз, тем самым как бы "продавливая"
FREE
Optimize your trading strategy of your custom indicators with the "Indicator Combiner Into One Indicator". This advanced tool combines multiple indicators, including your custom indicators, into a single, user-friendly interface. It generates an arrow signal based on your custom indicators, simplifying your decision-making process. Ideal for traders of all levels, this indicator offers:
Arrow Signals : Get a clear, single arrow signal that combines insights from your custom indicators, mak
FREE

Индикатор Blahtech Daily Range отображает средний дневной диапазон вместе с диапазонами отдельных сессий. Используя дневные цены открытия в качестве опорных, индикатор показывает цели фиксированного диапазона и динамического диапазона в виде линий на графике. Эти линии четко показывают, когда происходит истощение среднего диапазона. Дневные и сессионные диапазоны могут быть полезны для подтверждения входов или для установки целей, а также являются отличным способом улучшить шансы любой торговой
Market Time Watch Лёгкий, чистый и незаменимый инструмент для отображения времени на графике трейдера Market Time Watch — это профессиональный индикатор для отображения времени на графике, созданный для трейдеров, которым требуется точное локальное время, серверное время и таймер текущей свечи. Индикатор показывает всю необходимую информацию прямо на графике, не перегружая интерфейс и не создавая лишних объектов. Если вы торгуете скальпинг, внутри дня, по времени закрытия свечей или вам просто н
FREE
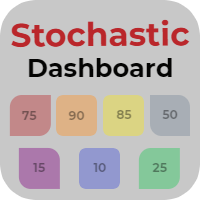
Stochastic Dashboard – информационная панель, дающая вам глобальное видение рынка с помощью стохастика. Stochastic Dashboard анализирует и отслеживает все активы, с которыми вы работаете. Панель позволяет открыть график за несколько секунд и начать работу в нем.
Главные особенности Графическая панель, которая позволяет вам просмотреть ситуацию на многих активах. Семь разных стохастиков для определения перекупленности/перепроданности актива. Оповещения, письма и уведомления, которые позволяют ис
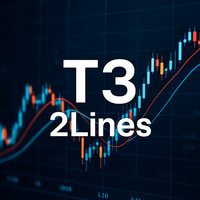
T3 2Lines – Точное определение тренда с двумя линиями T3 «T3 2Lines» — это индикатор для MT4, который отображает две линии T3 (тройное экспоненциальное скользящее среднее) на графике: краткосрочную и долгосрочную. Использование обеих линий позволяет более точно определять начало, продолжение и возможные развороты тренда. Функциональные возможности индикатора Одновременное отображение двух линий T3 (короткой и длинной) Отдельная настройка периода и коэффициента сглаживания (b) для каждой линии Оп
FREE

TG MTF MA MT5 is designed to display a multi-timeframe moving average (MA) on any chart timeframe while allowing users to specify and view the MA values from a particular timeframe across all timeframes. This functionality enables users to focus on the moving average of a specific timeframe without switching charts. By isolating the moving average values of a specific timeframe across all timeframes, users can gain insights into the trend dynamics and potential trading opp
FREE

FOTSI is an indicator that analyzes the relative strength of currencies in major Forex pairs. It aims to anticipate corrections in currency pairs following strong trends by identifying potential entry signals through overbought and oversold target areas. Theoretical Logic of Construction: Calculation of Individual Currency Momentum: FOTSI starts by calculating the momentum for each currency pair that includes a specific currency, then aggregates by the currency of interest (EUR, USD, GBP, CHF,

The Colored MACD indicator is a versatile and powerful tool designed to enhance your technical analysis by providing an intuitive visualization of market momentum and trend changes. Built on the foundation of the popular Moving Average Convergence Divergence (MACD) indicator, this version introduces color-coded histograms to easily distinguish between bullish and bearish momentum. Key Features: Color-Coded Visualization : The indicator features a lime-colored histogram when the MACD is above the
FREE

MACD Crossover Arrows & Alert is a MT4 (MetaTrader 4) indicator and it can be used with any forex trading systems / strategies for additional confirmation of trading entries or exits on the stocks and currencies market. This mt4 indicator provides a BUY signal if the MACD main line crosses above the MACD signal line . It also displays a Sell signal if the MACD main line crosses below the MACD signal line .
STRATEGY Traders can use the MACD signal alerts from a higher time frame
FREE
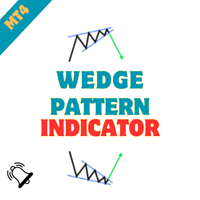
Wedge Chart Pattern Indicator - Unleash the Power of Wedge Patterns in Your Trading Embark on a journey of precision trading with the "Wedge Chart Pattern Indicator." Crafted for MetaTrader, this advanced tool is your ultimate companion for identifying wedge chart patterns, empowering you to make informed and strategic trading decisions. Whether you're a seasoned trader or just starting, this indicator simplifies the process of spotting wedge patterns, providing you with a valuable edge in the m
FREE

This indicator mostly inspired from BW-ZoneTrade custom indicator from MT5. How To Use:
BUY when both dots colored Green. SELL when both dots colored Red. In addition to original one, MACD-OsMA-generated signal also can be drawn. Input Description:
MA_period_short: Faster EMA period for MACD. Applied when drawMACD is true. MA_period_long: Slower EMA period for MACD. Applied when drawMACD is true. MACDperiod: MA period for MACD. Applied when drawMACD is true. drawMACD: When true, draw an additi
FREE

Индикатор показывает на графике к лассические уровни пивота , рассчитанные на основе предыдущего дня. Вы можете выбрать, с какого часа рассчитывать формулу. Торгуйте во флэте на разворот. На трендовом рынке используйте их как цель. Совместите со своими стратегиями для успешной торговли. Уровни строятся с помощью буферов и отображаются на всей доступной истории котировок.
Входные параметры.
Start Hour - с какого часа считать начало дня. 00 - по умолчанию. Show Mid Pivots - отображать промежуто
FREE

The Keltner Channel is a volatility-based technical indicator composed of three separate lines. The middle line is an exponential moving average (EMA) of the price. Additional lines are placed above and below the EMA. The upper band is typically set two times the Average True Range (ATR) above the EMA, and the lower band is typically set two times the ATR below the EMA. The bands expand and contract as volatility (measured by ATR) expands and contracts. Since most price action will be encompasse
FREE
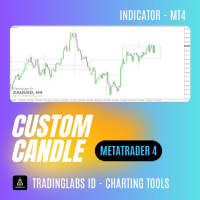
Custom Candle – Multi-Timeframe Visualization Analyzing multiple timeframes is essential for accurate trading decisions, but switching between charts can be inconvenient and inefficient. The Custom Candle indicator solves this problem by overlaying higher-timeframe (HTF) candles directly onto your lower-timeframe (LTF) chart. This allows you to see the bigger picture at a glance, align with the higher trend, and improve trade accuracy—without leaving your current chart. Key Features Multi-Timefr
FREE

ВАЖНОЕ УВЕДОМЛЕНИЕ – ТРЕБУЕТСЯ ЛИЦЕНЗИЯ И АКТИВАЦИЯ
Инструкции по активации:
После завершения покупки, пожалуйста, немедленно свяжитесь с нами, чтобы получить ключ лицензии, пароль или данные для активации. Без них программное обеспечение не будет работать. Мы здесь, чтобы обеспечить бесперебойный процесс активации и помочь вам с любыми вопросами.
Многоязычная настройка
Чтобы улучшить ваш торговый опыт, мы предлагаем полную настройку программного обеспечения на нескольких языках. На
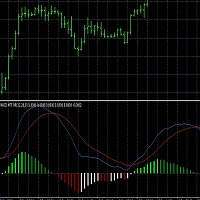
This script generates a MACD with 6 color-coded histogram bars based on the position (above or below zero) and direction (rising or falling) of the histogram. It provides multi-time frame support , allowing users to view the MACD from different time frames on a single chart. The indicator uses customizable settings for MACD periods, histogram width, and vertical scaling. This script could be useful for traders who want a visually enhanced MACD with clearer trend and momentum representation acro
FREE

Данный индикатор - это авторский взгляд на объемы. Как известно, объемы показывают количество продавцов и покупателей за определенный отрезок времени. Как отрезок времени используется свеча. Объемы по High свечи показывают покупателей. Объемы по Low свечи показывают продавцов. По Open свечи показывается Delta. Delta - показывает, кто преобладал на данной свече, покупатели или продавцы.
Входные параметры Distance - расстояние текста объемов от High и Low. Font size - размер шрифта текста. В инди
FREE

Индикатор R 2EMA Color для MT4 дает надежные торговые сигналы, основанные на пересечении двух EMA.
Ключевые моменты Когда цена пересекает и закрывается выше двух зеленых EMA, это создает торговый сигнал на покупку. Когда цена пересекает и закрывается выше двух красных EMA, это создает торговый сигнал на продажу. Индикатор R 2EMA Color Forex позволяет еще проще определить, когда пора покупать и продавать.
Сигнал на покупку возникает, когда две линии EMA становятся зелеными. Сигнал на продажу в
FREE
Special offer : ALL TOOLS , just $35 each! New tools will be $30 for the first week or the first 3 purchases ! Trading Tools Channel on MQL5 : Join my MQL5 channel to update the latest news from me Откройте возможности передового машинного обучения с Machine Learning Adaptive SuperTrend , инновационным индикатором, разработанным для плавной адаптации к изменяющимся рыночным условиям. Благодаря интеграции кластеризации методом k-средних с методологией SuperTrend, этот индикатор позв

Multi Time Frame Indicator acts as a Scanner based on the Ichimoku Trading System. The outcome is displayed on a board. This helps you to make "at a glance" a mental picture of the System without having to open the chart. Up to 10 Currencies can be watched. Scanned elements And Legend "KUMO Futur" - Green : The Kumo Futur is Bullish. "KUMO Futur" - Red : The Kumo Futur is Bearish. "PRICE Cross KJ" - Green : The Price is Above the Kijun Sen. "PRICE Cross KJ" - Red : The Price is Below the Kijun
FREE

BinaryFortune - индикатор, разработан и адаптирован специально для торговли краткосрочными бинарными опционами. Алгоритм индикатора, прежде чем выдать сигнал анализирует множество факторов. Устанавливается индикатор обычным способом. Сам индикатор состоит из информационного окна, где отображается имя торгового инструмента, уровни поддержки и сопротивления, непосредственно сам сигнал ( BUY , SELL или WAIT ). Появление торгового сигнала сопровождается также звуковым сигналом и окном Alert. Преиму
FREE

Introduction This indicator detects volume spread patterns for buy and sell opportunity. The patterns include demand and supply patterns. You might use each pattern for trading. However, these patterns are best used to detect the demand zone (=accumulation area) and supply zone (=distribution area). Demand pattern indicates generally potential buying opportunity. Supply pattern indicates generally potential selling opportunity. These are the underlying patterns rather than direct price action. T
FREE

Как форекс-трейдер, вы понимаете ценность торговой стратегии Фибоначчи в техническом анализе. Однако ручное рисование и корректировка уровней Фибоначчи может занять много времени. Вот тут-то и появляется индикатор Fibonacci Of Yesterday Ultimate . Он разработан специально для трейдеров, использующих стратегию Фибоначчи, основанную на ценовом движении предыдущего дня, что экономит ваше время и усилия. Этот инновационный индикатор автоматически определяет уровни входа, стоп-лосса и тейк-пр
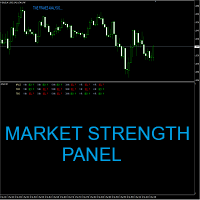
Market Strength Panel - это мульти-таймфреймовая панель, которая будет полезна в торговле как форекс трейдерам, так и трейдерам бинарных опционов. Панель отображает рыночную ситуацию на нескольких тайм фреймах от M1 до H4. Индикатор отображает три важные аспекты рынка. Это Trend, Force и Impulse. Если все три компонента согласованы, то это будет указывать на сигнал, в зависимости от движения рынка. Индикатор дает сигналы в виде сообщений на графике. Вы можете сами выбирать для каких тайм фреймов

Мультивалютный и мультитаймфреймовый индикатор Bollinger Bands. На панели вы можете видеть прорывы и касания (ценой) линий Боллинджера. В параметрах можете указать любые желаемые валюты и таймфреймы. Также индикатор может отправлять уведомления при касании Полос Боллинджера. По клику на ячейке будет открыт данный символ и период.
Параметры Настройки Bollinger Bands Averaging period — период усреднения для вычисления индикатора. Standard deviations — количество стандартных отклонений от основно

Bitcoin Predictor - это стрелочный индикатор, который предсказывает развороты цены на паре BTCUSD. Индикатор можно использовать на других криптовалютах и на обычных валютных парах. Индикатор работает на любом тайм фрейме и валютной паре. В зависимости от пары и тайм фрейма индикатор может показывать очень хорошие результаты. При желании вы самостоятельно можете протестировать индикатор и выбрать наиболее подходящие для вас пары, тайм фреймы. Индикатор очень прост в использовании. Следуйте за с

Necessary for traders: tools and indicators Waves automatically calculate indicators, channel trend trading Perfect trend-wave automatic calculation channel calculation , MT4 Perfect trend-wave automatic calculation channel calculation , MT5 Local Trading copying Easy And Fast Copy , MT4 Easy And Fast Copy , MT5 Local Trading copying For DEMO Easy And Fast Copy , MT4 DEMO Easy And Fast Copy , MT5 DEMO Расширенные полосы Боллинджера:
1. Рельс Боллинджера изменит цвет в зависимости от направлени
FREE
Like most things that work in trading, it's really simple. However, it's one of the most powerful tools I have that makes entries of many systems much more precise.
In its essence, it measures the recent volatility against the medium-term average. How does it work? Markets tend to be prone to strong trending movements when relative volatility is low and tend to be mean-reverting when relative volatility is high.
It can be used with both mean-reversion systems (like the Golden Pickaxe) and mo
FREE

This indicator is based on Guppy's GMMA Strategy. And shows arrows when GMMA lines cross up or down. To have this indicator and get alerts for Multiple Timeframes and multiple Pairs you can check out the demo of this GMMA Trend Scanner indicator: https://www.mql5.com/en/market/product/38747
About GMMA In Brief:
GMMA attempts to identify trends by combining two groups of moving averages with differing time periods: The long-term EMAs (30, 35, 40, 45, 50, and 60) the behaviors of investors that h
FREE
* All Symbols x All Timeframes scan just by pressing scanner button ** *** Contact me to send you instructions and add you in "Candle Scanner group" for sharing or seeing experiences with other users. Introduction: Candles tell their story. When looking at a candle, it’s best viewed as a contest between buyers and sellers. Candlestick patterns are used to predict the future direction of price movement. Candlesticks are an easy way to understand the price action. You can use candlesticks to decid
FREE
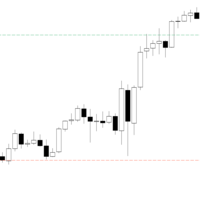
PDHL – отображает максимумы и минимумы предыдущих дней прямо на графике, предоставляя трейдеру быстрый и наглядный ориентир по ключевым уровням прошлых сессий. Индикатор лёгкий и легко настраиваемый : вы можете изменить количество отображаемых дней, цвета, стиль и толщину линий в соответствии со своими предпочтениями. Он создан для удобства и простоты использования, однако может работать не на всех инструментах или платформах . Русский : Тестировался только на CFD
FREE

Индикатор ищет импульсные свечи и отображает их на графике. Включает фильтр теней. Он также находит уровни пробоя полос Боллинджера. В настройках можно включить мультивалютный дэшборд. Оповещение выбирайте между текущим графиком или всем списком. Blog-Link - Retest and Fake Breakout with UPD1
Торговые паттерны: Ретест по тренду. Ложный пробой. Другие.
EURUSD, GBPUSD, XAUUSD, ... M15, M30, H1.
Входные параметры.
Основные. Bars Count - количество баров истории, на которых будет работать индик

Индикатор сессий SMC — это точный инструмент, созданный для трейдеров Smart Money , которые полагаются на концепции ИКТ, охоту за ликвидностью и стратегии на основе сессий . Он плавно отображает критические торговые зоны на основе сессий, используя самые проверенные и популярные концепции, используемые трейдерами институционального уровня. Этот индикатор сессий «все в одном» накладывает на ваш график самые эффективные и высоковероятностные стратегии диапазона, включая: ICT Asian

IceFX SpreadMonitor - специальный индикатор, фиксирующий значение спреда. Он показывает текущий, минимальный/максимальный и средний спред. Эти значения остаются видимыми даже после перезагрузки. Также SpreadMonitor может сохранять необходимые значения спреда в CSV файл для последующего анализа.
Параметры индикатора: SpreadLowLevel - низкий уровень спреда (зеленый цвет) SpreadHighLevel - высокий уровень спреда (красный цвет) BGColor - фон панели SpreadNormalColor - цвет при нормальном спреде Spr
FREE

RoundNumbers indicator is a simple and powerful psychological price levels. Trader usually use these levels as a Support and Resistance (SnR). Indicator Input: Levels - Numbers of levels drawn on chart. Default 30 levels. BoxSize - Box size drawn on each levels, indicate buffers around levels. Default value 1pips (10point) above and below each levels. ZoneSize - Distance between each levels, default value 10pips (100point). Style & Colours - User inputs customization.
For MT5 version, please re
FREE

Этот продукт предназначен для отображения торговых сессий 15 стран на основе часового пояса вашего брокерского сервера и различных режимов отображения на основе желаемых вами настроек для предотвращения перегрузки графиков и возможности установки сессии в желаемое пользователем время.
На рынке Форекс никогда не заходит солнце, но его ритм танцует в такт отдельным торговым сессиям. Понимание этих сессий, их совпадений и их уникальной атмосферы имеет решающее значение для любого трейдера форекс,
FREE

Индикатор показывает на графике круглые уровни . Их еще называют психологическими , банковскими или уровнями основных игроков. На этих уровнях происходит настоящая борьба быков и медведей, накопление множества ордеров, что приводит к повышенной волатильности. Индикатор автоматически подстраивается под любой инструмент и таймфрейм. При пробитии и последующем тесте уровня 80 - покупаем . При пробитии и последующем тесте уровня 20 - продаём . Цель - 00. Внимание. Из-за сильных уровней
FREE

Мультивалютный и мультитаймфреймовый индикатор Inside Bar (Внутренний Бар). В параметрах вы можете указать любые желаемые валюты и таймфреймы. Индикатор отображает последний найденный паттерн Внутреннего Бара, текущее положение цены и пробитие уровней Материнского и Внутреннего Баров. Вы можете устанавливать размер и цвет для баров и текста в ячейках. Также индикатор может отправлять уведомления при пробитие уровней. По клику на ячейке с периодом будет открыт указанный символ и период.
Парамет
Этот индикатор является уникальным в своём роде, больше всего подходит для скальпинга на XAUUSD а также для торговли на более старших таймфреймах!
Уведомление сообщит самые важные точки входа, поэтому следует торговать по тренду. Идеален для скальпинга! The Best Trend Signals - трендовый мультивалютный индикатор, может использоваться на любых финансовых инструментах валюта, криптовалюта, металлы, акции, индексы. Рекомендуемый тайм-фрейм M15, M30, H1, H4, D1.
Как торговать с помощью индикатора
FREE

Bitcoin 999 – трендовый индикатор, который автоматически анализирует рынок и предоставляет информацию о тренде и каждом его изменении, а также подает сигналы для входа в сделки без перерисовки! Индикатор использует каждую свечу, анализируя их отдельно. имея в виду разные импульсы – импульс вверх или вниз. Точные точки входа в сделки по валютам, криптовалютам, металлам, акциям, индексам!
Основные функции: Точные сигналы входа БЕЗ ПЕРЕКРАШИВАНИЯ! Как только сигнал появляется, он остаётся действи
FREE

Cyber Engulf Indicator - Professional Trading System for MetaTrader 4 What is the Indicator?
Cyber Engulf is an advanced technical analysis indicator that detects engulfing patterns filtered by moving average. It identifies trend reversal points, helping you spot changes in market structure early. What Does It Do? Automatically identifies engulfing candlestick patterns Filters out false signals using moving average Displays buy and sell signals with blue/up and red/down arrows Works across mult
FREE

Check my p a id tools they work perfect please r ate Here is an Upgraded version with Bonus Ea in case of purchase it costs 30$ only and you get Ea as Bonus: https://www.mql5.com/en/market/product/96835 This indicator is experimetal, it shows TMA channel arrows with Volatility filter built in to avoid lagging. Try to experiment with it, search for better conditions of use. It is possible to adjust different timeframes for TMA and for Volatility filter Same time on the current chart, so it ma
FREE

Relative Volume or RVOL is an indicator that averages the volume of X amount of days, making it easy to compare sessions volumes.
The histogram only has 3 colors:
Green - Above average volume
Yellow - Average volume
Red - Below average volume
The default setting is 20 days, which corresponds more or less to a month of trading.
With the data obtained from this indicator you can better gauge the commitment behind a move. For example, you will be better equipped to judge if a breakout of a r
FREE

This Weis Wave Volume indicator is a tool to help traders identify the current price trend. Understanding volume can provide insight into a market's behavior to help you determine its overall health. The most important rule is this: volume precedes price. Typically, before a market price moves, volume comes into play. It has 2 main colors histogram which are green and red. – Green indicates an upward wave. The more the price increases, the bigger the green volume gets. – The red color shows a d
FREE

Detailed blogpost: https://www.mql5.com/en/blogs/post/766378
Key Features
Adaptive Upper/Lower bands Smooth Center Line Customizable Length (sensitivity) Non-Repainting (only current ongoing bar is updated every "Refresh After Ticks" number of ticks) Multiple Price Sources - Choose from close, open, high, low, median, typical, or weighted close Components:
The Basis Line The smooth center line represents the weighted average of price. Think of this as the "true" price level when all the noise
FREE

The "Trend Edges" indicator determines whether the trend is rising or falling. It is suitable for any time frame (tested on DAX).
The indicator should be treated like Bollinger Bands, meaning that if it breaks out upwards, you can buy with a stop loss below the lower edge.
Find a trending pair, index or CFD. Additionally :
-Sound alert on trend change.
-Alert Notification
-Alert Notification on your mobile phone Check my other indicator "Trend Edges histogram"
FREE

Индикатор использует линии Полос Боллинджера для обнаружения тренда. Очень полезный инструмент для ручной торговли. Кроме того, можно использовать индикатор с ATR в качестве фильтра, а также включить всплывающее уведомление при развороте тренда. Показатели индикатора очень понятны и просты в использовании. Лучше всего индикатор работает на таймфрейме H1.
Параметры советника: BarsCount - количество баров для расчета линии. BBperiod - период полос Боллинджера. BBdeviations - отклонения полос Болл
FREE

Индикатор Grand Signal -это уникальный инструмент благодаря которому происходит не только понимание природы рынка,но и точное определение точех входа по тренду ,после предела коррекции внутри дня,с точностью до пяти минутной свечи!Имеются индивидуальные настройки для каждой валютной пары!После преобретение обязательно напишите мне в личное сообщение для обсуждения инструкций! Телеграм @Lapinsania или здесь в Маркете!
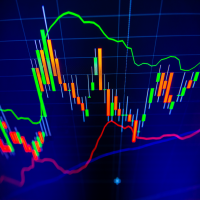
The indicator calculates reversal points based on the past trend and forms a channel (outer) on this basis. This elapsed time span from which the reversal points are determined can be specified in the settings.
An inner channel is also drawn in white. The trend continues in this channel, if there is a sideways trend. Here the upper / lower line form the possible turning point.
The indicator is suitable for all trading areas, whether forex, crypto, metals, indices or futures. All areas traded
DBD AND RBR CANDLESTICK PATTERN: This indicator based on the concept of two candlestick patterns. DROP BASE DROP (DBD) is a buy candlestick pattern and RALLY BASE RALLY (RBR) is a sell candlestick signal pattern. The arrows indicate potential signal setup for long trade and short trade. This indicator includes pop-up alert, push to phone and send to email alert which can be enabled and disabled. The color and size for DBD and RBR can be changed.

This indicator analyzes the ranges in the selected LookBack Bars and shows the relative strength of the price movement with the Level percentage you set. The blue line indicates that the current price movement is strong, and the yellow line indicates that we are in a flat price movement. The blue line does not determine whether the price action is up or down, it just shows relative strength. Therefore, as seen in the picture, direction can be determined with a simple zigzag indicator on the main
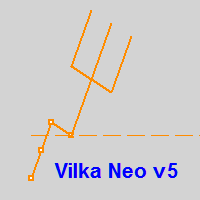
Вилка Нео v5, разрабатывалась для торговой системы "Оракул", но постепенно дополнялась, например - углами Ганна и другими опциями...
Можно создавать графические объекты с заданным цветом, стилем и толщиной, такие как: прямоугольники с заливкой и без, отрезки трендлиний и нестандартный инструмент - "вилка Нео" в виде трезубца, так же есть возможность интерактивно настраивать цветовую палитру прямо с графика, настраивать видимость объектов для разных ТФ, толщину и стили... Панель переключается кла
FREE

Use with disciplined risk management. Fibonacci entry system based on the golden zone 38.2 - 61.8 where the entry is confirmed at 23.6 with indications of Take Profit 3:1. Automatically plotted Fibonacci contains retracement and expansion Fibonacci in a single indicator. Up to 77% win rate with this system. FTMO challenge pass with 0.50% risk and 1.50% R:R.
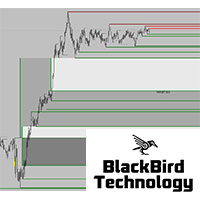
Dear Traders, check out my new multi level market liquidity indicator : https://www.mql5.com/en/market/product/73098
Many of you have been trading very good with this indicator, thanks for the support and positive feedbacks ! For more information about market liquidity, a manual on how to use this indicator please send me a message. A lot of information can be found on the net. (search liquidity trading/ inner circle trader)
https://www.youtube.com/watch?v=yUpDZCbNBRI
https://www.youtube.com/

Introducing a powerful, precision-engineered indicator that seamlessly combines Pivot Points, Moving Averages, and Multi-Timeframe Analysis to deliver high-probability Buy and Sell signals in real-time. This tool is your strategic edge, designed to identify trend reversals, market momentum, and optimal trade entries, no matter your preferred trading style.
Our algorithm goes beyond standard indicators—by analyzing multiple timeframes simultaneously, it spots true market turning points while fi
This Indicator only places quality trades when the market is really in your favor with a clear break and retest. Patience is key with this price action strategy!
If you want more alert signals per day, you increase the number next to the parameter called: Support & Resistance Sensitivity. After many months of hard work and dedication, we are extremely proud to present you our Break and Retest price action indicator created from scratch. One of the most complex indicators that we made with over
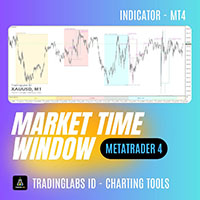
ICT Market Time Cycle – Complete Session & Time Window ICT Market Time Cycle is a professional trading indicator designed to help traders follow the ICT (Inner Circle Trader) methodology with ease.
It automatically displays the main market sessions (Asia, London, and New York), along with Killzones, Silver Bullet windows, and Macro times directly on your chart. With this tool, you no longer need to calculate session times manually – everything is plotted automatically in a clean and professional

Ready to elevate your trading with clear, high-confidence signals? Unlock the Power of Triple-Confirmation Trading! Stop chasing weak signals and start trading with conviction. The Triple Power Indicator is your ultimate tool for identifying high-probability trend moves. We've combined three of the most powerful and reliable technical indicators—Parabolic SAR, MACD, and Exponential Moving Average—into one dynamic system, giving you an unmatched edge in the market. Why You Need This Indicator: U
FREE

Скачайте индикатор уровней поддержки и сопротивления( Support and resistance ). Индикатор рисует горизонтальные и трендовые уровни поддержки и сопротивления. Настройки индикатора: Trends - Установка режима отображения трендовых или горизонтальных уровней поддержки сопротивления Yes - отображает только трендовые уровни No - отображает только горизонтальные уровни UseResource - Установка режима использования встроенных в индикатор ресурсов. Yes - использовать индикатор ZigZag из ресурсов продукта.
FREE

Индикатор поиска магнитной цены, средняя цена, к которой цена стремится вернуться. Оптимизирован под XAUUSD H1. Имеет 3 линии, центральная, цена к которой необходимо держать ориентир. На исторических данных успешность возврата к средней цене составил более 92% с настройками по умолчанию, в остальных случаях срабатывал стоплосс, который установлен по умолчанию. Точка входа и время входа ориентировочно в начале дня и для удобства первая свеча нового дня, помечается стрелкой в зависимости от того
FREE

Название продукта Smart Bulls (MT4) – часть серии SmartView Краткое описание Индикатор Bulls с уникальным пользовательским опытом на платформе MetaTrader. Предоставляет расширенные возможности, ранее недоступные, такие как открытие настроек двойным кликом, скрытие и отображение индикаторов без удаления, и отображение окна индикатора на весь размер графика. Разработан для работы вместе с остальными индикаторами серии SmartView. Обзор Серия SmartView предлагает уникальный и отличительный пользоват
FREE

Chart Patterns Detect 15 patterns (Ascending Triangle, Descending Triangle, Rising Wedge, Falling Wedge, Bullish Flag, Bearish Flag, Bullish Rectangle, Bearish Rectangle Symmetrical triangle, Head and Shoulders, Inverted Head and Shoulders, Triple top, Triple Bottom, Double Top, Double Bottom) Use historical data to calculate the probability of each pattern to succeed (possibility to filter notification according to the chance of success) gives graphic indication about the invalidation level and

The Smart Liquidity Profile is color-coded based on the importance of the traded activity at specific price levels, allowing traders to identify significant price levels such as support and resistance levels, supply and demand zones, liquidity gaps, consolidation zones, Buy-Side/Sell-Side Liquidity and so on. Smart Liquidity Profile allows users to choose from a number of different time periods including 'Auto,' 'Fixed Range,' 'Swing High,' 'Swing Low,' 'Session,' 'Day,' 'Week,' 'Month,' 'Quar
MetaTrader Маркет - лучшее место для продажи торговых роботов и технических индикаторов.
Вам необходимо только написать востребованную программу для платформы MetaTrader, красиво оформить и добавить хорошее описание. Мы поможем вам опубликовать продукт в сервисе Маркет, где его могут купить миллионы пользователей MetaTrader. Так что занимайтесь только непосредственно своим делом - пишите программы для автотрейдинга.
Вы упускаете торговые возможности:
- Бесплатные приложения для трейдинга
- 8 000+ сигналов для копирования
- Экономические новости для анализа финансовых рынков
Регистрация
Вход
Если у вас нет учетной записи, зарегистрируйтесь
Для авторизации и пользования сайтом MQL5.com необходимо разрешить использование файлов Сookie.
Пожалуйста, включите в вашем браузере данную настройку, иначе вы не сможете авторизоваться.