Hurst Cycles MT5

Overview

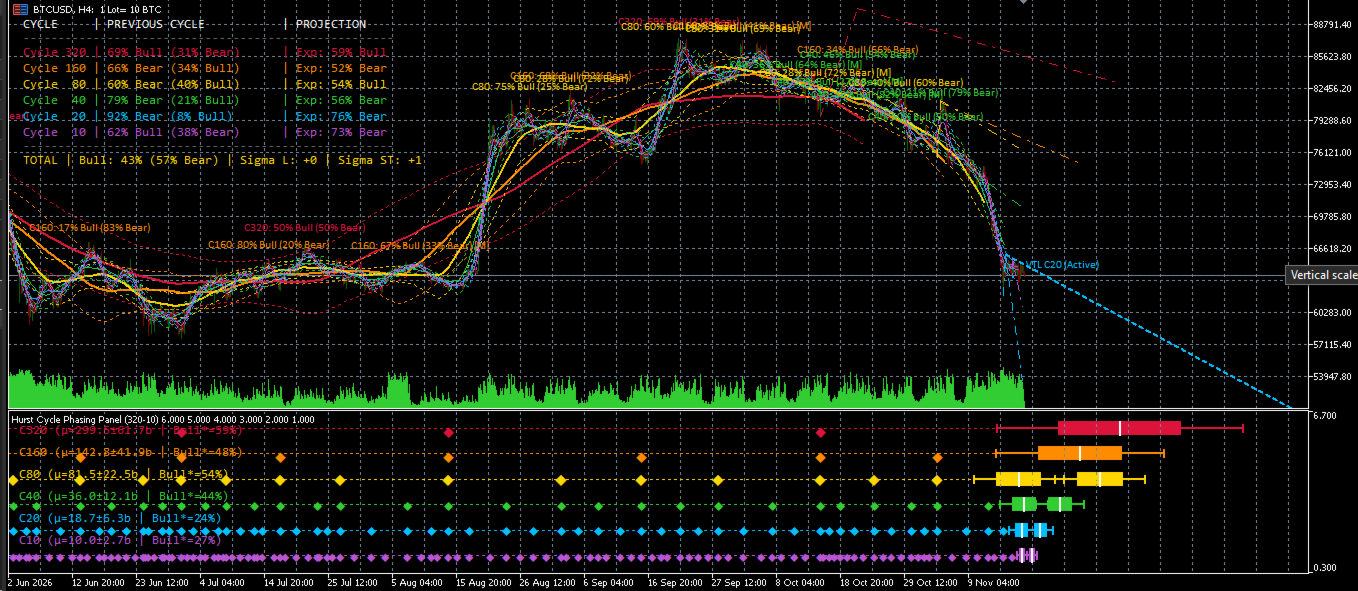
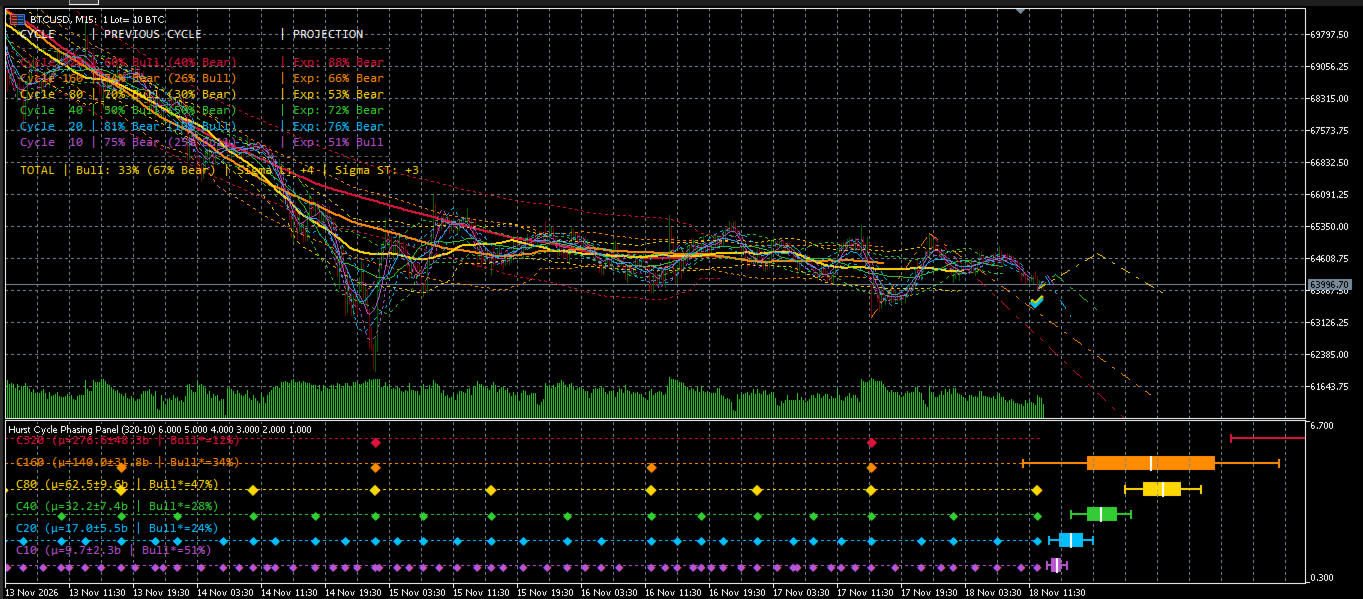
Hurst Cycles MT5 is a technical analysis indicator for MetaTrader 5 designed for Hurst cycle analysis using Centered Moving Average (CMA) envelopes across six harmonic periods (10, 20, 40, 80, 160, and 320 bars). It provides 2:1 harmonic trough synchronization, cycle bullishness/bearishness metrics, Valid Trend Line (VTL) and cycle projections.

Key Features

  • Multi-Cycle CMA Envelopes (10–320): Displays six nested CMA center lines and standard deviation bands on the main chart (with optional toggles to hide them).
  • 2:1 Harmonic Synchronization: Aligns cycle troughs across all six timeframes from the largest cycle (320) down to the shortest cycle (10).
  • Bullishness & Bearishness Dashboard: Summarizes the previous completed cycle percentages, expected bias, overall bullishness, and Sigma L / Sigma ST timing metrics in an on-chart table.
  • VTL & Mid-Channel Pause Detection: Identifies triangular consolidation pauses, draws active/broken VTLs, and marks validated early troughs.
  • 4-Variable Projections & Phasing Sub-Panel: Projects expected cycle peaks and troughs in both price and time, alongside an optional separate sub-panel showing stacked cycle diamonds and box-whisker timing windows.

Input Parameters

  • Max history bars to analyze
    Sets the maximum number of historical bars used to compute envelopes and cycle structures.

  • Standard deviation multiplier for CMA envelopes
    Controls the width of the upper and lower CMA channel bands; used both for chart visualization and internal calculations.

  • Forward trough search tolerance (+/- %)
    Defines the percentage search window around each expected cycle period when locating cycle troughs.

  • Number of cycles (~12 troughs) for mean & std dev
    Sets how many recent completed cycles are used to calculate average cycle duration and standard deviation for timing projections.

  • Auto-adjust mixed cycles (M-shape) & inconsistencies
    Enables automatic adjustment of mixed M-shaped cycle structures and post-low triangle pivots.

  • Auto-attach separate diamonds & boxes sub-panel
    Automatically attaches the companion phasing sub-panel below the main chart to display stacked cycle diamonds and statistical timing boxes.

  • Hide CMA center lines
    Hides the six CMA center lines from the main chart while keeping internal cycle calculations active.

  • Hide CMA channels (upper/lower bands)
    Hides the upper and lower CMA envelope bands from the main chart while keeping internal cycle calculations active.

  • Show diamonds on main chart (false = sub-panel only)
    Toggles whether cycle trough diamonds and timing whisker boxes are also drawn directly on the main price chart.

  • Show cycle labels on candles (false = top table only)
    Displays bullishness/bearishness percentage labels above recent cycle peaks on the price chart.

  • Show bullishness sync check marks (✔) on candles
    Displays check marks on candles where early or pre-CMA troughs are validated.

  • Project 4 variables (Peak & Trough in Price/Time)
    Draws the cycle projection lines in both time and price directly on the main price chart/price axis (from the active trough to the projected peak and next projected trough).

  • Show Mid-Channel Pause triangles, VTL & early troughs
    Displays detected mid-channel pause structures, VTL trend lines (active or broken), and associated early trough markers.

  • Show top-left table (true = Visible, false = Hidden)
    Shows or hides the summary dashboard table in the top-left corner of the chart.

  • Table background (Transparent or Opaque Black)
    Selects between a transparent background or a solid black background for the dashboard table.


Risk & Analytical Disclaimer: For educational and technical analysis purposes only—not investment or trading advice. Hurst Cycle analysis is speculative; by their mathematical nature, these cycles and indicator repaint and adjust dynamically with new price action. Trade at your own risk.
Recommended products
MFOP Market Forecast
Oscar Josue Pin Bacuzoy
Develop this indicator for periods of 30 minutes or more, focus on getting market trends right and making sure they are met. MFOP v8.1 gets straight to the point: it scans the market and tells you exactly when there is enough strength to enter a trade. This indicator doesn't do magic, it uses mathematical algorithms to filter out market noise, not enter into false breakouts and show you clear BUY (blue arrow) and SELL (red arrow) opportunities. It is designed and optimized specifically to take
NQX Exhaustion Reversal
Marcel De Oliveira Farias
NQX Exhaustion Reversal is a signal indicator for MetaTrader 5: exhaustion reversal confirmed by several conditions on the same candle. Proprietary NQX logic that waits for exhaustion confirmed by several independent conditions on the same candle. It draws the suggested entry, a short stop and long targets (3:1, 5:1, 10:1); you decide. What it draws on the chart - An arrow on the closed signal candle (it never repaints a closed signal). - The suggested entry, a short stop and a long suggested ta
Institutional Fusion Levels Institutional Fusion Levels is a professional multi-timeframe support and resistance indicator designed to identify high-probability institutional price reaction zones using market structure levels from the previous day, previous week, and previous month. The indicator automatically plots key liquidity-based support and resistance areas on the chart and highlights strong confluence zones where higher timeframe levels merge. These fusion zones often act as institutiona
Session Killzones Asia London New York marks the most important trading sessions on your chart. Asia, London and New York session boxes , each labelled with its range in pips. Previous Day High and Low (PDH / PDL) levels. Asian range breakout alerts during London and New York. Automatic broker GMT offset detection , with a manual override. Session hours you can change, given in GMT. Custom colors and the number of days to show. Inputs Detect broker GMT offset automatically / Manual GMT offset –

My Candle
Francisco Gomes Da Silva
Define your own candlestick pattern and this indicator will show on the screen when this pattern appears You can test it for free in the Strategy Tester and see how many times your candlestick pattern appears on the asset of your choice You can also paint all candles of your pattern or just one This indicator is useful for candlestick analysis, for you to use in price action and with naked trade strategies. It is an indicator that shows the movement you choose How to Use the Indicators: AC AC[1
MNFM Mega MT5
Khalid Abdullah M Altuwaijri
Mega MNFM MT5 Mega MNFM brings ten technical readings, a seven-timeframe trend map, regional session clocks and account-deal statistics into one MetaTrader 5 dashboard. Technical dashboard RSI, MACD histogram, Stochastic, EMA trend, ADX, Bollinger Bands, an asset technical Fear & Greed proxy, an indicative synthetic dollar basket, ATR rank and OBV flow. Readings use completed candles. The timeframe map covers M1, M5, M15, M30, H1, H4 and D1. The dashboard includes a directional summary, trend
FREE
Adaptive SR Zones – Breakout Edition Adaptive SR Zones is a next-generation MetaTrader 5 indicator that automatically maps support and resistance zones and tracks breakout activity in real time. Designed for traders who rely on market structure and zone confluence, it combines multi-timeframe analysis , breakout confirmation logic , and customizable alerts into one powerful tool. No repainting. Core Features Dynamic Support & Resistance Mapping Detects zones from swing highs/lows and reaction po
Introduction to Fractal Pattern Scanner Fractal Indicator refers to the technical indicator that makes use of the fractal geometry found in the financial market. Fractal Pattern Scanner is the advanced Fractal Indicator that brings the latest trading technology after the extensive research and development work in the fractal geometry in the financial market. The most important feature in Fractal Pattern Scanner is the ability to measure the turning point probability as well as the trend probabil
An all‑in‑one trading assistant that blends AI candle synthesis with a 15‑pattern Heat Map, ATR‑scaled S/R & pivots, and a Vigilant risk monitor (LOC/TF/SR/PAT gates, Ready%, EM points, SR‑distance bar). The Opportunity Advisor adds ETAs, checklists and gate status; Multi‑TF Confluence confirms alignment from M1–D1. The Professional Trade Suggestion panel shows regime, session filter, R:R presets, Partials and Quality Pause. Clean, readable UI with one‑click S/R toggles, scanners and a built‑in,
Elliott Wave Pro
Timothy Chuma Ifiora
Elliot Wave Pro is an MT5 indicator that automatically detects Elliott Wave structures (impulse and corrective behavior) and calculates key Fibonacci-based retracement/limit levels from the most recent completed wave. It helps turn wave structure into a tradable setup: enter on the pullback, target Wave 1 , and place your stop beyond the wave high / invalidation level . That gives you a clear risk-to-reward model where a single valid setup can outweigh multiple small losses. In short, it shows w
I recommend you to read the  product's blog  (manual) from start to end so that it is clear from the beginning what the indicator offers. This multi time frame and multi symbol supply and demand zone dashboard indicator sends alerts when the price has reached a supply/demand zone. It is also possible to use it to be alerted about regular double tops/bottoms instead of zones. It can be used with all time frames from M1 to MN. Maximum 9 time frames can be shown in the dashboard at the same time. 
FirstCandle LDN NY
Isaac Alexander Pinero Garcias
First Candle Sessions — LDN & NY MT5 Indicator   |   M1 to H1   |   London and New York Sessions   What It Does Automatically marks the High, Low and 50% midpoint of the first 5-minute candle at the opening of the London and New York sessions, creating a clear visual range to trade breakouts every day without any manual work.   Buy signal: when a subsequent candle closes above the High of the first candle. Sell signal: when a subsequent candle closes below the Low of the first candle. No signal
The indicator for trading on the signals of the harmonic pattern AB=CD. It gives signals and shows the levels of entry into the market, as well as levels for placing stop orders, which allows the trader to make timely decisions on entering the market, as well as effectively manage positions and orders. It supports sending push notifications to a mobile device, e-mail, as well as alerts. This indicator has been ported from the version for MetaTrader 4. For more information, as well as a detailed
This indicator is an indicator for automatic wave analysis that is perfect for practical trading! Case... Note:   I am not used to the Western name for wave classification. Influenced by the naming habit of Chaos Theory (Chanzhongshuochan), I named the basic wave as   pen   , the secondary wave band as   segment   , and the segment with trend direction   as main trend segment   (this naming method will be used in future notes, let me tell you in advance), but the algorithm is not closely relate
Gf Breakout
Kayode George Absi
A ZigZag indicator for MetaTrader 5 that finds swing highs and lows, spots W-bottom and M-top patterns, and gives a BUY or SELL signal when the second leg of a pattern forms at an H1 swing point and price breaks the trendline. 1. Key advantages See the structure at a glance. Clear red ZigZag lines join the major swings, with a down arrow on every swing high and an up arrow on every swing low. Trade with the higher timeframe. On M1, M5 or M15, a signal only appears when the second leg sits on an
Dual-Period Williams %R Oscillator for MT5 A sophisticated trend exhaustion detector that combines two Williams %R oscillators to identify high-probability reversal opportunities through confluence analysis. ======================================================================================== Key Features Intelligent Dual-Signal System Fast and Slow Williams %R periods working in confluence Real-time trend exhaustion detection with reliable signals Optimized calculations for smooth MT5 perfor
Descriptions A point point is a technical analysis indicator, or calculations, used to determine the overall trend of market over different time frames. This indicator calculate the highest or lowest pivots among left x and right y bars and show the high/low level during that period.   From that, you could clearly see the top resistance & bottom support level and how market goes break out. Instructions pivotLeft - pivot left bar count pivotRight - pivot right bar count pivotHighColor - color
Adaptive Math Zones Indicator is a professional MT5 indicator designed to identify high-probability price reaction areas using mathematical price projections and Fibonacci-based channel structures. The indicator automatically builds a reference price channel, highlights neutral zones, and projects future price levels (50%, 100%, and 200%), helping traders visually understand market structure and potential reaction points. This tool is especially effective during ranging and corrective market con
Five Candles Pattern MT5
Miguel Antonio Rojas Martinez
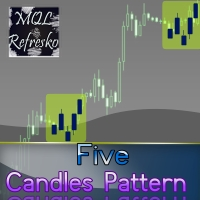
The "Five Candle Pattern" indicator is a novel way to see the market, because with it we can compare and/or seek training or the pattern of the past 4 or 5 Candles, and identify them in the same graph, to view your behavior at an earlier time. The indicator creates a pattern of those 4 or 5 candles and searches backward, identifies, and marks the same formation or pattern. With that information you adjust the strategy that is operating, or create a new one, because you can compare the past devel
SLL Struct
Akarat Premprat
SLL Struct is a market structure and cycle Fibonacci indicator for MetaTrader 5. It is designed to help traders visualize confirmed price swings, identify Bull and Bear market structure, classify breakout behavior, and display cycle-based Fibonacci extension levels directly on the chart. Main features: • Confirmed Swing High and Swing Low structure • Bull and Bear market structure visualization • Complete and Neck Break classification • Divergence-aware structure classification • Candidate c
AI Chandelier Exit Indicator
Fadi Hassan Khaled Ghanem
Plots the active chandelier exit (highest high minus ATR multiple for longs, lowest low plus ATR multiple for shorts) and marks trend flips with arrows and alerts. Key features Calculated on closed bars, values do not repaint Works on any symbol and timeframe All periods, levels and colours can be changed in the inputs Light on resources with a maximum bars setting Popup, sound, push and email alerts on new signals Buffers available for use in your own Expert Advisors (iCustom) Buffers 0 Long st
FREE
Swing Breakout by MQL Swing Breakout is an automated trading system designed for MetaTrader 5, built to identify and trade market breakout opportunities using swing levels. Key Features: Specially Design for BTCUSD  Automated swing breakout trading. Customizable timeframe and swing level settings. Multiple trade and basket management. Automated take profit and stop loss management. Dynamic trailing stop-loss. Optional lot multiplier and loss recovery. High-impact USD news filter. Market session
Blogs : https://www.mql5.com/en/blogs/post/768816 MT4 Version https://www.mql5.com/en/market/product/139061 MT5 Version https://www.mql5.com/en/market/product/139062 Problem Monitoring multiple symbols and timeframes at the same time is slow, repetitive, and mentally exhausting. Most traders waste time switching charts one by one, only to realize the move has already happened. By the time a clear trend change is visible, the opportunity is often late or missed. Solution Scanner HalfTrend [ta
CandleStick Patterns Indicator for MT5 — Professional Pattern Scanner Bring proven candlestick analysis into your workflow. This indicator automatically scans your chart and highlights high-quality reversal and continuation patterns, so you can react faster and with more confidence. Check the “More from author” section on the Market page to see our full suite of indicators. What it does Scans historical and live candles from a user-defined lookback range. Detects and labels major single- and m
Power House
Sabrina Hellal
PowerHouse v3 MT5 – Advanced Smart Money Concepts, KAMA Ribbon & MTF Matrix Short Summary: An institutional-grade SMC & ICT trading system featuring confirmed CHoCH/BOS market structure breaks, a 7-factor confluence engine (Grade A/B/C), adaptive trend ribbon, automated trade plans with live Won/Lost points metrics, and a 6-timeframe dashboard. Product Overview PowerHouse v3 is a professional-grade analytical indicator built for disciplined Forex, Indices, and Crypto traders on MetaTrader 5. Eng
SX Chart Tools
Nikolett Gorjanacz Toth
SX Chart Tools for MetaTrader 5 SX Chart Tools was made out of the everyday mess of working with several charts in MetaTrader 5. Every chart lives on its own: colours have to be set one by one, templates and saved profiles only help so far, and nothing keeps the charts in step when you change the symbol, scroll back or draw a zone. SX Chart Tools puts all of this on one small panel. STYLE - one look for all your charts A look stores everything you see on a chart: background, grid, candle and
XAU Portfolio Pro 3 TimeFrames
Fernando Medina Villanueva
XAU Portfolio Pro 3 Time Frames Strategy Overview XAU Portfolio Pro 3 Time Frames is a fully automated Expert Advisor portfolio designed exclusively for trading Gold on the M15, H1 and H4 timeframes. This portfolio combines three proven strategies to provide consistent returns across different market conditions. Development & Robustness Testing This portfolio has been developed using over 20 years of historical tick data, providing a solid statistical foundation for strategy validation. Ext
AlgoForge NewsGuard
Daniel Oladipupo Anjorin
NewsGuard reads the MetaTrader 5 economic calendar and keeps your account flat around high-impact news. A few minutes before a release it closes the positions it manages and deletes their pending orders. Until the news window has passed, it removes any new trade or order that appears, from any Expert Advisor or from manual trading. It is a protection tool, not a strategy. It never opens trades on a live or demo account. WHO IT IS FOR - Prop-firm traders whose account has a news trading rule -
SMC Workflow Auto EA
Choawana Malaikitsanachalee
English – Product Description (V1.42) SMC Workflow Auto EA — SR / OB / FVG with BOS–CHOCH Confirmation Smart-Money-Concepts Expert Advisor that trades only when a clean SMC setup appears: Order-Block retest after Break of Structure (BOS / CHOCH) confirmation, with optional SR and Fair Value Gap (FVG) confluence. The EA uses pending limit orders, fixed SL/TP or RR-based exits, step-lock trailing and strict risk-controls designed to pass broker validation. What it does Detects swing structure usi
FREE
Aussenstab Markttechnik
Alexander Josef Zeidler
This indicator shows external bars ("Aussenstäbe") in the chart in candle form. The colors of the candles can be set individually. Also different colors for bearish and bullish bars are possible. In addition, the color of the wicks or outlines is also adjustable. Outside bars are mentioned e.g. by Michael Voigt in the book "Das große Buch der Markttechnik". All other candles are inner bars.
Buyers of this product also purchase
Trend Sniper X
Sarvarbek Abduvoxobov
4.87 (46)
Trend Sniper X is a multi-timeframe trend-following indicator for MetaTrader 5 that helps traders identify trend direction and potential reversal points with clarity and precision. for MT4: https://www.mql5.com/en/market/product/193245 Price Information: The current price is promotional and is subject to change as upcoming updates and new features are released. Bonus Offer: To get the FREE Auto-Trade Assistant EA for this indicator, please message the author after purchasing. Code2Profit Channe
Entry Points Pro shows you where to enter, where to put the stop and what lot to trade — before you place the order. PRICE Now 199 USD: 4 copies at this price, then 249 USD. The final price is 349 USD. I make my money trading the markets, and I show it, so I don't need to sell this indicator to everyone. It is a tool for traders who think for themselves, not a magic button. No breakout, no trade. A gray arrow is a cancelled signal: price did not break the signal candle, so there was no entry
Gann Made Easy   is a professional and easy to use Forex trading system which is based on the best principles of trading using the theory of W.D. Gann. The indicator provides accurate BUY and SELL signals including Stop Loss and Take Profit levels. You can trade even on the go using PUSH notifications. PLEASE CONTACT ME AFTER PURCHASE TO GET TRADING  INSTRUCTIONS   AND GREAT EXTRA INDICATORS  FOR FREE! Probably you already heard about the Gann trading methods before. Usually the Gann theory is a
Ultra Indicator
Ihor Otkydach
5 (1)
ULTRA is a technical indicator that operates on an “all-in-one” basis—it independently analyzes the market, generates trading signals, displays levels for setting stop-loss orders, and suggests when to close trades to lock in profits or minimize losses. In other words, it doesn't matter if you don't know how to analyze the market, determine levels—where to set your stop-loss—or struggle with money management. ULTRA will do all of that for you! BUYER BONUS: After purchasing the ULTRA indicator, s
Currency Strength Wizard   is a very powerful indicator that provides you with all-in-one solution for successful trading. The indicator calculates the power of this or that forex pair using the data of all currencies on multiple time frames. This data is represented in a form of easy to use currency index and currency power lines which you can use to see the power of this or that currency. All you need is attach the indicator to the chart you want to trade and the indicator will show you real s
Auto Optimized SpeedAngle is an institutional-grade momentum vectoring system that eliminates curve-fitting through continuous Walk-Forward Optimization (WFO). Rather than relying on static inputs that degrade when market regimes shift, the indicator dynamically recalibrates its parameters using Out-of-Sample (OOS) validation, ensuring the displayed signals represent genuine statistical edges rather than historical anomalies. By shifting the focus from subjective visual angles to normalized, qua
Boba Analysis Suite
Trade Ready Solutions LLC
5 (2)
Boba Analysis Suite Boba Analysis Suite is an analytical indicator for MetaTrader 5. It brings market structure, relevant price zones and broader market context together in a single chart view. Developed through practical experience as a trader and trading coach, it supports a structured analysis process: assessing market direction, identifying important levels and considering multiple timeframes together. Analysis in Context Individual signals gain meaning through context. Boba Analysis Suite h
BLACK FRIDAY – 20% OFF Multi Currency Strength and Momentum Indicator MT5 Dynamic Forex28 Navigator is the evolution of our long-time, popular indicators, combining the power of five in one: Advanced Currency Strength28 Indicator (700 reviews) Advanced Currency IMPULSE with ALERT (530 reviews) Currency Strength EXOTICS GOLD Impulse with Alert CS28 Combo Signals (recent Bonus) No need to buy four indicators and stack them on your charts. All of it is merged into one powerful indicator: the streng
M1 Sniper MT5
Oleg Rodin
5 (7)
M1 SNIPER  is an easy to use trading indicator system. It is an arrow indicator which is designed for M1 time frame. The indicator can be used as a standalone system for scalping on M1 time frame and it can be used as a part of your existing trading system. Though this trading system was designed specifically for short-term trading, it still can be helpful for all traders. This trading system can be used with any forex pair and time frame, though lower time frames are recommended from M1 up to M
Azimuth Pro
Ottaviano De Cicco
5 (7)
Azimuth Pro V2: Synthetic Fractal Structure and Confirmed Entries for MT5 Overview Azimuth Pro is a multi-level swing structure indicator by Merkava Labs . Four nested swing layers, swing-anchored VWAP, ABC pattern detection, three-timeframe structural filtering, and closed-bar confirmed entries — one chart, one workflow from micro-swings to macro-cycles. This is not a blind signal product. It is a structure-first workflow for traders who care about location, context, and timing. 1. What Change
Apex Patterns PRO Buy Indicator - Get Expert Advisor Based on it for FREE. Self-Optimizing Chart Pattern & Breakout Intelligence Traditional pattern scanners rely on fixed inputs, often underperforming when market volatility and structures shift. Apex Patterns PRO is designed to adapt to changing market conditions by combining structural chart pattern recognition, momentum filtering, and statistical self-optimization into one analytical framework. Adaptive Scanning Engine Self-Optimizing Patter
Divergence Bomber
Ihor Otkydach
4.89 (94)
Each buyer of this indicator also receives the following for free: The custom utility "Bomber Utility", which automatically manages every trade, sets Stop Loss and Take Profit levels, and closes trades according to the rules of this strategy Set files for configuring the indicator for various assets Set files for configuring Bomber Utility in the following modes: "Minimum Risk", "Balanced Risk", and "Wait-and-See Strategy" A step-by-step video manual to help you quickly install, configure, and
Naked Forex Tweezer Pro Indicator Tweezer Pro Indicator is a pattern recognition indicator for Forex, Stocks, Indices, Futures, Commodities and Cryptos. The standard Tweezer is a two bar pattern. Our enhanced version is a multi-bar pattern. We filter the patterns for you so that you only get the     best and most effective patterns   and ignore the noise. The Tweezer pattern is a simple and effective pattern to trade. The strategy that comes with the Tweezer is based on price action. The Twe
Adaptive Price Action Engine Buy Indicator- Get EA Based on it for FREE. Self-Optimizing Multi-Timeframe Trend & Candlestick Intelligence Markets do not behave the same way all the time—and not every price-action pattern has the same value in every market regime. Adaptive Price Action Engine is designed to adapt to changing market conditions by combining trend structure, multi-timeframe analysis, candlestick patterns, and statistical optimization into one analytical framework. Two Adaptive Mode
Fx Levels Premium Indicator Support and Resistance are important concepts in trading. Fx Levels Premium was created to easily draw important levels of support and resistance for the active trader. The indicator will give you all important levels (support/resistance) to watch for a wide range of assets. Trading without these levels on your chart is like driving a car for a long journey without a roadmap. You would be confused and blind. Support and resistance levels should be used as guideline
OrderFlux – Orderflow Footprint Chart, Volume Profile & Market Profile Indicator for MetaTrader 5 OrderFlux is an order flow footprint indicator for MetaTrader 5 that explains itself. It opens the single candle and shows what happens inside it: the volume traded at every price level, split into aggressive buyers and aggressive sellers. From the ticks it builds a complete footprint chart in real time with delta, imbalance, absorption, volume profile, market profile (TPO), VWAP, cumulative delta (
Meridian Pro
Ottaviano De Cicco
4 (3)
Meridian Pro 2.00: Professional Multi-Timeframe Trend Matrix for MT5 Meridian Pro 2.00 is a professional adaptive trend matrix for MetaTrader 5. It combines the original Meridian trend engine, a clean chart ribbon, closed-bar signal arrows, an 8-timeframe dashboard, Fuel momentum, weighted consensus, synthetic HTF processing and chart-native higher-timeframe context lines. The goal is simple: read current trend, multi-timeframe structure, strength, momentum and EA-ready state from one discipline
Apollo SR Master is a Support/Resistance indicator with special features which make trading with Support/Resistance zones easier and more reliable. The indicator calculates Support/Resistance zones in real-time without any time lag by detecting local price tops and bottoms. Then to confirm the newly formed SR area, the indicator shows special signal which signalizes that the SR zone can be taken into consideration and used as an actual SELL or BUY signal. In this case the strength of the SR zone
Neuro Poseidon MT5
Daria Rezueva
4.68 (53)
Neuro Poseidon is a new indicator by Daria Rezueva. It combines precise trading signals with adaptive TP/SL levels - creating best possible trades as a result! Message me and get  Neuro Poseidon Assistant  as a gift to automize your trading process! What makes it stand out? 1. Proven profitability on all assets and timeframes 2. Only confirmed BUY and SELL signals present on the chart 3. Adaptive TP & SL levels generated by the software for each trade 4. Easy to understand - suitable for al
Trend Lines PRO MT5
Roman Podpora
5 (1)
TREND LINES PRO    helps understand where the market is truly changing direction. The indicator shows real trend reversals and points where major players re-enter. You see   BOS lines   Trend changes and key levels on higher timeframes — without complex settings or unnecessary noise. Signals don't repaint and remain on the chart after the bar closes. VERSION MT 4     -     Reveals its maximum potential when paired with the   RFI LEVELS PRO  indicator What the indicator shows: Real shifts   tren
ARICoins
Temirlan Kdyrkhan
ARICoin is a powerful trading companion designed to generate high-probability entry signals with dynamic TP/SL/DP levels based on volatility. Built-in performance tracking shows win/loss stats, PP1/PP2 hits, and success rates all updated live. Key Features: Buy/Sell signals with adaptive volatility bands Real-time TP/SL/DP levels based on ATR Built-in MA Filter with optional ATR/StdDev volatility Performance stats panel (Success, Profit/Loss, PP1/PP2) Alerts via popup, sound, push, or email Cust
Bill Williams Advanced
Siarhei Vashchylka
5 (11)
Bill Williams Advanced is designed for automatic chart analysis using Bill Williams' "Profitunity" system. The indicator analyzes four timeframes at once. Manual (Be sure to read before purchasing) Advantages 1. Analyzes the chart using Bill Williams' "Profitunity" system. Signals are displayed in a table in the corner of the screen and on the price chart. 2. Finds all known AO and AC signals, as well as zone signals. Equipped with a trend filter based on the Alligator. 3. Finds "Divergence Bar
Precision Spike Detector
Francisco Mandomo Simbine
5 (2)
Precision Spike Detector V3 – Institutional-Grade AI Trading System Attention: The price increases by US$50 for every 10 purchases.  Final price: US$599 Precision Spike Detector V3   is a   state-of-the-art, institutional-grade market analysis system   for   MetaTrader 5 , designed to detect   high-probability market movements   in synthetic indices such as   Boom, Crash, GainX, and PainX . After purchase, send me a private message to receive the optimized configuration files,  the installation
TPA True Price Action indicator reveals the true price action of the market makers through 100% non-repainting signals strictly at the close of a candle! TPA shows entries and re-entries, every time the bulls are definitely stronger than the bears and vice versa. Not to confuse with red/green candles. The shift of power gets confirmed at the earliest stage and is ONE exit strategy of several. There are available now two free parts of the TPA User Guide for our customers. The first "The Basics"
Superhero
Ihor Otkydach
5 (3)
The SUPERHERO indicator is a multi-currency trading system designed on an "all-inclusive" basis. The indicator independently analyzes the market and provides signals on when to open and close trades. It uses Stop Loss and Take Profit orders. The R:R ratio is 1:1. This system can send push notifications to your smartphone, so you can place trades "on the go" without needing to be tied to a PC. It's perfect for proprietary trading firms. A BONUS FOR EVERY CUSTOMER: Every buyer of this indicator wi
RSI Thunder MT5
Muhammad Abdulrahman Omar Naima Allah Al-rais
RSI Thunder is a powerful and intelligent trading indicator designed for traders who value precision over noise. The indicator generates signals only after candle close , completely eliminating repainting and false entries. It combines multiple proven technical tools into one robust decision-making system, delivering clean, high-quality buy and sell signals directly on the chart. RSI Thunder integrates RSI, EMA, ADX, and ATR , reinforced by a strict SMA40 trend-direction filter to ensure trades
ScalpPoint
Temirlan Kdyrkhan
ScalpPoint is a powerful trading companion designed to generate high-probability entry signals with dynamic TP/SL/DP levels based on volatility. Built-in performance tracking shows win/loss stats, PP1/PP2 hits, and success rates — all updated live. Key Features: Buy/Sell signals with adaptive volatility bands Real-time TP/SL/DP levels based on ATR Built-in MA Filter with optional ATR/StdDev volatility Performance stats panel (Success, Profit/Loss, PP1/PP2) Alerts via popup, sound, push, or emai
The Oracle Pro
Ottaviano De Cicco
5 (1)
The Oracle Pro: Synthetic Multi-Timeframe Bias Engine for MT5 The Oracle Pro is a premium multi-timeframe bias engine for MetaTrader 5, built for demanding and professional traders. It answers one question with discipline: what is the directional bias on each timeframe right now, how strong is it, and how much do the timeframes agree? Everything is computed on closed bars only - no repainting. The Oracle Pro is a multi-factor consensus system. It combines proprietary indicators and optimized alg
AriFocus
Temirlan Kdyrkhan
AriFocus - Non-Repainting Buy/Sell Signals AriFocus - one clear signal. AriFocus marks buy and sell signals directly on the chart and suggests a stop-loss level for each one. Every signal is confirmed on bar close and never repaints. - Buy/sell arrows, confirmed on bar close - Suggested stop-loss level for every signal - Trend band and candle coloring to show direction at a glance - 10 ready-made presets, or your own settings (14 calculation methods) - Pop-up, push and email alerts with entr
Boom Crash GainX PainX Spike Detector Overview Boom Crash GainX PainX Spike Detector is a professional analytical indicator for Deriv synthetic indices. It is designed to identify potential spike opportunities using multiple technical indicators, price movement analysis, and tick-based cycle monitoring. The indicator supports both market directions in one tool: Boom and GainX: BUY signals for potential upward spikes. Crash and PainX: SELL signals for potential downward spikes. The indicator auto
More from author
The Liquidation Zones Heatmap is a custom technical indicator designed for the MetaTrader 4 (MT4) platform. It calculates and visualizes estimated liquidation zones based on price action and internal algorithms, displaying them as a dynamic heatmap on the chart. These zones are known by several names, sometimes referred to as liquidity pools, liquidity levels, leverage levels, liquidation heatmap levels, leverage heatmap zones, or leverage heatmap levels. These zones represent potential areas of
Auto Elliott Engine The Auto Elliott Engine is a tool designed for MetaTrader 4 that automates the identification, decomposition, and projection of price structures based on the Elliott Wave Theory. Powered by a pattern-recognition engine, this indicator processes price action to identify market configurations, translating data into structured scenarios. Key Features Multi-Degree Recognition: Analyzes price action across multiple fractal levels. From higher degrees, such as Supercycle or Cycle,
Elliott Wave Engine The Auto Elliott Engine is a tool designed for MetaTrader 5 that automates the identification, decomposition, and projection of price structures based on the Elliott Wave Theory. Powered by a pattern-recognition engine, this indicator processes price action to identify market configurations, translating data into structured scenarios. Key Features Multi-Degree Recognition: Analyzes price action across multiple fractal levels. From higher degrees, such as Supercycle or Cycle,
The Smart Liquidation Clusters  is a custom technical indicator designed for the MetaTrader 4 (MT4) platform. It calculates and visualizes   estimated liquidation zones   based on price action and internal algorithms, displaying them as a dynamic heatmap on the chart. These zones are known by several names, sometimes referred to as liquidity pools, liquidity levels, leverage levels, liquidation heatmap levels, leverage heatmap zones, or leverage heatmap levels. These zones represent   potential
The   Smart Liquidation Clusters    is a custom technical indicator designed for the MetaTrader 5 (MT5) platform. It calculates and visualizes   estimated liquidation zones   based on price action and internal algorithms, displaying them as a dynamic heatmap on the chart. These zones are known by several names, sometimes referred to as liquidity pools, liquidity levels, leverage levels, liquidation heatmap levels, leverage heatmap zones, or leverage heatmap levels. These zones represent   potent
SMC Framework Pro
Enrique Gauto Sand
SMC Framework Pro is a technical analysis indicator developed for the MetaTrader 5 platform. It integrates multiple tools commonly associated with Smart Money Concepts (SMC) into a single environment, focusing on the visualization of price action, market structure, and selected price patterns. The indicator processes historical and incoming price data to identify structural points, price imbalances, and recurring formations. Its purpose is to assist in chart analysis by organizing this informati
SMC Pattern Detector  is a technical analysis tool based on  Smart Money Concepts (SMC) . This indicator automates the identification of market structure, supply/demand zones, and SMC patterns. Built on a  No-Repaint  architecture, all signals are confirmed on closed bars. We believe in 100% transparency. Don't just rely on screenshots; watch how the indicator reacts to real-time market conditions. Check out our recorded live streams to see the scalping setups and signals as they happen. Watch t
Elliott Wave ABC
Enrique Gauto Sand
Elliott Wave ABC  Overview Elliott Wave ABC is an interactive indicator designed for MetaTrader 5 (MT5) that automates the detection, scoring, and visualization of Elliott Wave Zig-Zag (A-B-C) structures. It scans chart data to locate both completed and incomplete Zig-Zag patterns, offering structural analysis, Fibonacci projection targets, and a stacked dual-panel user interface. This Elliott Wave indicator is only focused an ABC - Zig-Zag Pattern. --- Key Features 1. Automated Zig-Zag D
Crypto Liquidation Zones is a technical visualization tool designed for MetaTrader 5 that attempts to estimate and display theoretical liquidation areas on the chart. Based on historical price extremes and user-defined leverage levels, the indicator models where leveraged market participants could potentially face stop-outs or liquidation thresholds, representing these zones via a dynamic on-chart heatmap overlay. WHAT IT DOES  - Theoretical Zone Estimation: Derives estimated liquidation pri
Gold Liquidation Momentum is a premium, volume and momentum indicator specifically optimized for Gold (XAUUSD) , Forex, and major Indices. It analyzes price-action dynamics and tick volume to model hypothetically the momentum of different market participants and visualizes hypothetically  buyer/seller dominance in real-time. How It Works The indicator tracks market volume across 5 distinct leverage tiers (100x, 50x, 35x, 25x, and 10x). Using an advanced mathematical decay formula tailored for no
Astro Gann Cycles
Enrique Gauto Sand
Overview Astro Gann Cycles is an analytical timing indicator for MetaTrader 5 inspired by interpretations of W.D. Gann's work. Astro Gann Cycles tries to calculates planetary positions directly within MetaTrader to identify repeating astronomical configurations. By analyzing the celestial backdrop associated with major market highs and lows, the indicator models hypothetical cycle waves that could help anticipate potential timing windows where market turning points might occur. Important Note :
Astro Gann Intraday Astro Gann Intraday is an technical timing tool developed for MetaTrader 5 that maps hypothetical short-term astronomical cycles onto intraday price charts (M1 to H1). Inspired by W.D. Gann's work, the tool tries to   examine real-time celestial coordinates—primarily the Moon's movement, fast planetary positions, and local diurnal rotation angles—to help traders study potential harmonic timing windows. Overview Astro Gann Intraday  focus exclusively on fast-moving celestial b
Filter:
No reviews
Reply to review