Hurst Cycles MT5
- Индикаторы
- Версия: 1.0
- Активации: 5

Overview
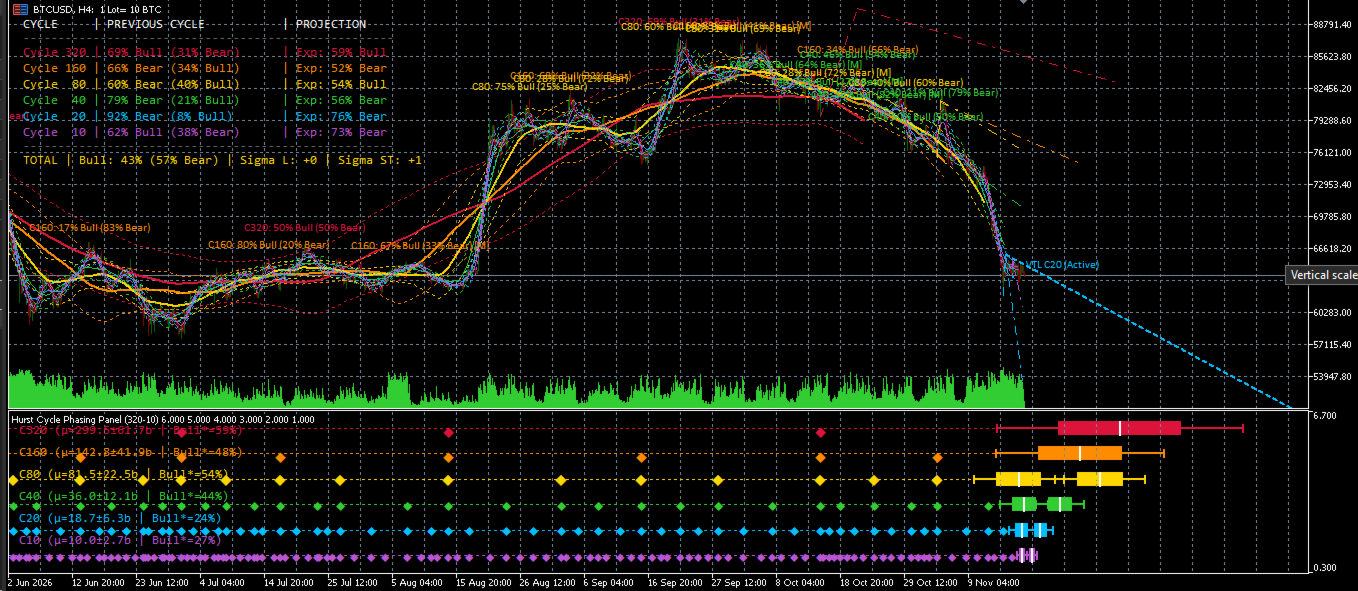
Hurst Cycles MT5 is a technical analysis indicator for MetaTrader 5 designed for Hurst cycle analysis using Centered Moving Average (CMA) envelopes across six harmonic periods (10, 20, 40, 80, 160, and 320 bars). It provides 2:1 harmonic trough synchronization, cycle bullishness/bearishness metrics, Valid Trend Line (VTL) and cycle projections.
Key Features
- Multi-Cycle CMA Envelopes (10–320): Displays six nested CMA center lines and standard deviation bands on the main chart (with optional toggles to hide them).
- 2:1 Harmonic Synchronization: Aligns cycle troughs across all six timeframes from the largest cycle (320) down to the shortest cycle (10).
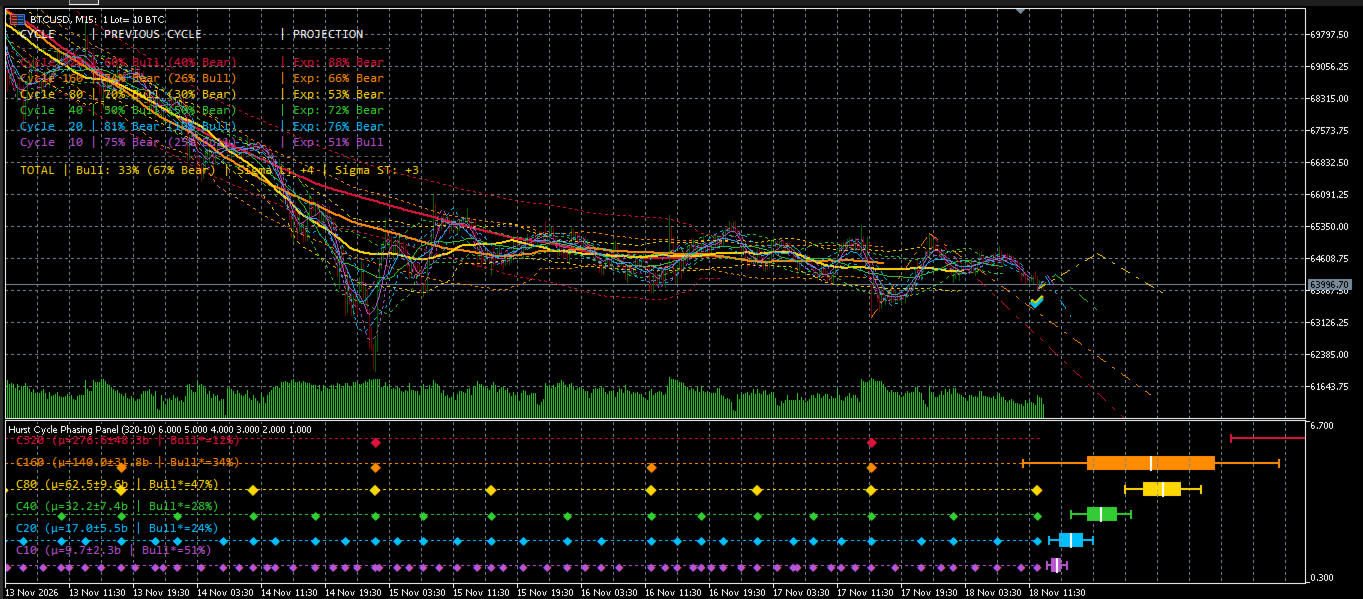
- Bullishness & Bearishness Dashboard: Summarizes the previous completed cycle percentages, expected bias, overall bullishness, and Sigma L / Sigma ST timing metrics in an on-chart table.
- VTL & Mid-Channel Pause Detection: Identifies triangular consolidation pauses, draws active/broken VTLs, and marks validated early troughs.
- 4-Variable Projections & Phasing Sub-Panel: Projects expected cycle peaks and troughs in both price and time, alongside an optional separate sub-panel showing stacked cycle diamonds and box-whisker timing windows.
Input Parameters
-
Max history bars to analyze
Sets the maximum number of historical bars used to compute envelopes and cycle structures. -
Standard deviation multiplier for CMA envelopes
Controls the width of the upper and lower CMA channel bands; used both for chart visualization and internal calculations. -
Forward trough search tolerance (+/- %)
Defines the percentage search window around each expected cycle period when locating cycle troughs. -
Number of cycles (~12 troughs) for mean & std dev
Sets how many recent completed cycles are used to calculate average cycle duration and standard deviation for timing projections. -
Auto-adjust mixed cycles (M-shape) & inconsistencies
Enables automatic adjustment of mixed M-shaped cycle structures and post-low triangle pivots. -
Auto-attach separate diamonds & boxes sub-panel
Automatically attaches the companion phasing sub-panel below the main chart to display stacked cycle diamonds and statistical timing boxes. -
Hide CMA center lines
Hides the six CMA center lines from the main chart while keeping internal cycle calculations active. -
Hide CMA channels (upper/lower bands)
Hides the upper and lower CMA envelope bands from the main chart while keeping internal cycle calculations active. -
Show diamonds on main chart (false = sub-panel only)
Toggles whether cycle trough diamonds and timing whisker boxes are also drawn directly on the main price chart. -
Show cycle labels on candles (false = top table only)
Displays bullishness/bearishness percentage labels above recent cycle peaks on the price chart. -
Show bullishness sync check marks (✔) on candles
Displays check marks on candles where early or pre-CMA troughs are validated. -
Project 4 variables (Peak & Trough in Price/Time)
Draws the cycle projection lines in both time and price directly on the main price chart/price axis (from the active trough to the projected peak and next projected trough). -
Show Mid-Channel Pause triangles, VTL & early troughs
Displays detected mid-channel pause structures, VTL trend lines (active or broken), and associated early trough markers. -
Show top-left table (true = Visible, false = Hidden)
Shows or hides the summary dashboard table in the top-left corner of the chart. - Table background (Transparent or Opaque Black)
Selects between a transparent background or a solid black background for the dashboard table.
Risk & Analytical Disclaimer: For educational and technical analysis purposes only—not investment or trading advice. Hurst Cycle analysis is speculative; by their mathematical nature, these cycles and indicator repaint and adjust dynamically with new price action. Trade at your own risk.