
GoldGridBot Multi Timeframe Dashboard
- Indicators
-
Dennis Hoinkis
 MT5Bots – Expert Advisors for MetaTrader 5 with published backtests
- Version: 1.0
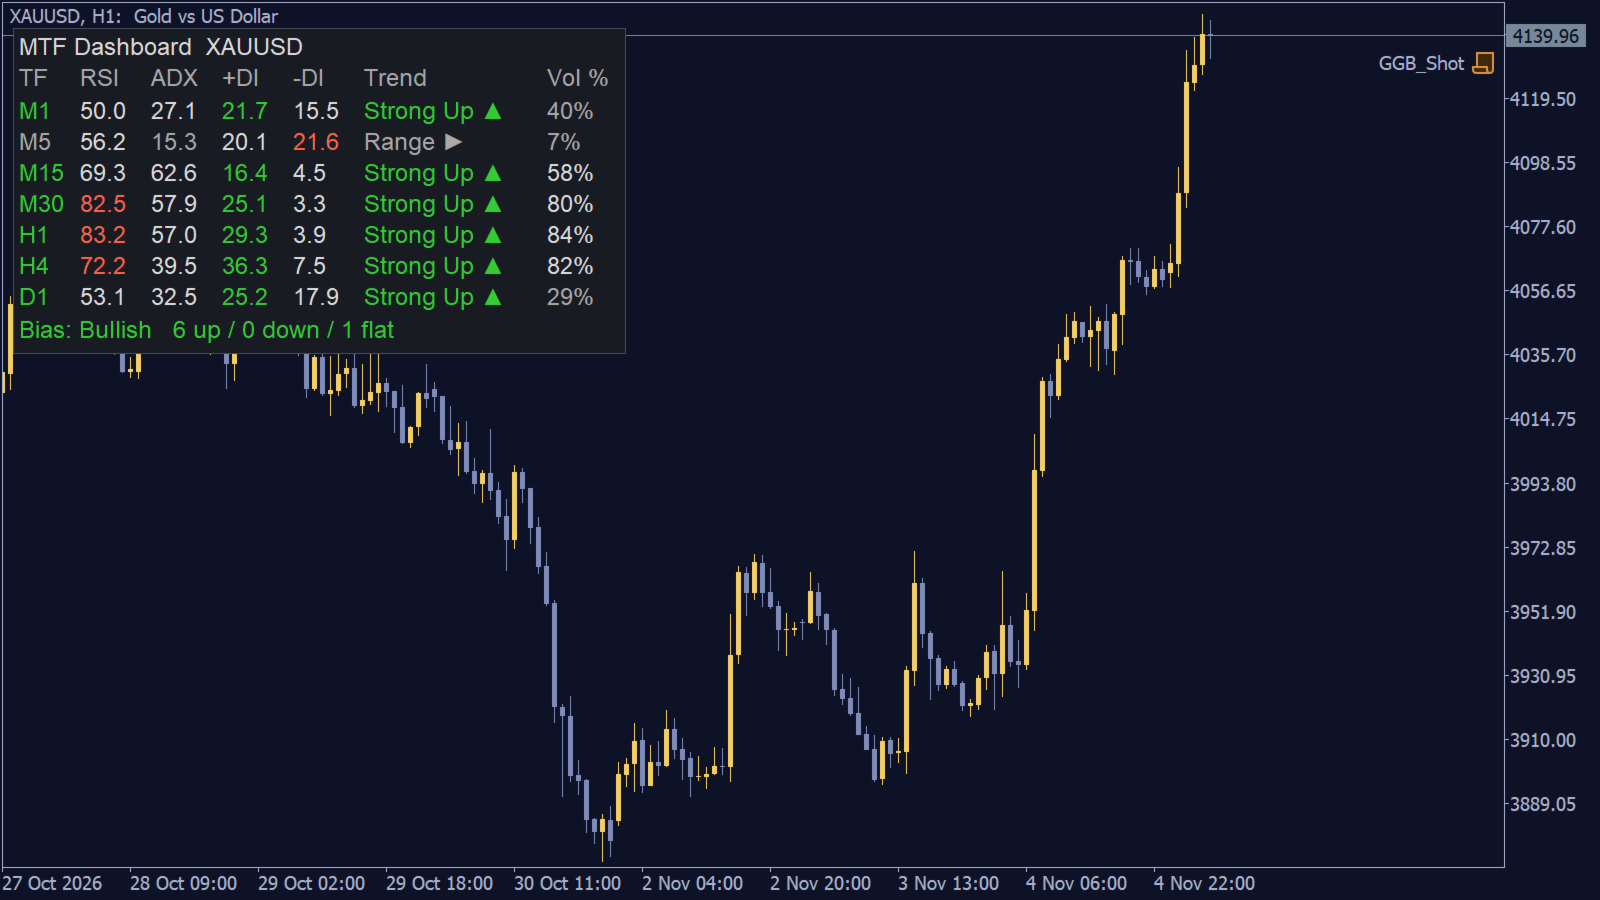
MTF Dashboard RSI ADX Volume is a compact panel in the main chart window that shows RSI, ADX and relative tick volume for several timeframes of the current symbol at once.
Main features
- One row per enabled timeframe: M1, M5, M15, M30, H1, H4 and D1 by default.
- Columns TF, RSI, ADX, +DI, -DI, Trend and Vol %.
- The timeframe name is colored by its bias: bullish when +DI is above -DI and RSI is above 50, bearish when -DI is above +DI and RSI is below 50, neutral otherwise.
- Trend column: "Strong Up" or "Strong Down" when ADX is above the threshold, otherwise "Range".
- Relative volume: tick volume of the forming bar as a percentage of the average of the previous closed bars.
- A Bias row counts bullish, bearish and flat timeframes and labels the overall picture as Bullish, Bearish or Mixed.
- Timer-based refresh, so the values stay current even when no new ticks arrive.
How to read it
The panel is an overview, not a signal generator. When most rows are bullish and the higher timeframes show "Strong Up", the market is moving in one direction. A mix of "Range" rows and a Mixed bias describes a market without a clear direction. RSI is shown in the bearish color at or above the overbought level and in the bullish color at or below the oversold level. Relative volume shows whether the current bar is unusually active or quiet compared to recent bars.
Main inputs
- Show M1 to Show D1: enable or disable each row.
- RSI period (14), applied price (Close), overbought level (70), oversold level (30).
- ADX period (14) and strong trend threshold (25).
- Average volume period (20 bars), high relative volume (150 %), low relative volume (50 %).
- Refresh interval (1 second).
- Panel corner (upper left), X and Y offset, font, colors and object name prefix.
Notes and limitations
- Works on any symbol and any chart timeframe; the chart timeframe does not need to be in the list.
- The current bar is still forming, so relative volume starts low and grows during the bar.
- While history for a timeframe is loading, the cells show "..." and fill in automatically.
- Change the object name prefix if you run more than one copy on the same chart.
- No DLLs or external resources are used. All objects and indicator handles are removed together with the indicator.
This tool does not trade.


























User didn't leave any comment to the rating