SkyBreak
- Experts
- Version: 1.4
- Activations: 15

SkyBreak trades gold's breakouts in the first seconds. It waits with stop orders at the prices where gold tends to break, and the move itself fills them. Every position has a stop loss from the moment it opens. There is no martingale, no grid and no averaging down, and the lot is never raised after a loss.
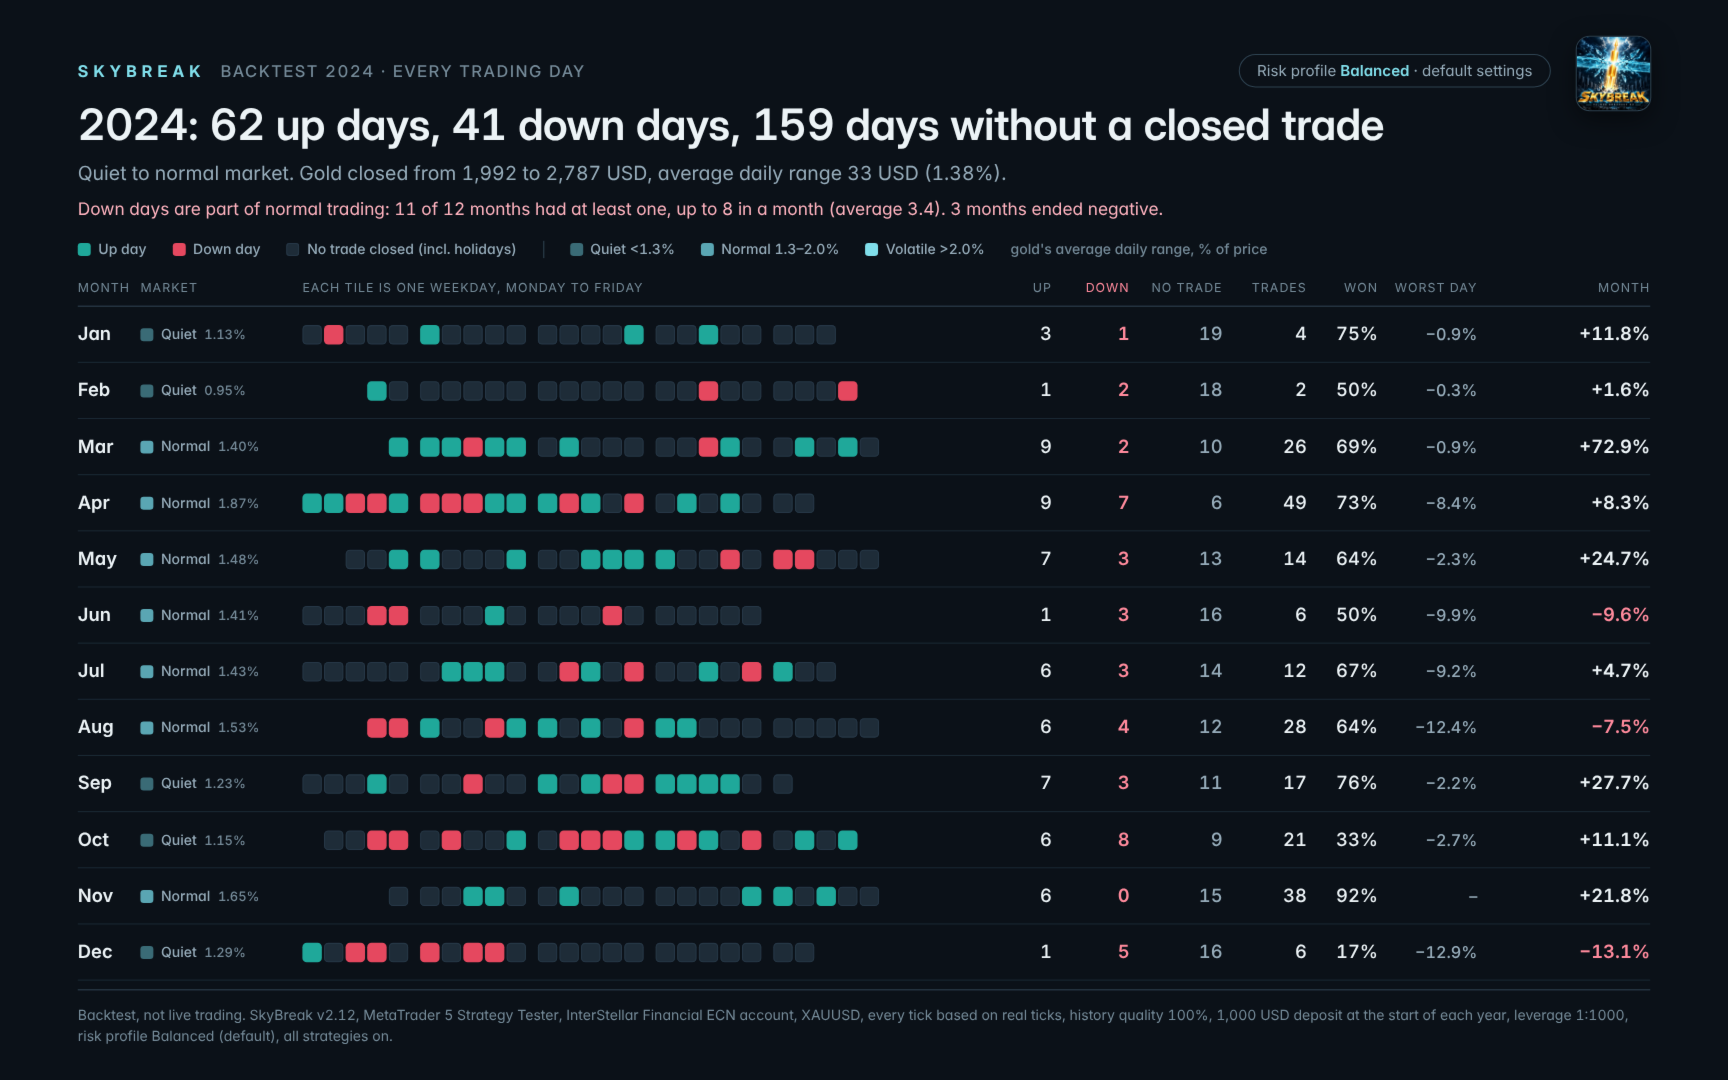
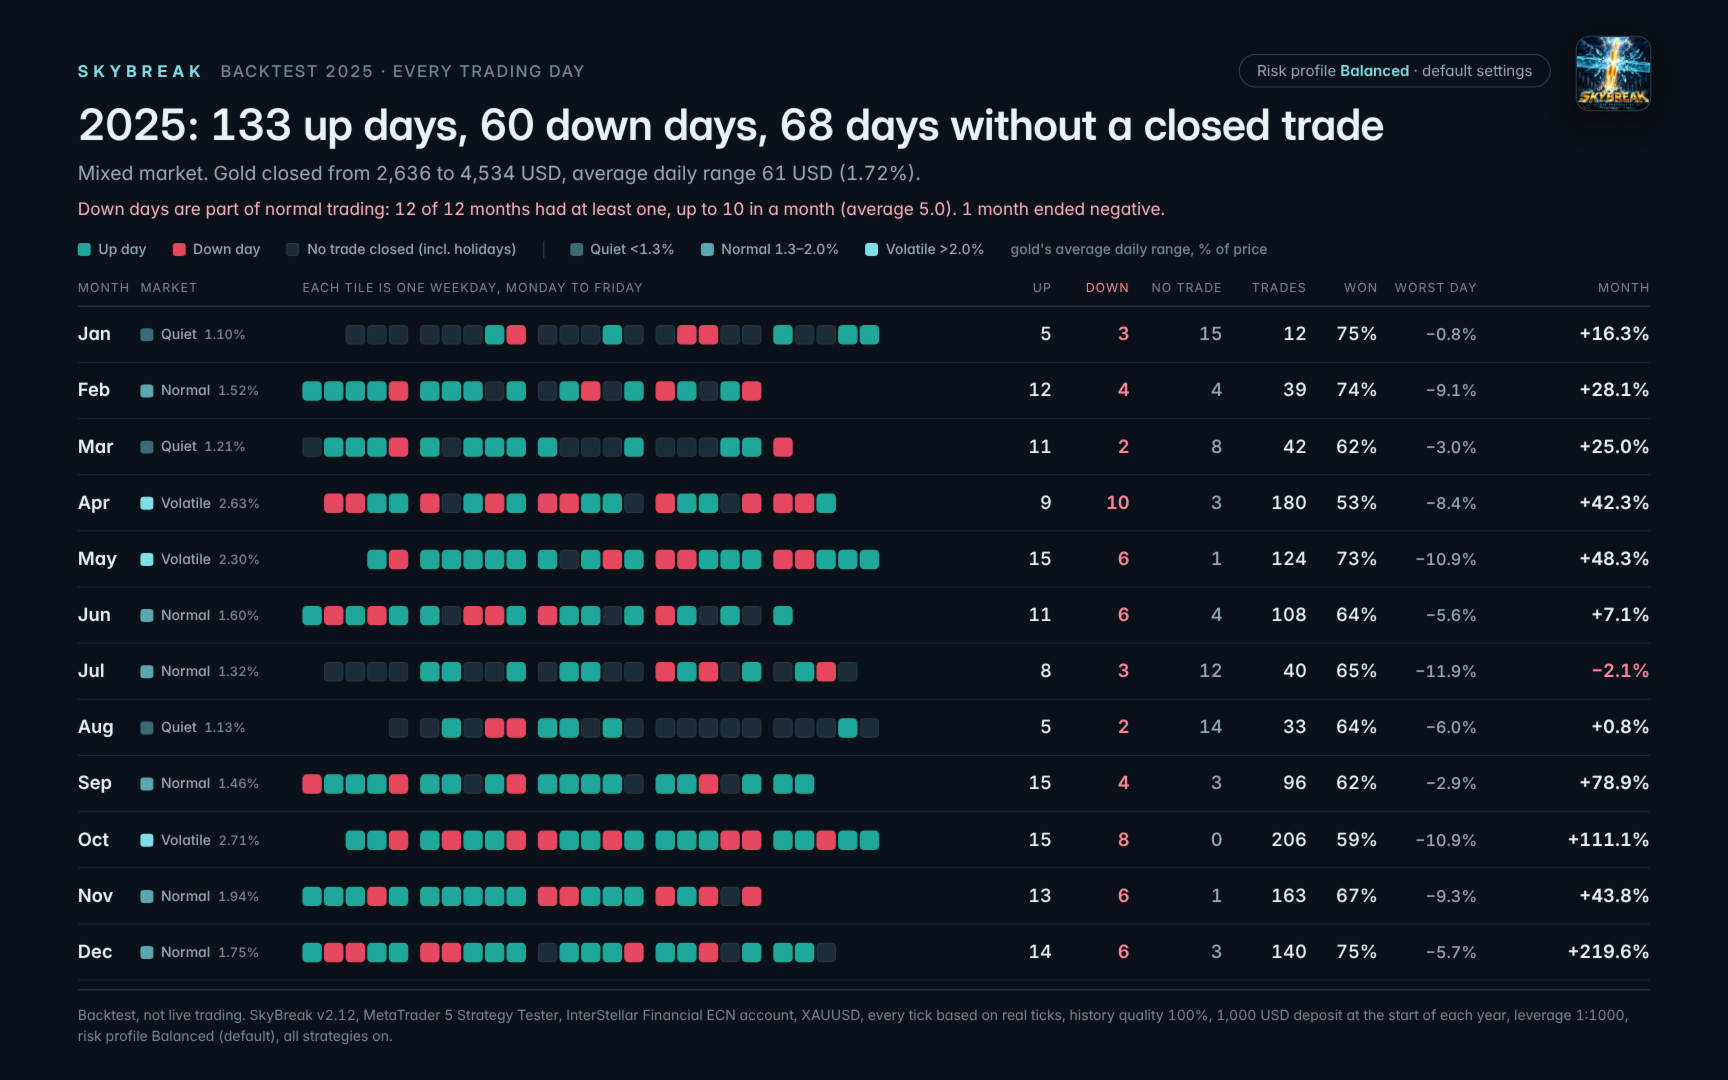
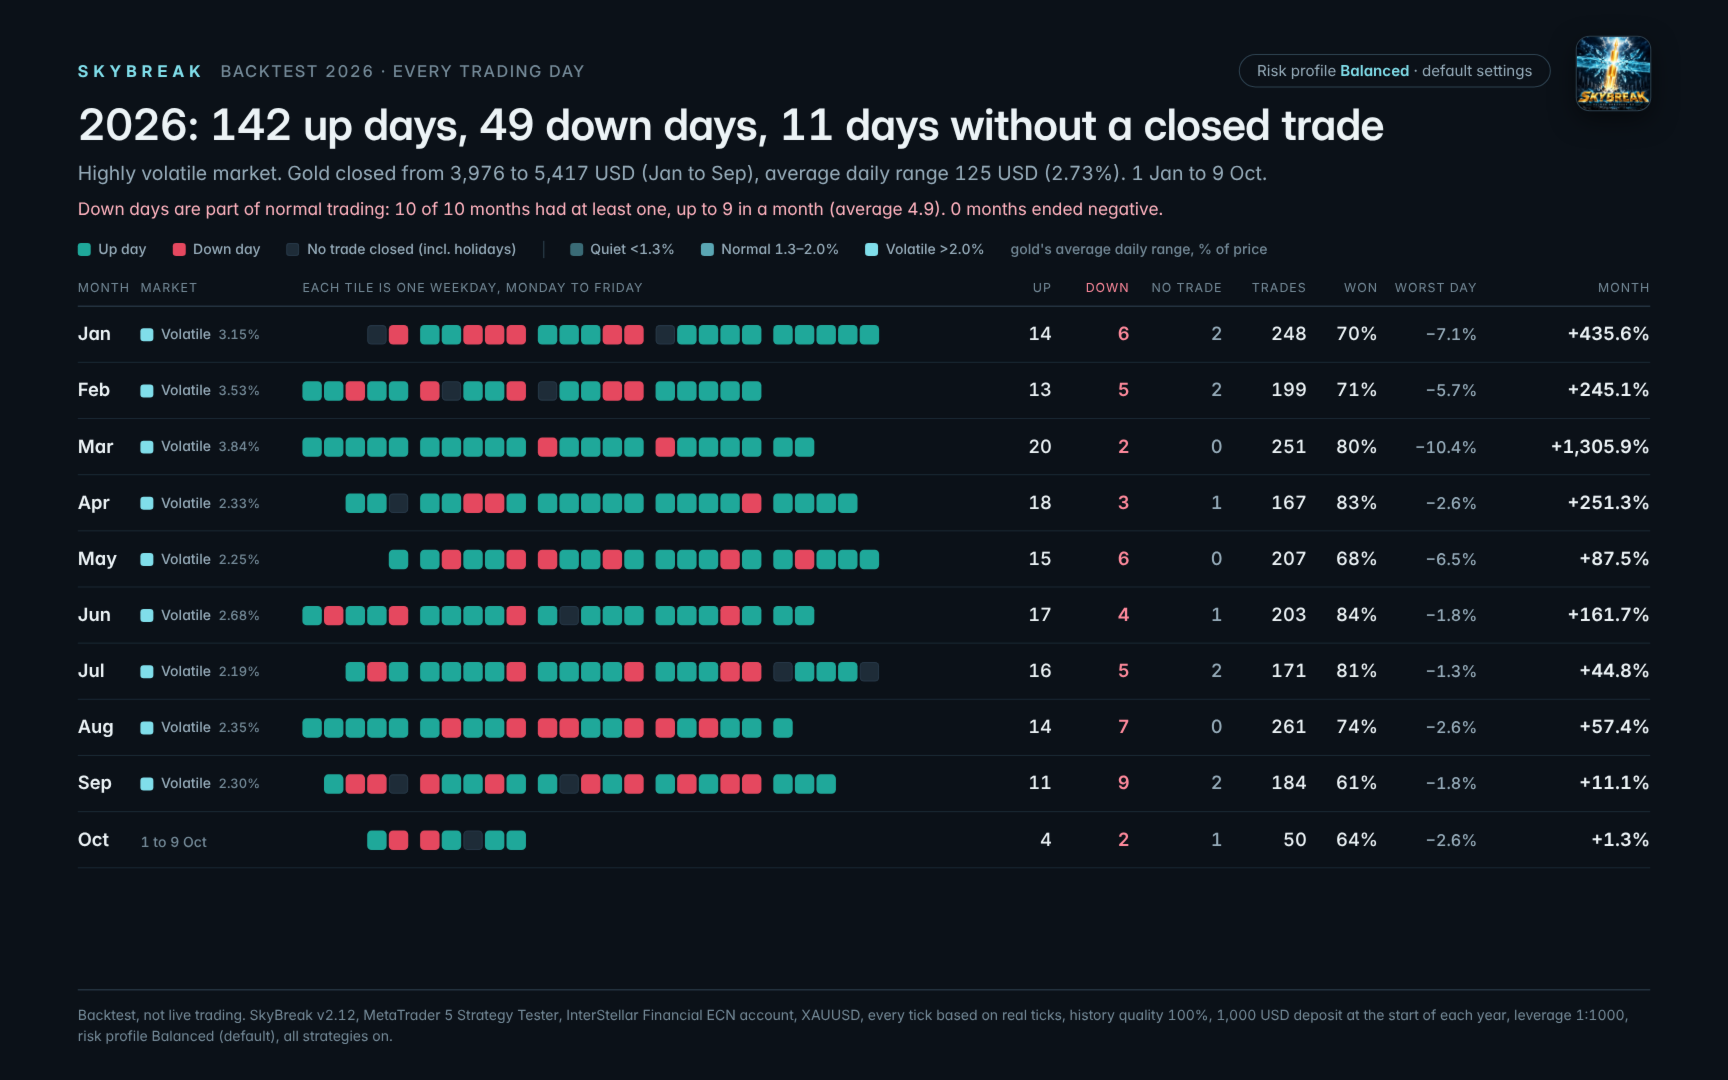
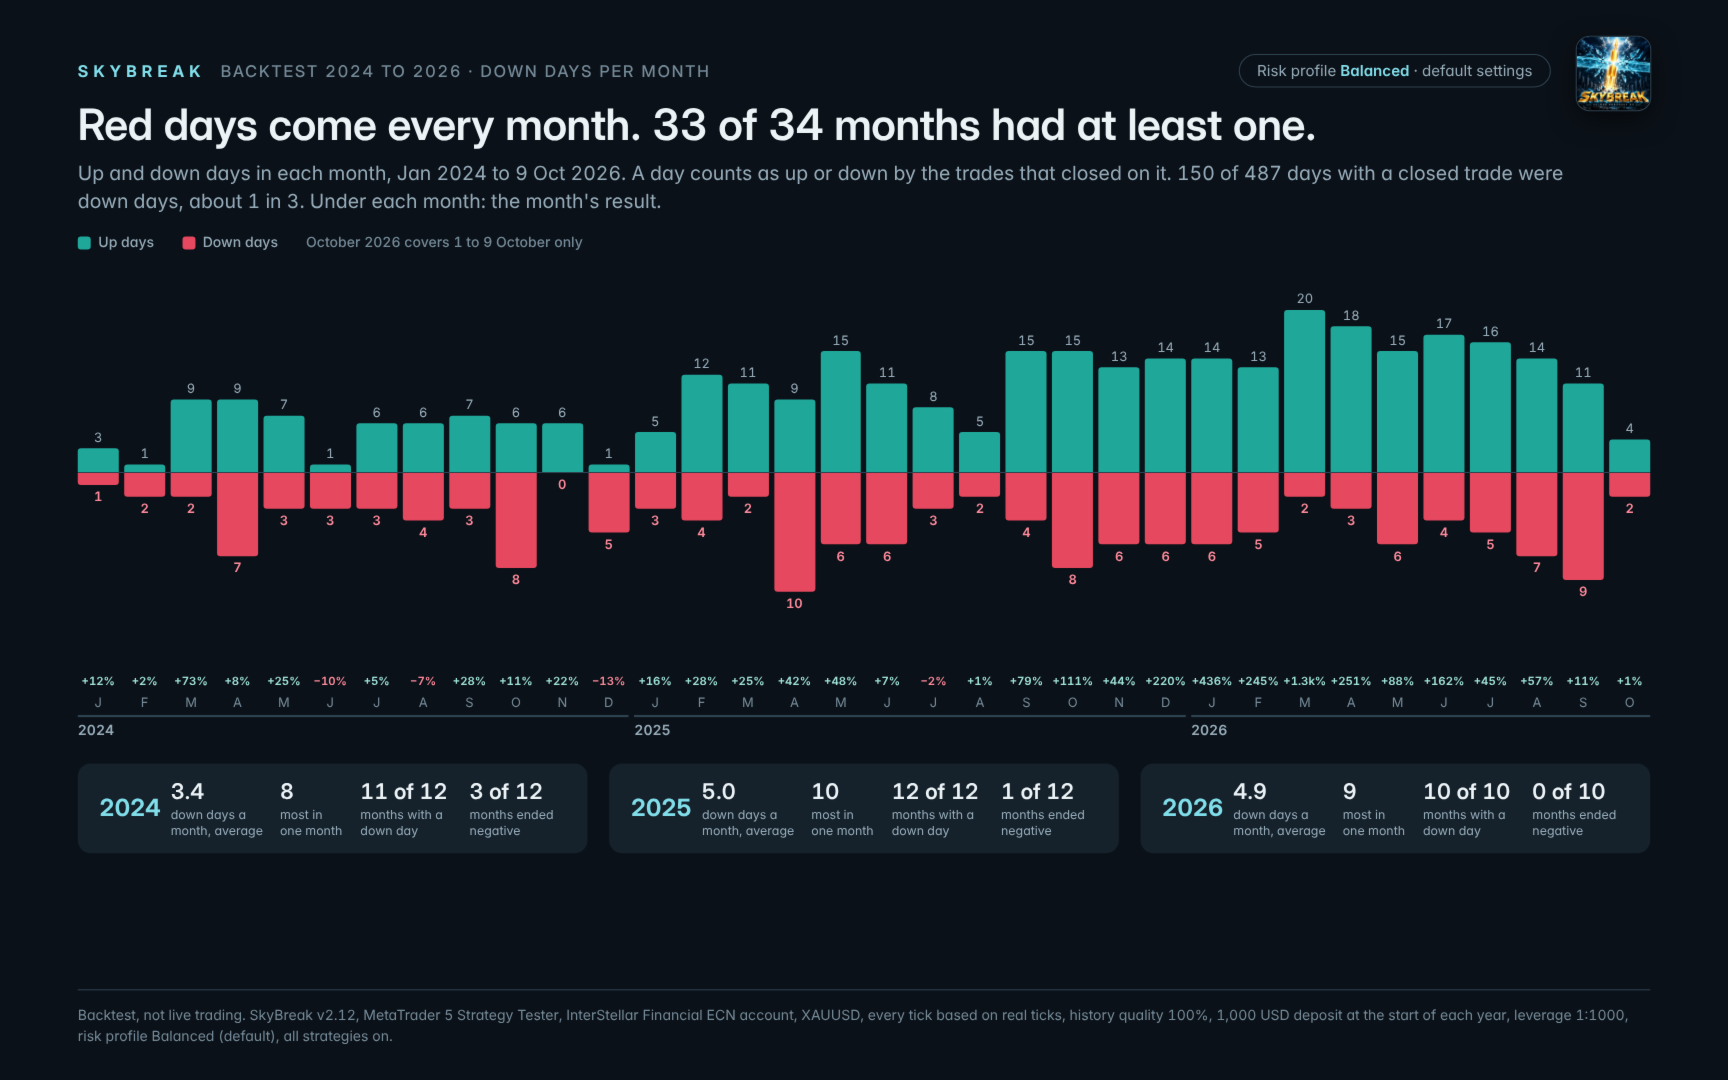
It wins most trades and most months, and it loses on about one trading day in three. This page shows both, with figures taken from every trading day of three years of backtests. Read What losing feels like before you buy. If days like those would make you switch the EA off, SkyBreak is not for you.
Key facts
| Symbol | XAUUSD (gold) only |
| Chart timeframe | Any. The EA reads the timeframes it needs by itself. |
| Strategies | Level, Spike and Trend. Each one can be switched off. |
| Stop loss | On every position from the moment it opens |
| Lot size | Set by the stop loss and your risk profile, or a fixed lot. Never raised after a loss. |
| Account | Hedging only; the EA will not start on a netting account. Raw spread or ECN recommended. |
| Leverage | Tested at 1:1000. Use 1:500 or more. Below that, the margin checks may shrink or skip orders that the backtests filled. |
Three strategies, one breakout idea
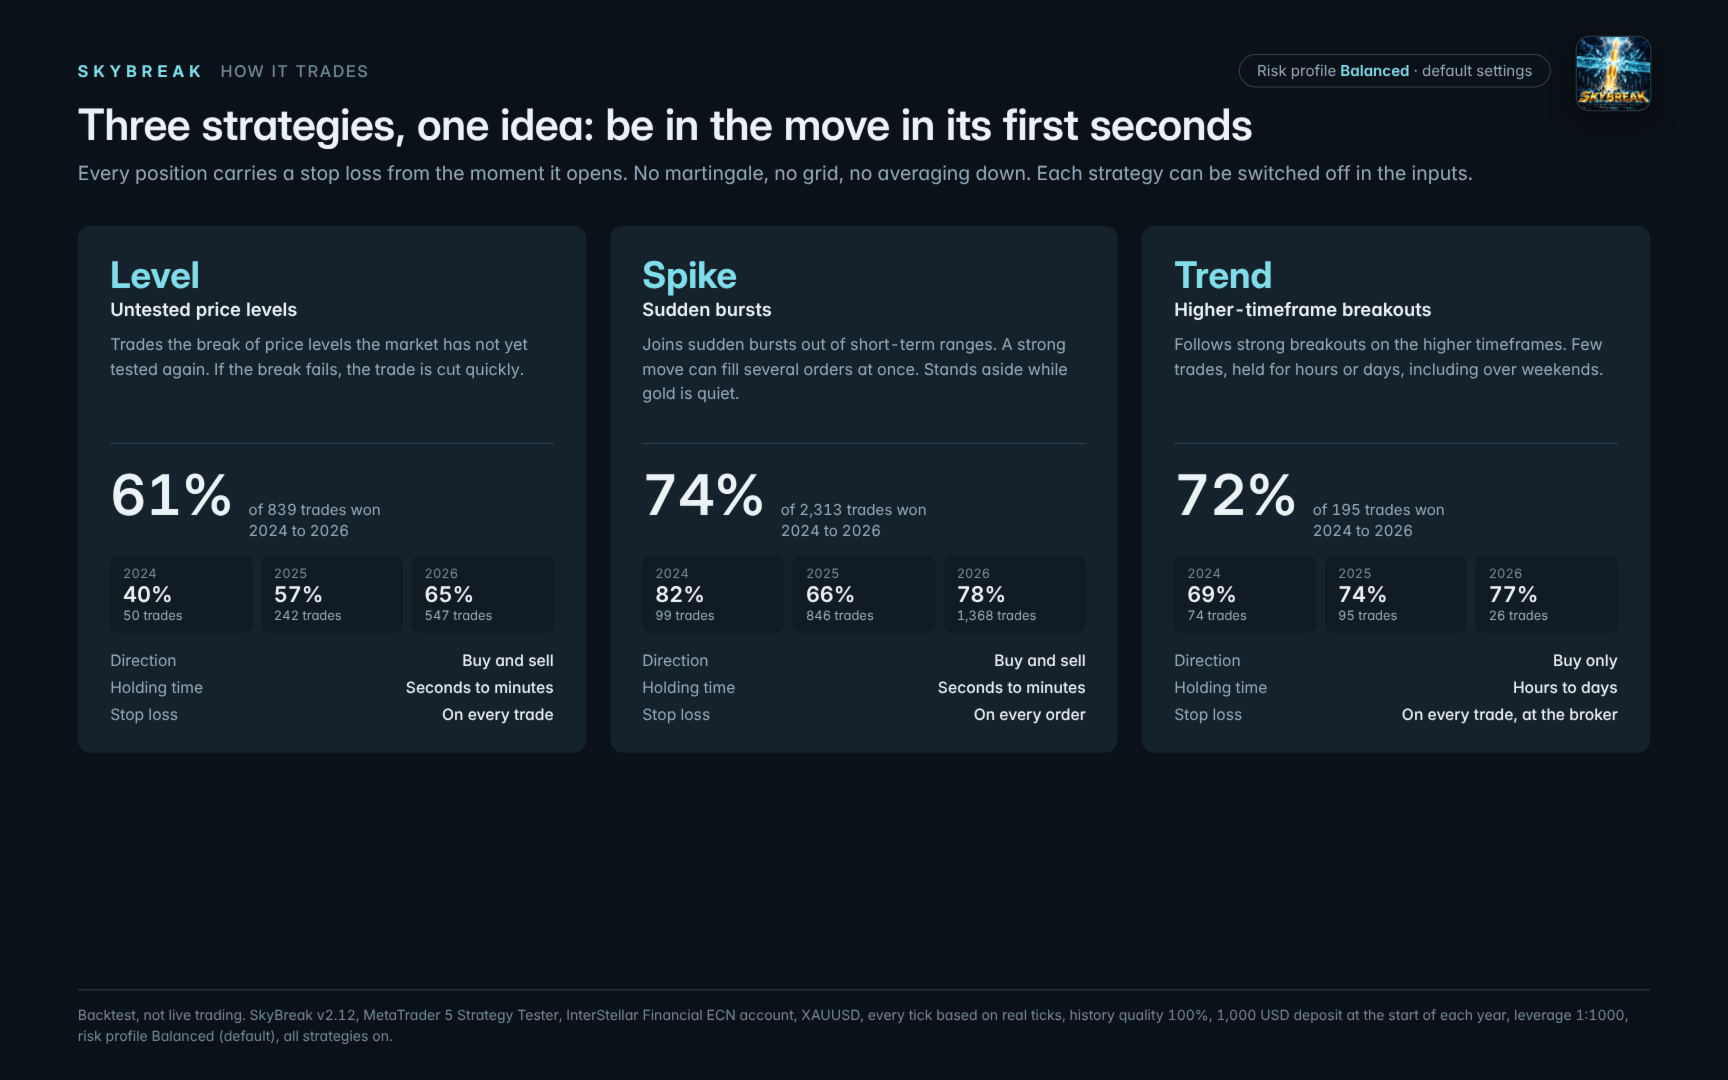
Gold does not drift through important prices. It either rejects them or breaks them hard. SkyBreak waits with stop orders where a break is likely and only takes part when the move actually happens. If the break fails, the trade is cut quickly.
| Level | Spike | Trend | |
|---|---|---|---|
| Idea | Trades the break of price levels the market has not yet tested again | Joins sudden bursts out of short-term ranges | Follows strong breakouts on the higher timeframes |
| Direction | Buy and sell | Buy and sell | Buy only |
| Holding time | Seconds to minutes | Seconds to minutes | Hours to days, including weekends |
| Trades 2024 to 2026 | 839 | 2,313 | 195 |
| Won | 61% | 74% | 72% |
Trades and win rates are totals for the three backtest years at Balanced (default). Each strategy can be switched off. When gold is quiet SkyBreak trades very little, and some weeks have no trades at all.
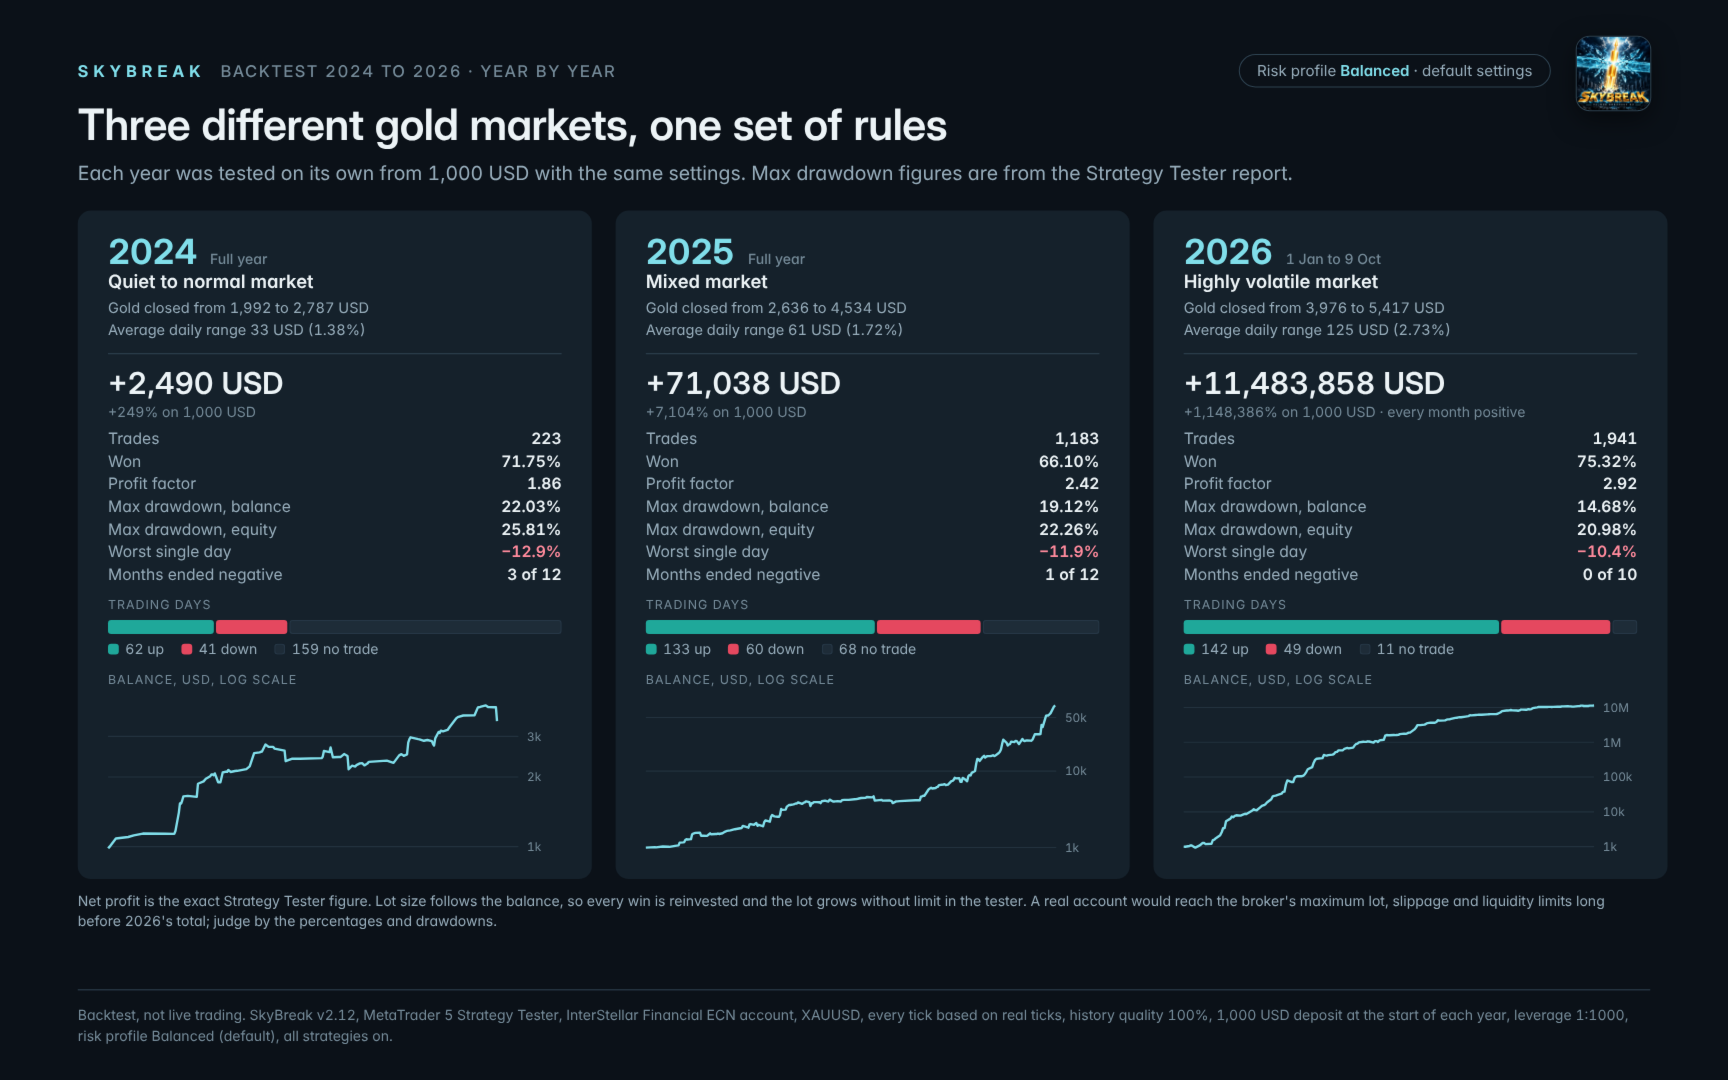
Backtest 2024 to 2026: Balanced (default settings)
| Year | Gold | Trades | Won | Profit factor | Net profit | Max drawdown, balance | Max drawdown, equity | Worst day |
|---|---|---|---|---|---|---|---|---|
| 2024 | Quiet to normal | 223 | 71.7% | 1.86 | +2,490 USD | 22.03% | 25.81% | −12.9% |
| 2025 | Mixed | 1,183 | 66.1% | 2.42 | +71,038 USD | 19.12% | 22.26% | −11.9% |
| 2026 (1 Jan to 9 Oct) | Highly volatile | 1,941 | 75.3% | 2.92 | +11,483,858 USD | 14.68% | 20.98% | −10.4% |
| Tester | MetaTrader 5, every tick based on real ticks, history quality 100% |
| Broker | InterStellar Financial, ECN account |
| Deposit | 1,000 USD at the start of each year, leverage 1:1000 |
| Settings | Default inputs: risk profile Balanced, all strategies on. The same settings in every year. |
Not out-of-sample. The rules were developed on gold data that includes this period. These are backtest results, not live trading results.
Why the 2026 figure is so large. These are the exact figures from the Strategy Tester. Lot size follows the balance, so every win is reinvested, and 2026 was an extremely volatile year for gold. In the tester the lot grew without limit. A real account would hit the broker's maximum lot, slippage and liquidity long before that, so do not expect the dollar total. The monthly percentages and the drawdowns are the realistic guide. Every 2026 month was positive, from +1% to over +1,000%.
What losing feels like
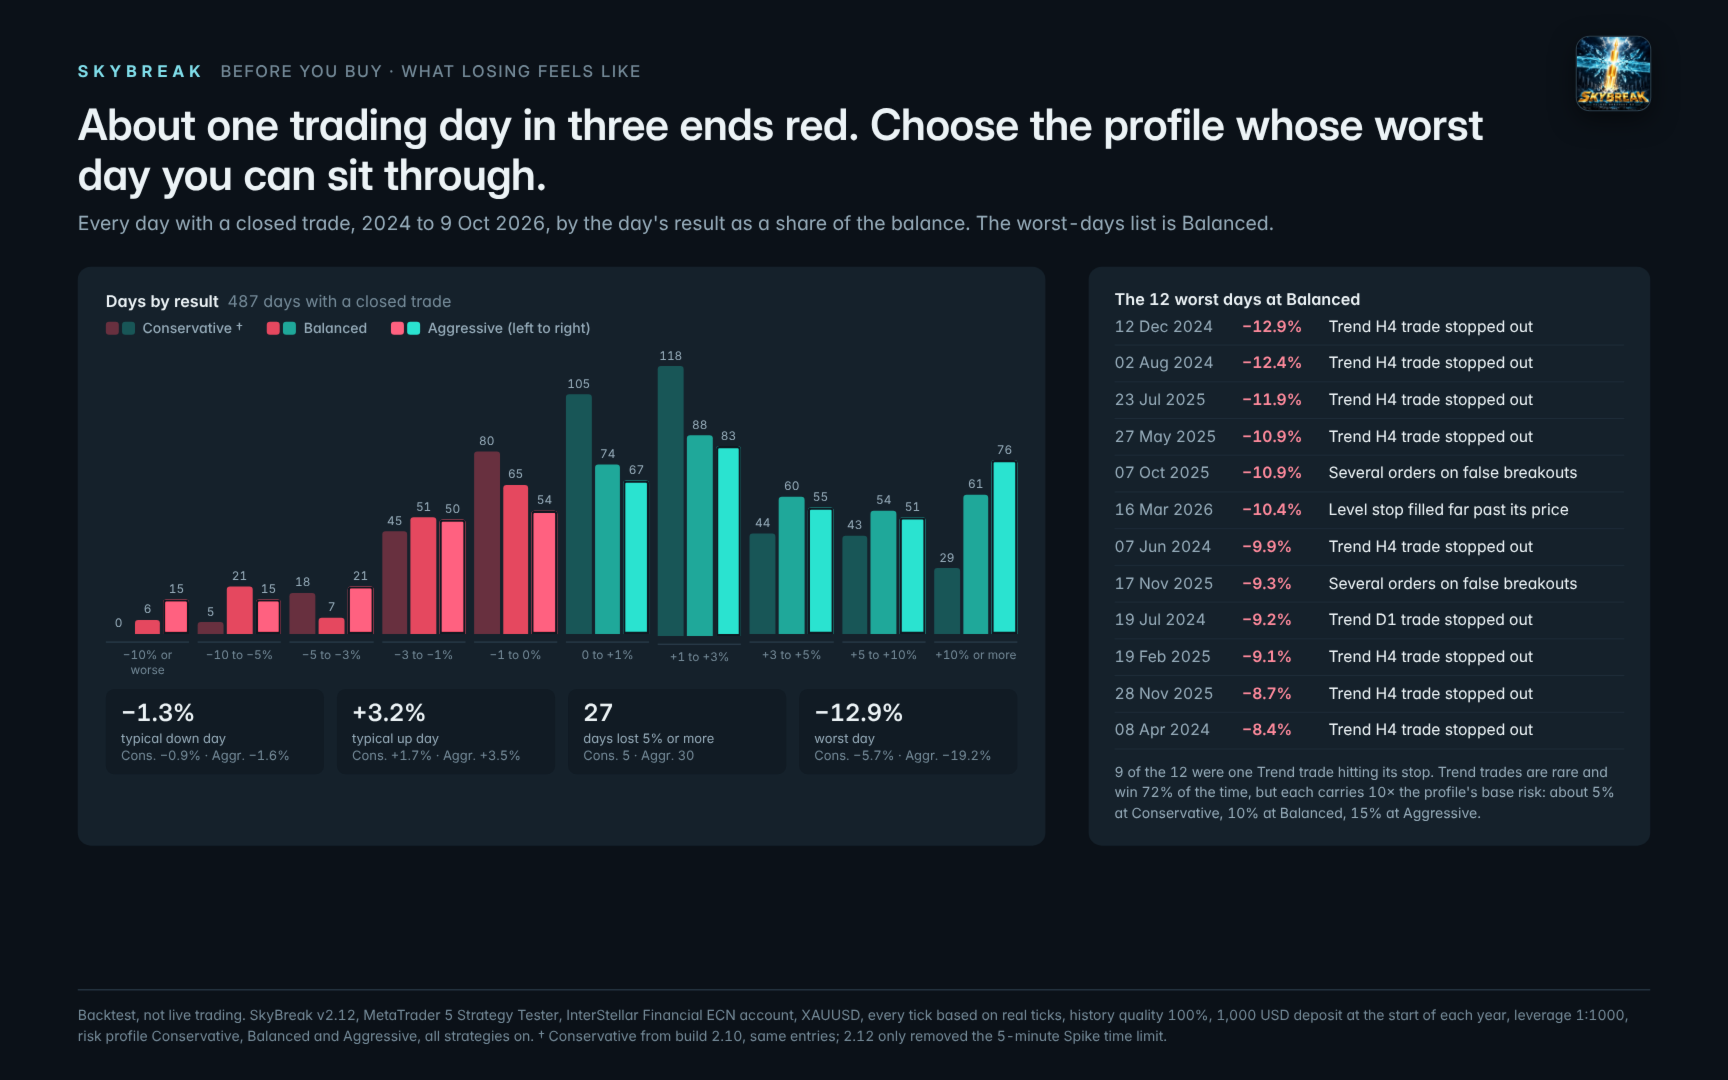
The following figures are from every day of the backtests, 2024 to 9 October 2026, for each risk profile. A day counts as up or down by the trades that closed on it.
| Conservative † | Balanced (default) | Aggressive | |
|---|---|---|---|
| Days with a closed trade that ended down | 148 of 487 (30%) | 150 of 487 (31%) | 155 of 487 (32%) |
| A typical down day (median) | −0.9% | −1.3% | −1.6% |
| A typical up day (median) | +1.7% | +3.2% | +3.5% |
| Days that lost 5% or more | 5 | 27 | 30 |
| Days that lost 10% or more | 0 | 6 | 15 |
| Worst single day | −5.7% | −12.9% | −19.2% |
| Most down days in a row | 5 | 5 | 5 |
| Down days in a month, average and most | 4.4, most 10 | 4.4, most 10 | 4.6, most 10 |
| Months with at least one down day | 33 of 34 | 33 of 34 | 34 of 34 |
| Months that ended negative | 5 of 34, worst −5.5% | 4 of 34, worst −13.1% | 4 of 34, worst −19.4% |
| Longest time without a new balance high | 127 days (2024) | 127 days (2024) | 127 days (2024) |
Where the worst days come from
- A Trend trade stopped out. Trend trades are rare (195 in three years), they win 72% of the time and they are held for hours or days, so each one carries 10 times the profile's base risk. One stopped Trend trade costs about 5% at Conservative, 10% at Balanced and 15% at Aggressive (the worst Aggressive one cost 16.6%). Nine of the 12 worst Balanced days were caused by one.
- Several orders on one false breakout. Level and Spike often fill on the same move: on average 3 positions per move in 2026, and up to 11. When that move reverses, they all lose together. On the worst such day, eight Spike orders on one move lost 9.8% together at Balanced.
- Slippage in a violent move. A stop order can fill far from its price, and so can a stop loss. The worst case in the tests was a Level trade planned to lose 2% that lost 11.2%.
How to stay with it
- Judge it by the month, not the day. In the backtests a red day said nothing about the next one: 68% of the days after a red day were up, against 70% after a green day.
- Choose the profile whose worst day you can watch calmly. If −10% in a day would make you stop the EA, use Conservative. Aggressive has had days of −19%.
- Do not raise the risk after a good month or cut it after a bad week. Switching off after losses and back on after wins locks in the losses.
- If a hard cap helps you stay with it, set Daily loss limit. It was off in these backtests.
Risk is set by your profile
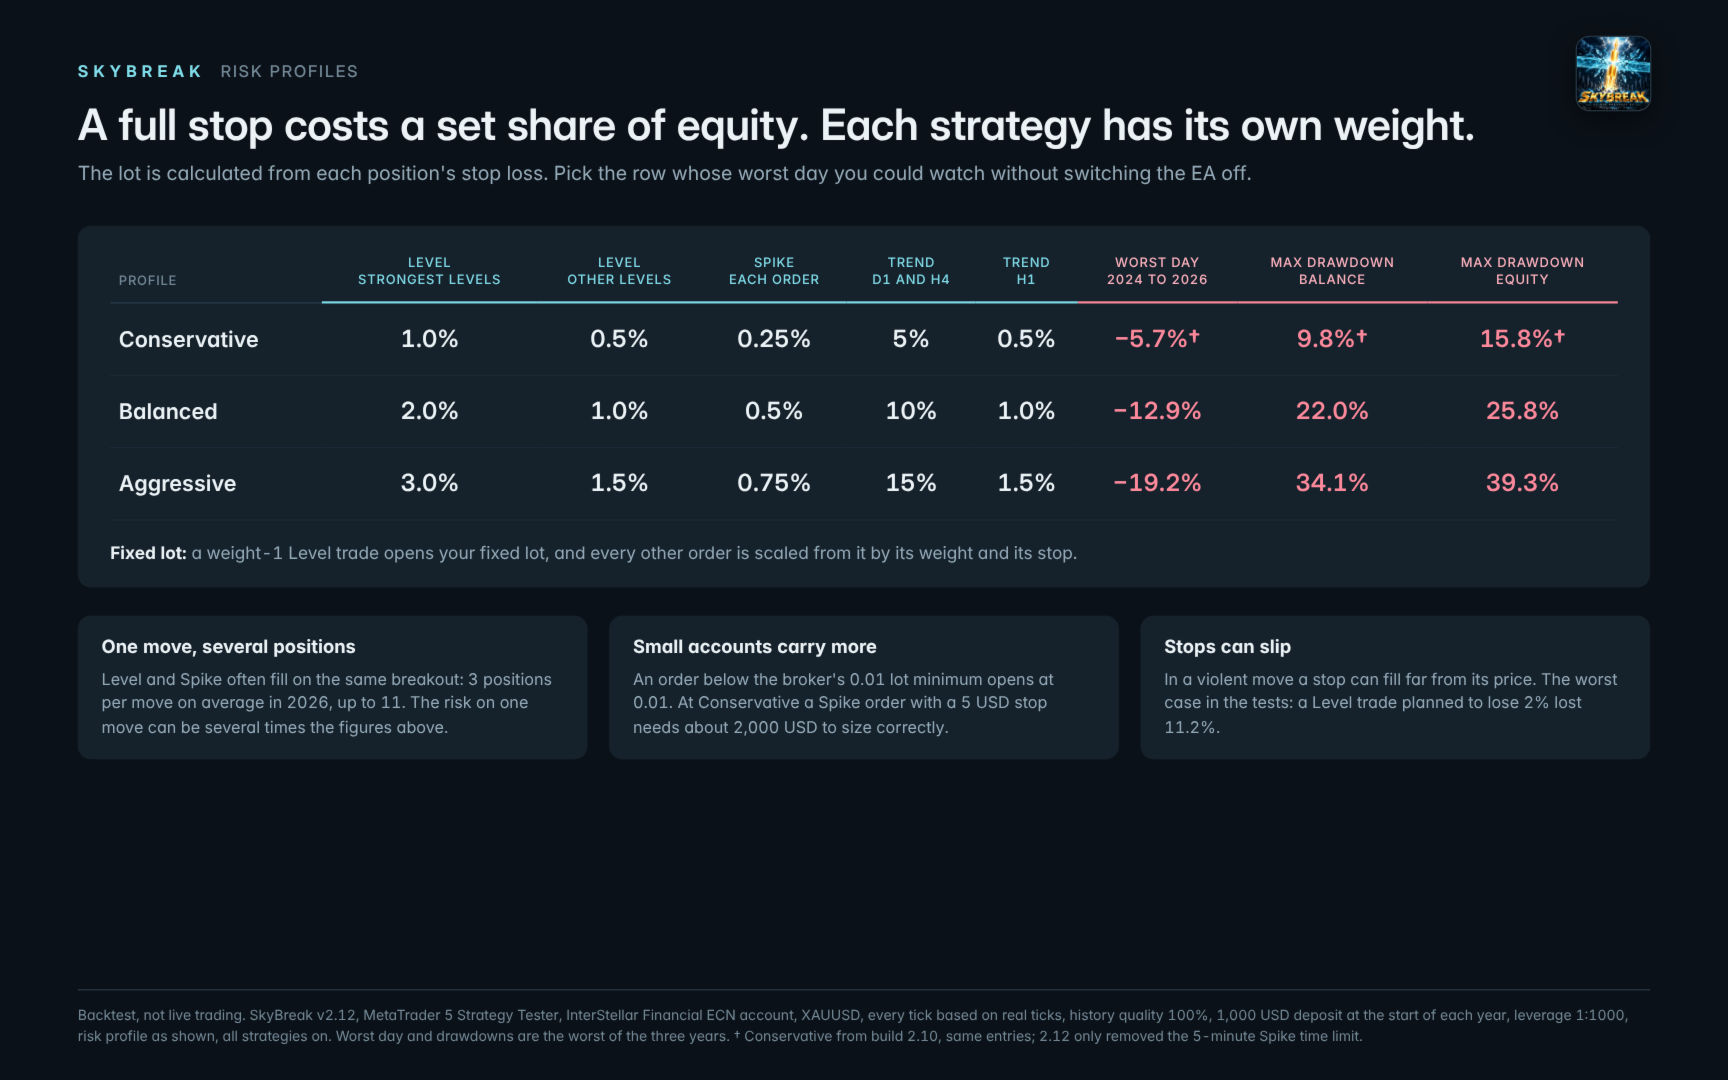
Each lot is calculated from the trade's stop loss, so a full stop costs a set share of equity. Each strategy has its own weight:
| Risk per position | Level, strongest levels | Level, other levels | Spike, each order | Trend D1 and H4 | Trend H1 |
|---|---|---|---|---|---|
| Conservative | 1.0% | 0.5% | 0.25% | 5% | 0.5% |
| Balanced (default) | 2.0% | 1.0% | 0.5% | 10% | 1.0% |
| Aggressive | 3.0% | 1.5% | 0.75% | 15% | 1.5% |
| Fixed lot | A Level trade with weight 1 opens your fixed lot. Every other order is scaled from it by its weight and its stop, so the strategies keep the same balance as in the % profiles. | ||||
- Several positions can open on one move, so the risk on a single breakout can be several times the per-position figure.
- Small accounts carry more risk than stated. An order whose calculated lot is below the broker's 0.01 minimum opens at 0.01. At Conservative, a Spike order with a 5 USD stop needs about 2,000 USD to size correctly.
- Aggressive puts 15% on every Trend trade. Its worst day in the backtests was −19.2% and its worst balance drawdown 34%.
| Conservative backtest † | Trades | Won | Profit factor | Net profit | Max drawdown, balance | Max drawdown, equity | Worst day |
|---|---|---|---|---|---|---|---|
| 2024 | 223 | 71.7% | 2.08 | +871 USD | 9.80% | 13.14% | −5.7% |
| 2025 | 1,207 | 65.3% | 2.33 | +8,330 USD | 9.55% | 10.97% | −5.6% |
| 2026 (1 Jan to 9 Oct) | 1,942 | 74.9% | 2.50 | +547,023 USD | 8.71% | 15.76% | −5.2% |
| Aggressive backtest | Trades | Won | Profit factor | Net profit | Max drawdown, balance | Max drawdown, equity | Worst day |
|---|---|---|---|---|---|---|---|
| 2024 | 220 | 71.8% | 1.72 | +5,393 USD | 34.09% | 39.31% | −19.2% |
| 2025 | 1,153 | 65.6% | 2.54 | +553,716 USD | 27.80% | 31.98% | −17.8% |
| 2026 (1 Jan to 9 Oct) | 1,952 | 75.4% | 3.36 | +19,174,453 USD | 21.41% | 25.20% | −13.7% |
† The Conservative figures come from build 2.10, which takes the same entries. Version 2.12 differs only by removing the 5-minute time limit on Spike trades. Both tables use the same tester settings as the Balanced backtest; only the risk profile is changed.
Live results depend on spread and execution
SkyBreak enters in the first seconds of a fast move. A wider spread, or a fill a few cents from the order price, changes every trade. Live trading will not match the backtest exactly. In our first live weeks with an earlier build, on an account with about 0.17 USD spread, the results were clearly below the tester's for the same dates.
| Live stays closest to the backtest with | The gap grows with |
|---|---|
| Raw spread or ECN account, low commission | Standard or high-spread account |
| VPS close to the broker's server | Home PC, distant server or slow connection |
| Fast, stable execution | Requotes or slow fills |
Before trading live, run the Strategy Tester on your broker's data for the last few weeks, then compare it trade by trade with a demo account over the same dates.
Built-in protections
| Session guard (always on) | Removes pending orders before the daily break and the weekend close, and closes open Spike positions shortly before. It re-arms once quotes are stable and adjusts to the broker's server time by itself. |
| US data pause (always on) | Pulls stop orders around the main US data release each trading day |
| Quiet-market pause | Spike stops placing orders while gold is quiet |
| Spread filter | No new orders while the spread is above your limit (default 30 points = 0.30 USD) |
| Margin checks | No order is sent that the account could not fund at the moment it fills |
| Daily loss limit | Optional. Stops new trades until the next server day. |
| Max drawdown limit | Optional. Stops the EA until it is reloaded. |
| Max open positions | Optional cap |
Trend positions are held over weekends with their stop loss at the broker, so a weekend gap can fill that stop at a worse price.
Recommended setup
- Account: raw spread or ECN, low commission, hedging, leverage 1:500 or more.
- VPS: close to your broker's server.
- Profile: start with Conservative. Move up only once you have lived through a few red weeks.
- One chart: run SkyBreak on one XAUUSD chart per account, with its own Magic number.
- Test first: run the Strategy Tester on your broker's data, every tick based on real ticks.
Inputs
| Group | Input | What it does |
|---|---|---|
| Risk | Risk profile | Conservative, Balanced (default), Aggressive or Fixed lot |
| Fixed lot | The lot of a weight-1 Level trade when Risk profile = Fixed lot | |
| Max open positions | 0 = no limit | |
| Daily loss limit, % of balance | 0 = off | |
| Max drawdown limit, % from equity peak | 0 = off | |
| Close open trades when a limit is hit | true or false | |
| Strategies | Level, Spike, Trend H1, Trend H4, Trend D1 | Switch each strategy on or off |
| Account | Magic number | Identifies this EA's orders (default 260200) |
| Max spread to place orders, points | No new orders above this spread | |
| Display | Show dashboard | Panel on or off |
| Dashboard view, Dashboard size | Standard or Advanced, and its size | |
| Apply chart colours | Applies the SkyBreak chart theme | |
| Show level lines | Draws the armed levels on the chart | |
| Show trade calendar, Calendar month | Calendar on or off. 0 = this month, 1 = last month. |
Important
Backtest results do not guarantee future results. Gold can move faster than any stop, and you can lose more than the stated risk. Trade only money you can afford to lose. Questions are welcome in the Comments tab or by private message on MQL5.