NextZone
- Indicators
- Version: 6.11
- Activations: 10

Detect zones. Analyze context. Compare configurations.
What if you could identify the next areas of interest before price reaches them, and also see how they have performed historically?
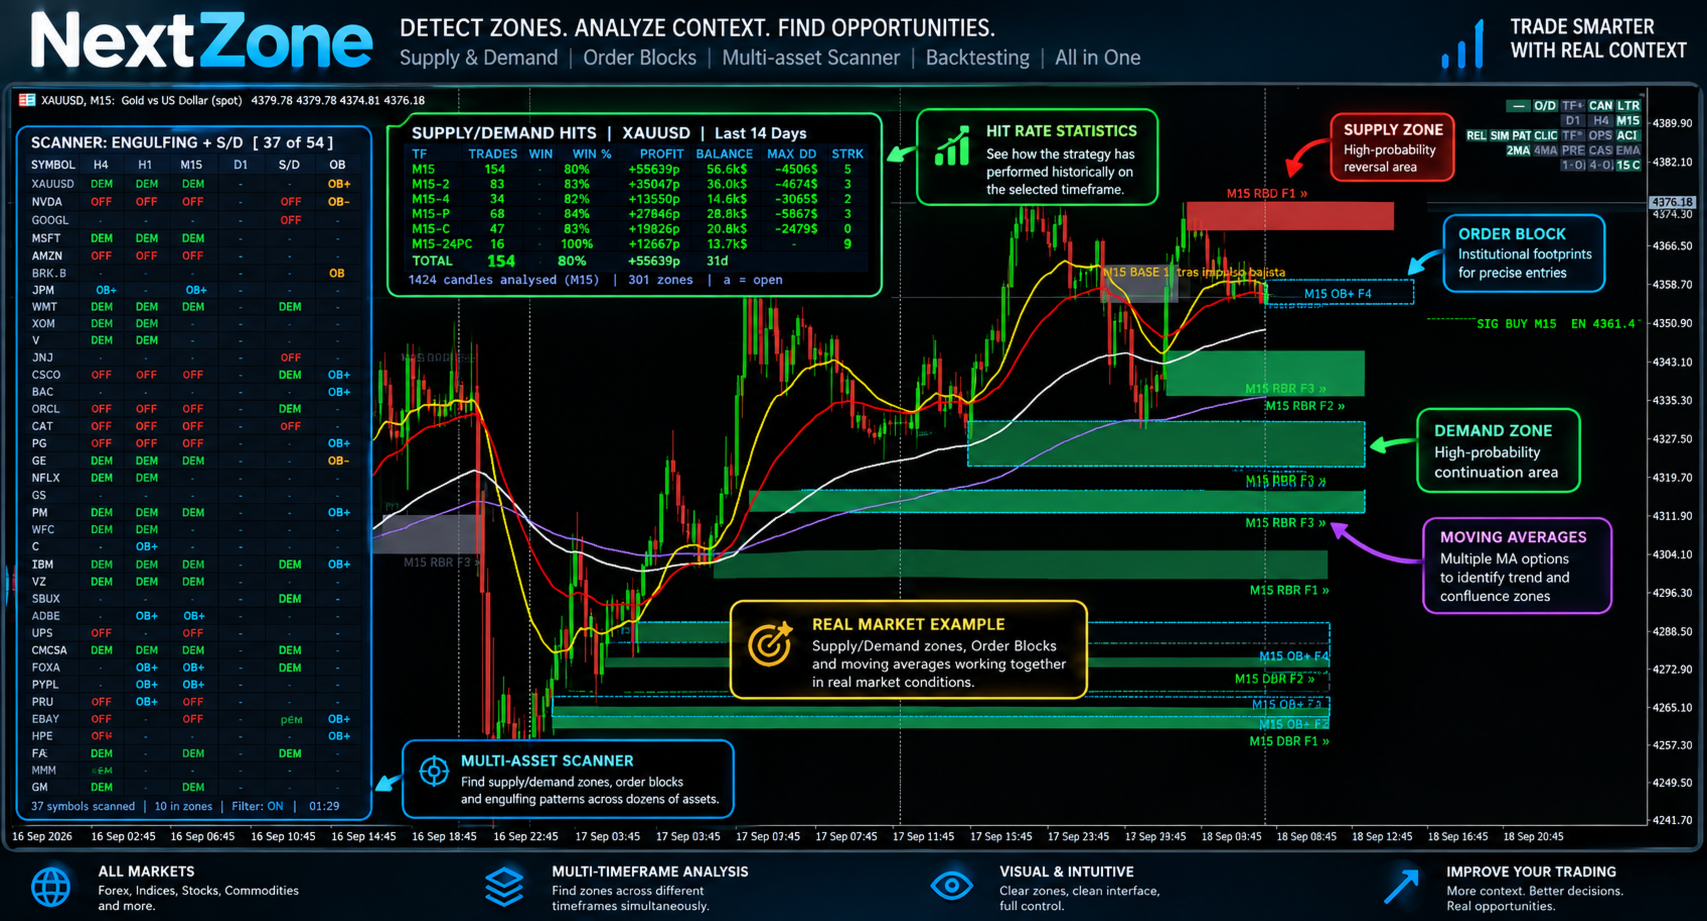
NextZone combines Supply & Demand, Order Blocks, engulfing candles, confluence analysis, a multi-pair scanner, and historical statistics in a single tool for MetaTrader 5.
It goes beyond simply drawing zones on the chart. It allows you to analyze, filter, and study different configurations using historical data, so you can adapt the tool to your own trading style.
🎯 IDENTIFY THE NEXT AREAS OF INTEREST
NextZone analyzes the market and detects potential:
-
Supply zones.
-
Demand zones.
-
Order Blocks.
-
Areas of interest related to candle patterns.
Zones can be displayed on the current timeframe and on several additional timeframes.
You can enable or disable each timeframe individually to keep your chart exactly the way you want it.
NextZone includes different detection modes to adapt to different analysis styles.
The internal detection logic is designed to work automatically with market data.
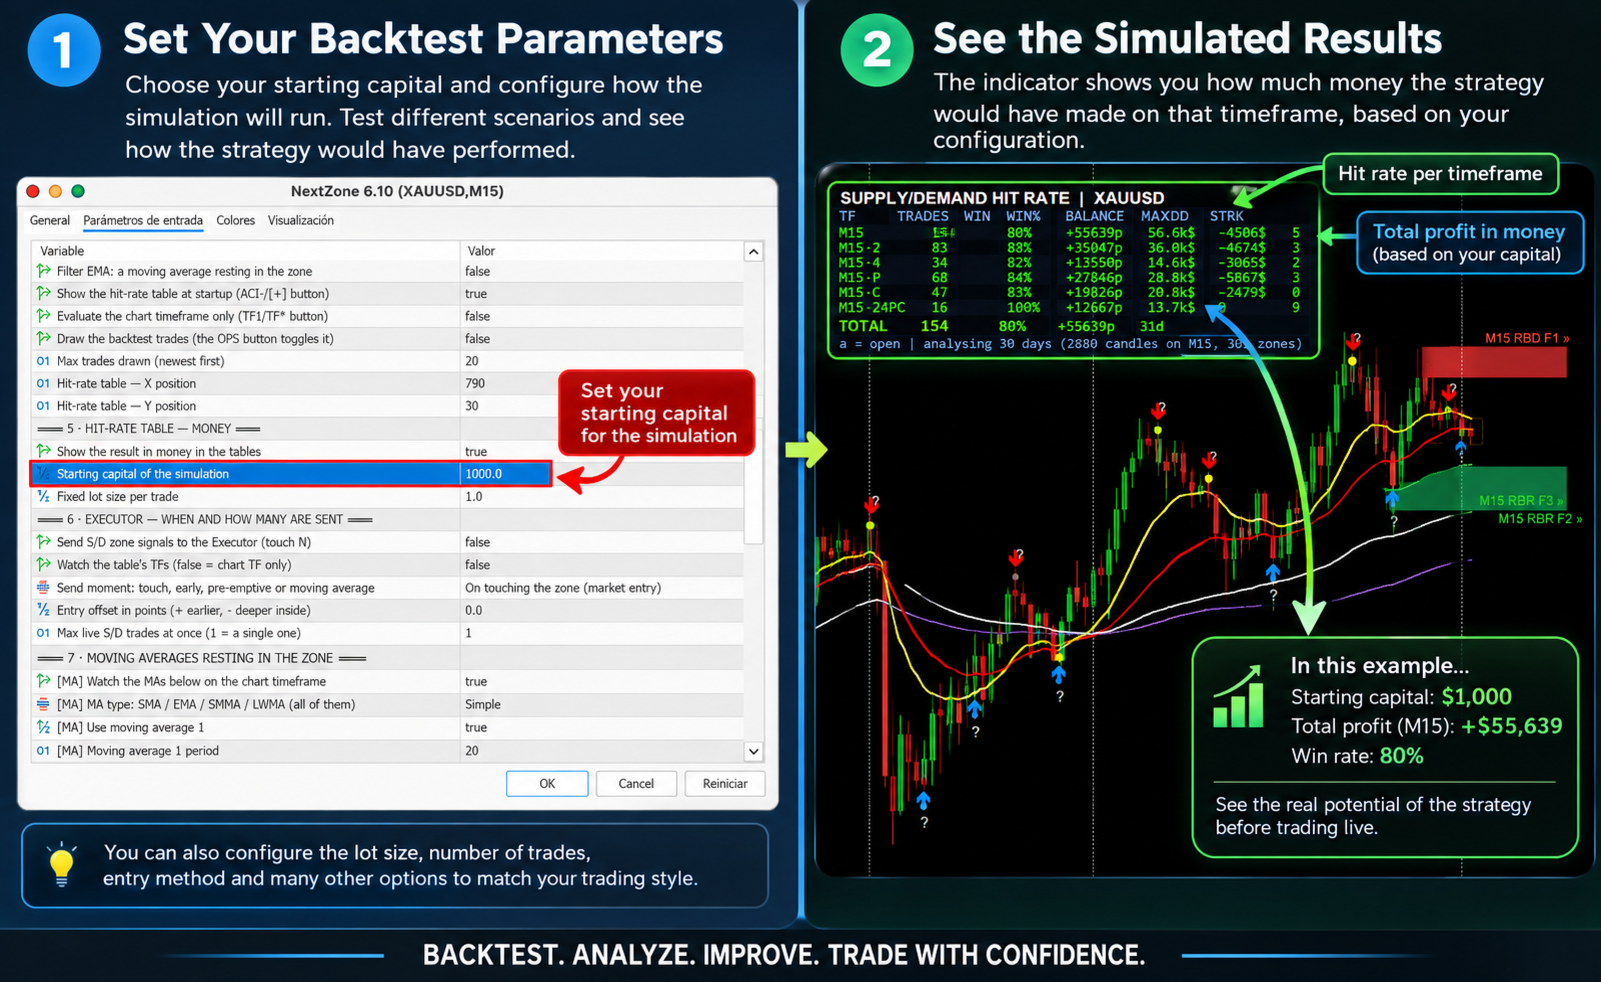
📊 THE EFFECTIVENESS PANEL
You don't have to rely only on what you see. You can analyze what happened.
This is one of the main features of NextZone.
Select a historical period and the indicator analyzes the zones detected during that period using the selected configurations.
The panel displays metrics such as:
-
Number of trades.
-
Win rate.
-
Net points.
-
Cumulative result.
-
Drawdown.
-
Maximum losing streak.
-
Days observed.
-
Results by timeframe.
Compare different configurations under the same historical conditions.
You can activate different filters and analyze their results individually and in combination.
This allows you to study how historical behavior changes when you modify the analysis conditions.
The goal is not to tell you what you should use, but to give you information so you can study the market and build your own methodology.
🔥 ENGULFING CANDLES WITH CONFLUENCE
NextZone includes engulfing candle analysis with a confluence score from 1 to 10.
The score can consider different elements of market context, including:
-
Location relative to relevant zones.
-
Trend.
-
Volatility.
-
Relative volume.
-
Market sessions.
-
Daily levels.
-
Higher-timeframe context.
The result provides a quick visual way to identify the level of confluence associated with each signal.
🔎 MULTI-PAIR SCANNER
Stop checking chart after chart.
The scanner allows you to analyze multiple instruments from a single panel.
For each symbol, you can quickly see:
-
Detected Supply and Demand zones.
-
Distance from the zones.
-
Analyzed timeframes.
-
Relevant conditions.
-
Context information.
Use your own symbol list and search for opportunities without having to open every chart individually.
🧩 FIVE CONFIGURABLE FILTERS
NextZone includes five types of filters based on moving averages and market context.
Each filter has its own control on the chart.
You can activate the filters you want, and the effectiveness panel will show their results separately, as well as a combined configuration.
You decide which conditions to use.
📈 MULTI-TIMEFRAME ANALYSIS
You can display zones from different timeframes directly on the same chart.
This allows you to combine:
-
Higher-timeframe context.
-
Supply and Demand zones.
-
Order Blocks.
-
Candle signals.
-
Confluence.
-
Filters.
-
Historical analysis.
Each timeframe can be enabled or disabled individually.
🖥️ HISTORICAL TRADES ON THE CHART
Historical analysis does not have to remain just a table.
NextZone allows you to display historical trades directly on the chart.
You can see:
-
Entry.
-
Stop Loss.
-
Take Profit.
-
Result.
-
Chronological order of trades.
Hover over the elements to view additional information related to each trade.
This allows you to visually study how the analyzed trades developed.
⚡ INTERACT WITH THE EXPERT ADVISOR
NextZone can be used together with the companion Expert Advisor.
Clicking a zone on the chart allows you to send it to the EA for execution.
There is also an option to allow execution of a manually selected zone regardless of the configured filters.
The Expert Advisor is sold separately.
🔔 ALERTS
Stay informed when relevant new conditions appear.
NextZone includes:
-
MetaTrader 5 pop-up alerts.
-
Push notifications to your mobile device.
You can continue with other tasks without having to constantly watch the chart.
🧹 KEEP YOUR CHART CLEAN
NextZone includes an interactive interface for controlling its different elements.
The control panel can be collapsed to recover chart space and keep your workspace clean whenever you want to focus solely on price action.
📅 HISTORY BASED ON DAYS
The historical period is configured using days, rather than a fixed number of candles.
🧠 A TOOL FOR ANALYSIS, NOT PROMISESNextZone uses historical data to study the behavior of different configurations.
Historical results do not guarantee future results.
The displayed statistics do not necessarily include all costs associated with a real trade, such as:
-
Spread.
-
Commission.
-
Swap.
-
Slippage.
Therefore, results obtained in a live account may differ from the historical results displayed by the indicator.
⚙️ INDICATOR + EXPERT ADVISORNextZone is the analysis and detection component.
The indicator DOES NOT open trades automatically.
To automate trade execution, use the companion Expert Advisor, available separately.
🚀 NEXTZONEDetect the zones that could matter.
Analyze the context.
Compare configurations.
Study historical behavior.
A tool designed for traders who want more than simple signals on the chart.