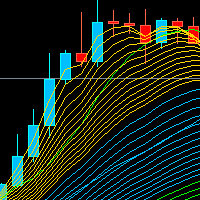
Dynamic Support Resistance KeyLevels Pro
- Indicators
- Version: 1.0
- Activations: 5

Short description (one line): KeyLevels draws a dynamic grid of key price levels around the previous daily close — a base line plus two independent step-level grids — to highlight support and resistance zones on any chart.
How it works
The indicator anchors to a base price, which by default is the closing price of the previous completed daily (D1) candle. From that base it draws three sets of levels:
Level 1 — Base line: a single, clearly visible anchor line at the base price (color and thickness configurable).
Level 2 — Step grid (red): N horizontal lines above and below the base, spaced by a fixed step size.
Level 3 — Step grid (green): N horizontal lines above and below the base, spaced by an independent step size.
Because gold and many instruments often respect round numbers and measured moves, the two independent grids make clustered price zones stand out at a glance.
Key features
Automatic anchoring — base price is taken from the previous completed D1 close, so levels update once per day with the latest market context.
Manual override — set a fixed base price if you prefer your own reference level.
Two independent grids — Level 2 (red) and Level 3 (green) each have their own step size, count, color and width.
Optional price labels — display the price value next to every level.
Efficient redraw — lines are moved in place on new bars and only fully rebuilt when the base price changes; smooth and flicker-free.
Non-intrusive — all objects are drawn in the background, non-selectable and hidden.
Universal — works on any symbol and timeframe; no buffers or recalculation cycles.
Input parameters
Parameter Default Description
ManualBase 0 Fixed base price. 0 = auto from previous daily close.
BaseColor Black Color of the base line.
LineWidth 2 Thickness of the base line.
ShowLabels true Show price labels next to each level.
Level2Step 14.4 Distance between Level 2 (red) lines.
Level2Count 10 Number of Level 2 lines above and below the base.
Level2Color Red Color of Level 2 lines.
Level2Width 1 Thickness of Level 2 lines.
Level3Step 16.18 Distance between Level 3 (green) lines.
Level3Count 10 Number of Level 3 lines above and below the base.
Level3Color Green Color of Level 3 lines.
Level3Width 1 Thickness of Level 3 lines.
Usage recommendations
Best used on M5–H4 charts, with the D1 close as the anchor.
Watch for zones where red and green levels overlap — these clustered areas often act as stronger support/resistance.
Combine with your own price-action or volume analysis; the indicator is an aid, not a signal generator.
Notes
Levels are drawn as chart objects and are cleaned up automatically when the indicator is removed.
The indicator does not repaint: the grid is based on the previous completed daily candle and only changes when that candle closes.
Disclaimer
Trading in financial markets involves risk. This indicator is provided for informational purposes only and does not constitute investment advice. Past performance does not guarantee future results.