RangeBreakLShape
- Indicators
- Version: 1.2
- Updated: 25 September 2026
- Activations: 5

SHORT DESCRIPTION
-----------------
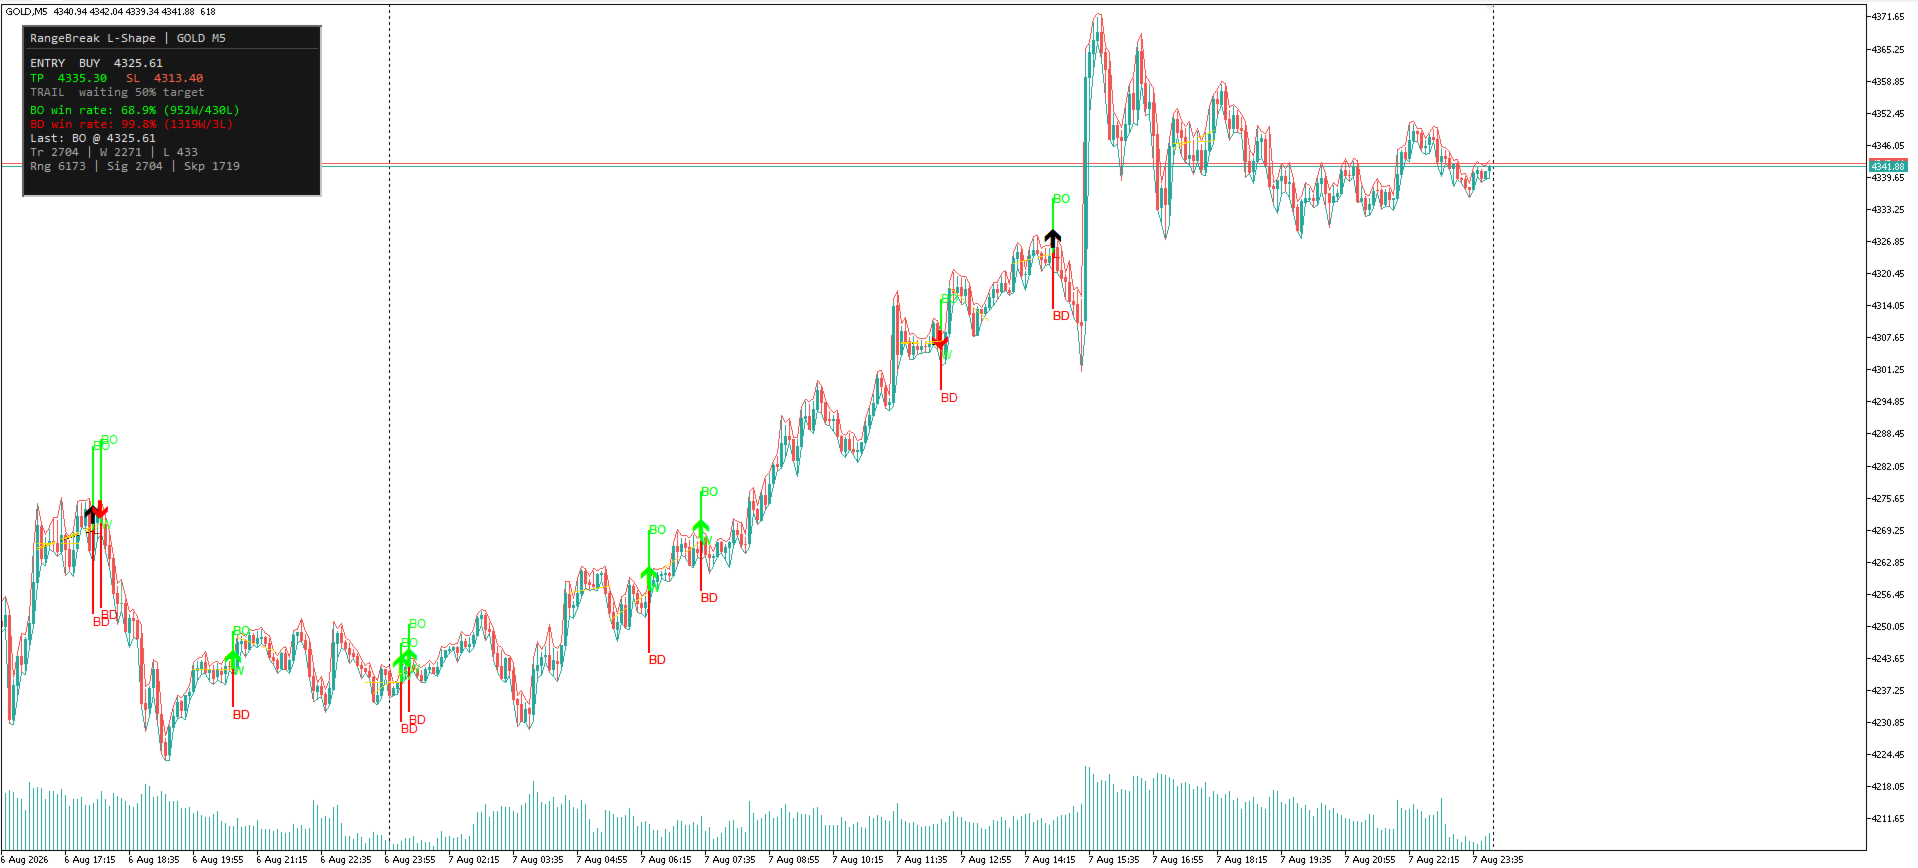
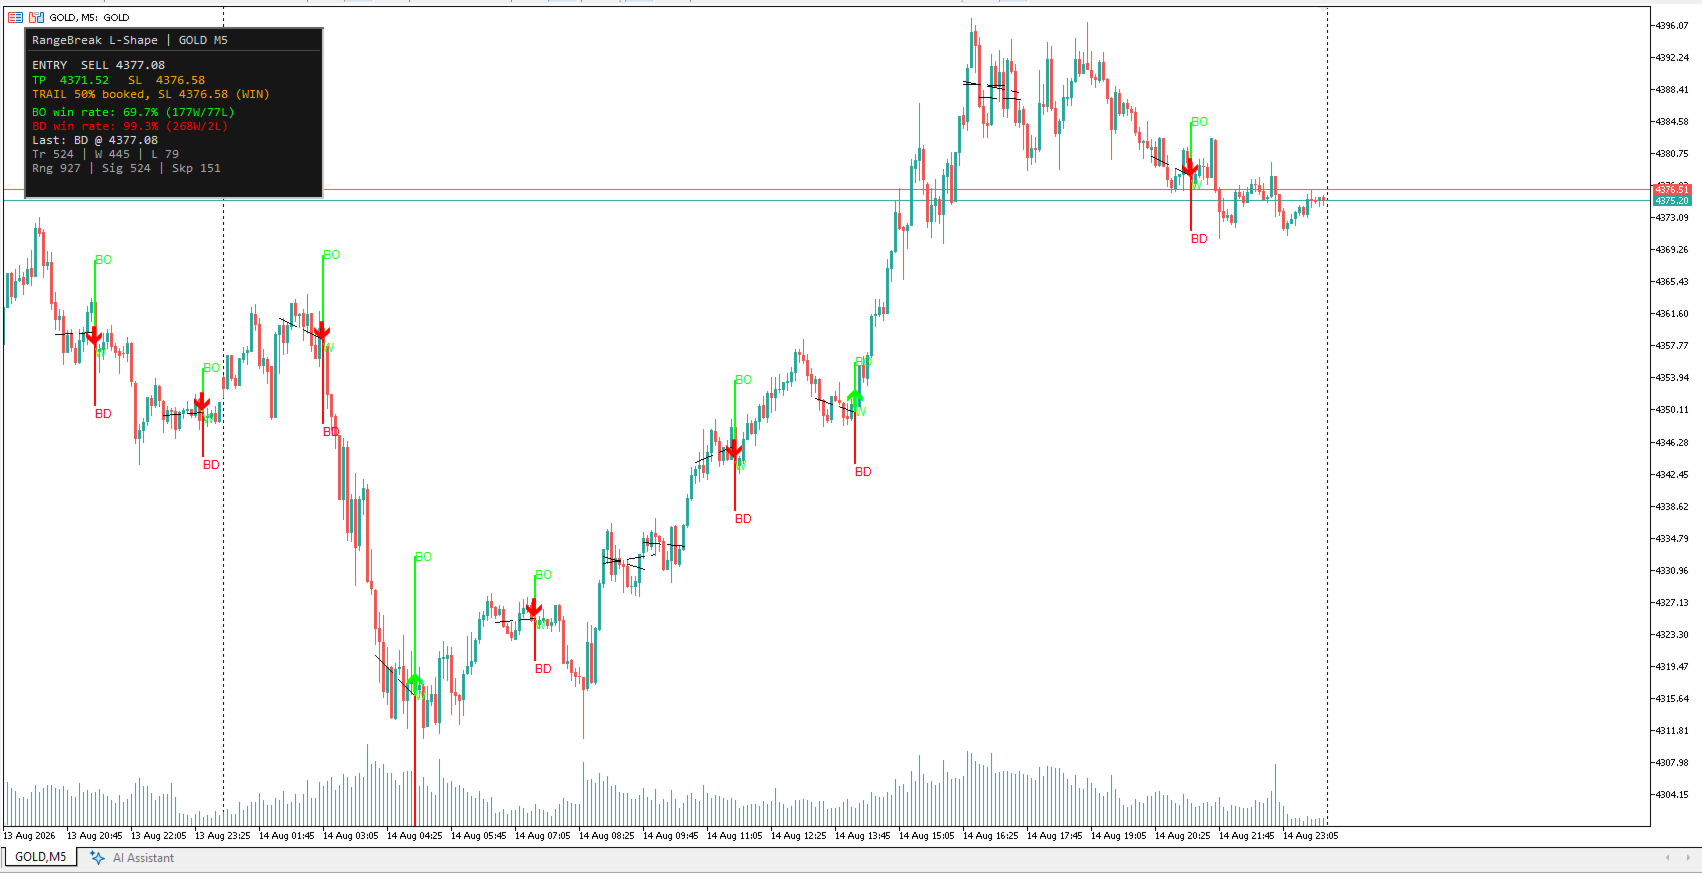
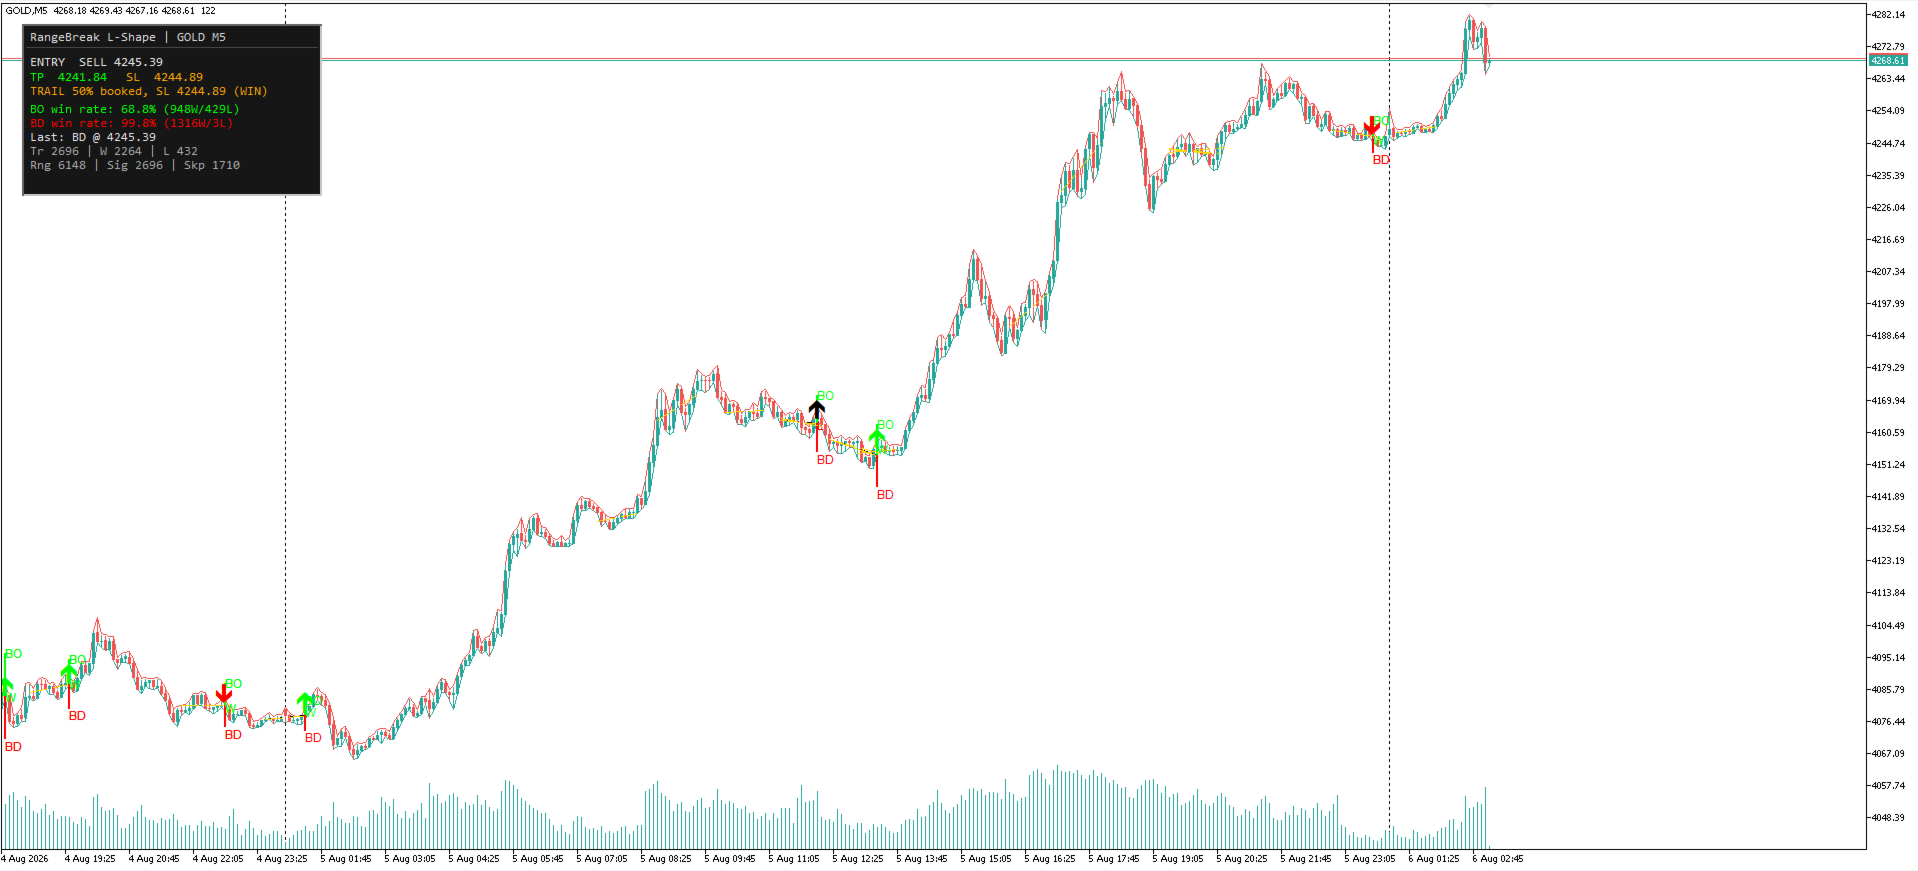
A range-bound market detector with an adaptive 10–120 bar lookback that
draws a sloped average line (midpoint / SMA / linear regression) and
marks L-shaped breakouts (BO / BD) with an honest paper-trade win-rate
panel. Signals are computed on closed bars only — no repainting on the
forming bar.
HOW IT WORKS
------------
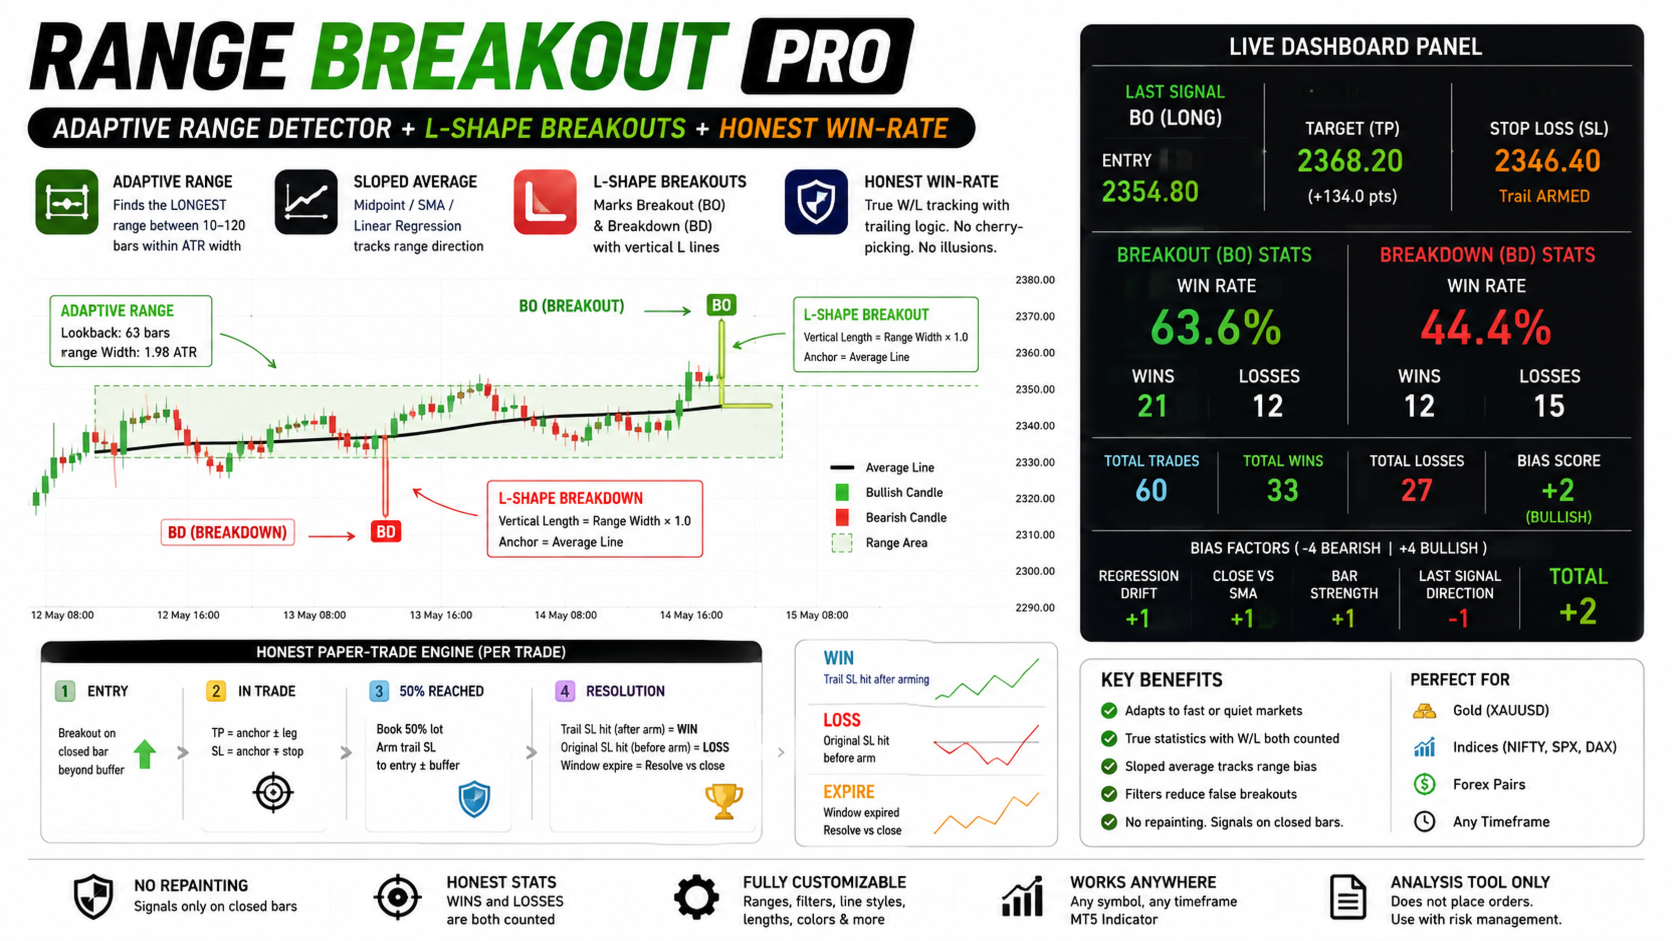
1. ADAPTIVE RANGE DETECTION — scans lookback windows (default 10..120
bars) and selects the LONGEST window whose high-low width is within
"Max range width" × ATR, adapting to fast or quiet markets.
2. AVERAGE LINE (3 MODES) — midpoint, SMA, or sloped Linear Regression
that tracks the internal trend of the range.
3. L-SHAPE BREAKOUT MARKING — when a closed bar closes beyond the line
by more than the buffer, draws the extended average line, a vertical
L leg (lime up / red down), BO/BD labels and a trade arrow. Leg
length is based on range width or ATR, one or both sides.
4. ENTRY QUALITY FILTERS — skip filter (entry must be near the line)
and optional next-bar-close confirmation to kill false spikes.
5. HONEST PAPER WIN-RATE ENGINE — every breakout tracked independently
and resolved exactly once: TP = anchor ± leg, SL = anchor ∓ stop;
trail rule at 50% of entry→TP books half and moves SL to entry ±
buffer (trail SL hit after arming = WIN, original SL before arming =
LOSS, expired window resolved vs close at window end). WINS AND
LOSSES ARE BOTH COUNTED — true win rates, not cherry-picked stats.
6. LIVE DASHBOARD PANEL — last entry/TP/SL (SL turns orange when trail
armed), BO & BD win rates with W/L counts, totals, and a bias score
(-4..+4) from regression drift, close vs SMA, bar strength and last
breakout direction.
7. HISTORY REPLAY — replays the whole loaded history through the same
state machine, redrawing every past range/breakout with W/L marks so
you can verify signal quality before going live.
NO REPAINTING: signals are generated only from CLOSED bars.
INPUT PARAMETERS
----------------
=== Range Detection ===
Minimum range lookback (bars) ........ 10
Maximum range lookback (bars) ........ 120
ATR period ............................ 14
Max range width (in ATR) .............. 2.5
Average line mode ..................... 2 (0=midpoint, 1=SMA, 2=LinReg)
=== Breakout ===
Breakout buffer (points) .............. 10
Entry on NEXT bar close (confirm) ..... false
Skip if entry farther than X pts ...... 250
Show BO / BD labels ................... true
Popup alert on breakout ............... true
=== L-Shape Line ===
Vertical anchor ....................... 1 (0=breakout close, 1=avg line)
Vertical length ....................... 0 (0=range width, 1=ATR)
Vertical length multiplier ............ 1.0
Draw vertical BOTH up and down ........ true
Show average line ..................... true
Keep last N events .................... 100
=== History Replay ===
Replay past history on attach ......... true
Past bars to replay (0=all) ........... 0
=== Bias & Win Rate Panel ===
Show dashboard panel .................. true
Panel X / Y offset .................... 20 / 20
Bias lookback (bars) .................. 100
Win-rate lookahead (bars) ............. 100
Stop = range width × multiplier ....... 1.0
Trail % (book 50% lot, arm trail) ..... 0.5
Trail SL = entry ± buffer (points) .... 50
=== Colors ===
Average line / Bull / Bear ............ black / lime / red
USAGE NOTES
-----------
- Any symbol and timeframe; M5/M15 on gold or index CFDs is the most
natural environment.
- Enable "Replay past history on attach" first and study the W/L marks.
- Too many skipped signals → raise Max entry pts; ranges rarely
detected → raise Max range width.
- Analysis tool only: computes entries/stops/targets and honest win
rates; does not place orders. A companion EA trades the same signals.
DISCLAIMER
----------
Trading involves risk. Past performance and backtest results do not
guarantee future results. Provided for educational/analytical purposes
only; not investment advice. Always test on a demo account first.