H1PatternMatcherPro
- Indicators
- Version: 1.0
- Activations: 5

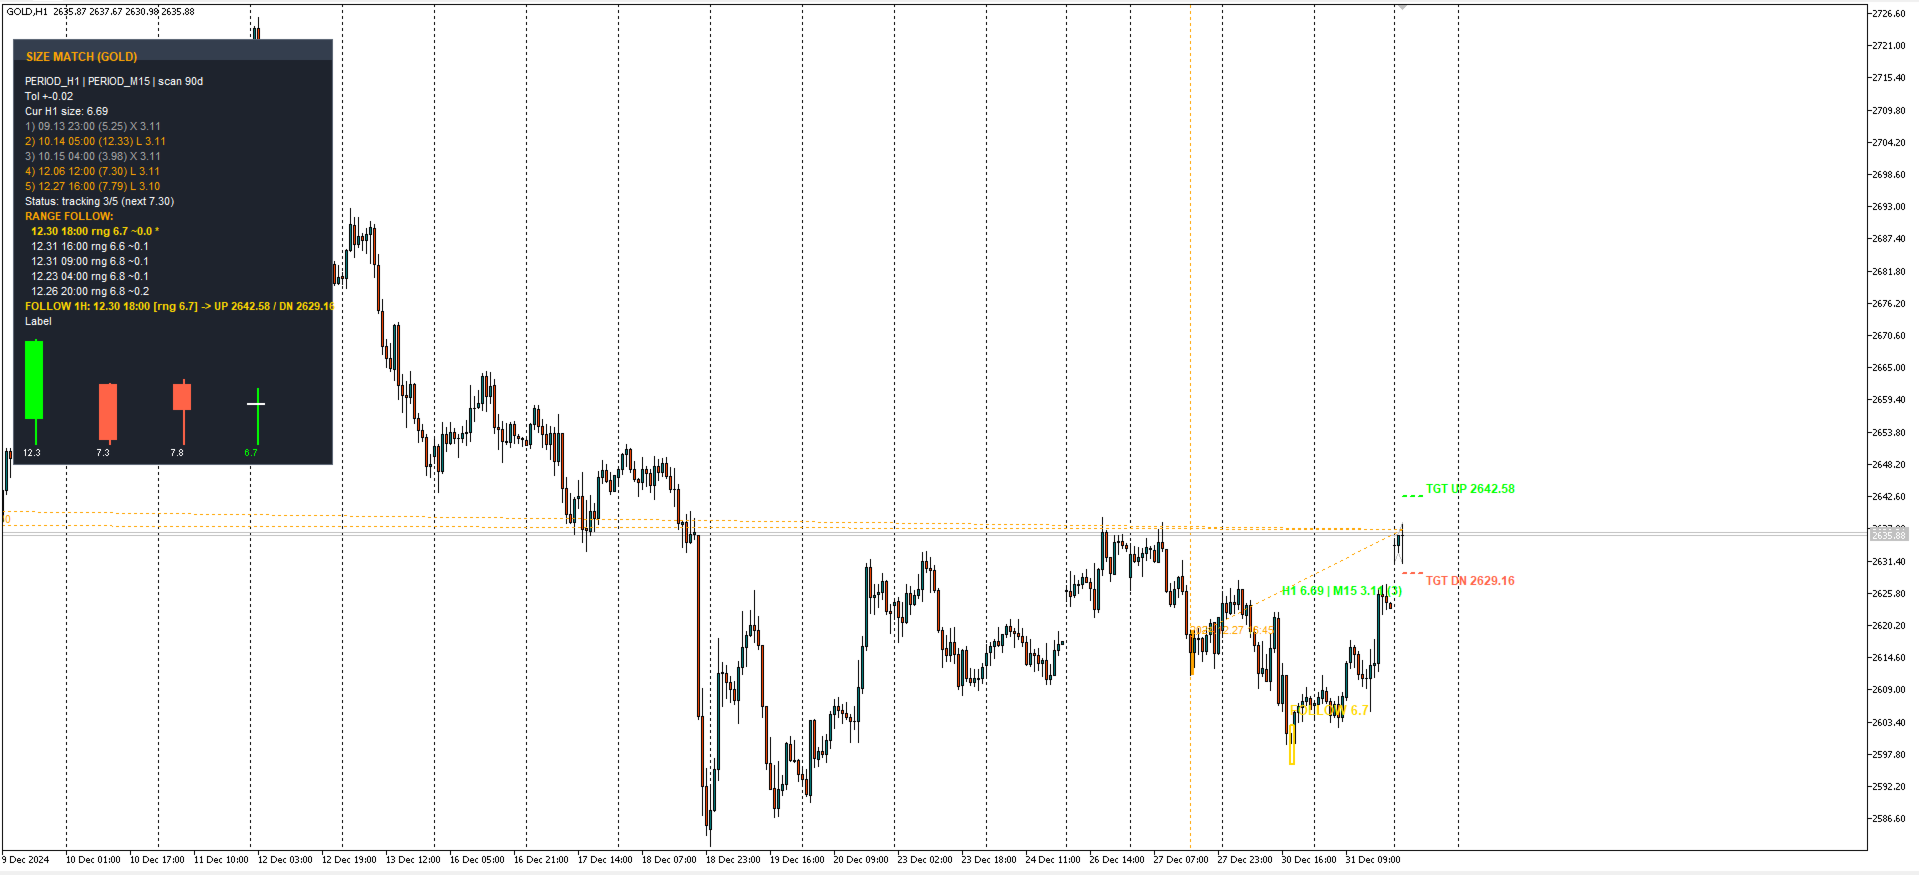
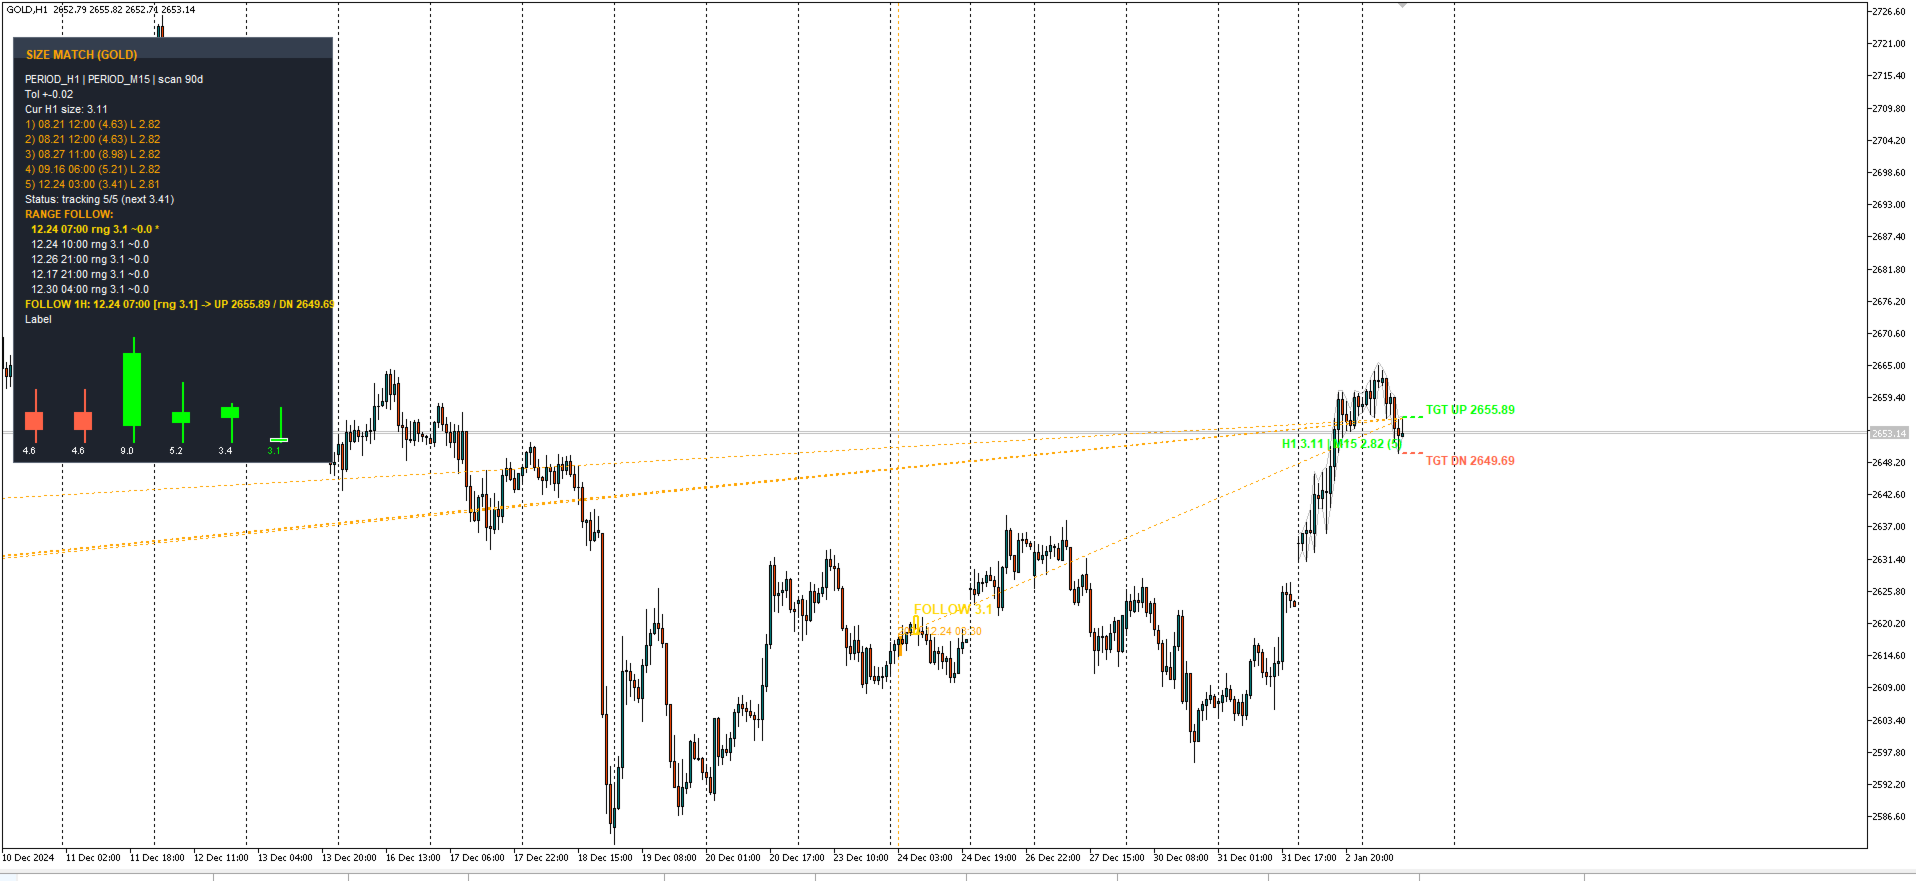
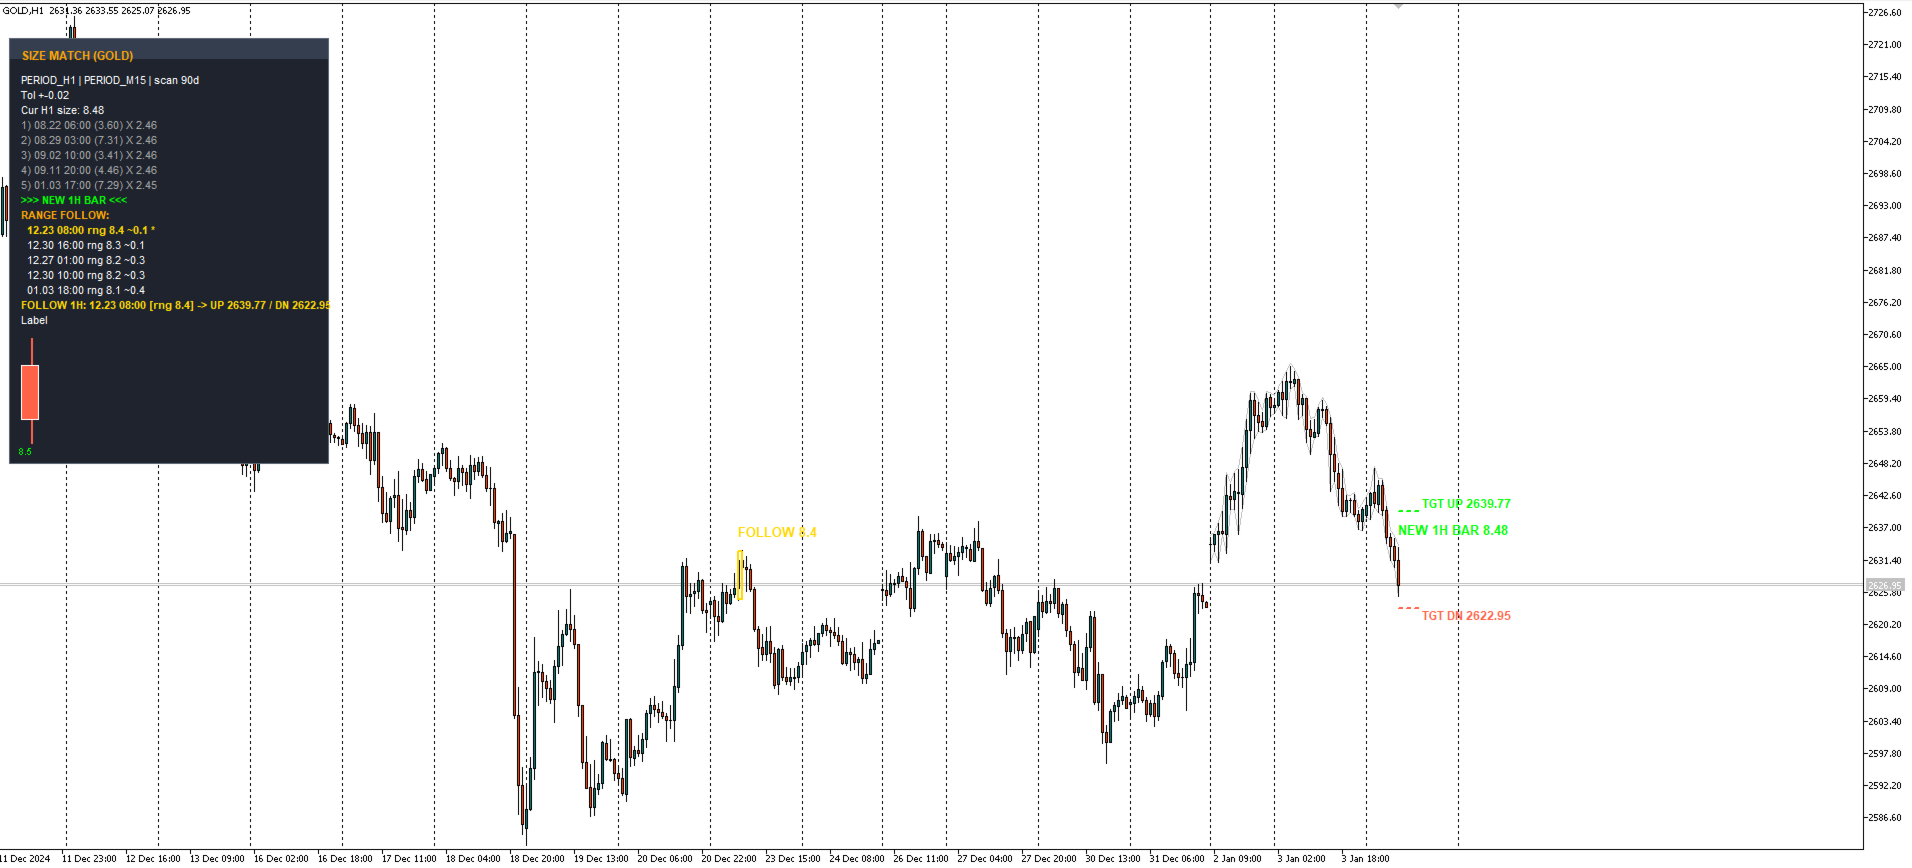
Short description (for the one-line field) Statistical day-range dashboard: classifies daily bars into Bullish, Bearish and Doji, splits each class into Big vs Normal, shows averaged wicks and open→high / open→low targets, and labels the live session BULLISH / BEARISH / DOJI / MONITORING. Works on any symbol and timeframe. Full description AverageDayRange is a statistical day-range analyzer that shows you what an "average" day really looks like on your symbol — and where the current day stands relative to those averages. The indicator scans the last N completed daily bars and separates them into three classes: BULLISH, BEARISH and DOJI. Each class is then split into BIG and NORMAL bars by comparing the full high–low range against the class average, so you can instantly see how often the market moves more or less than its typical size. Three compact dashboard panels (Bullish Bars, Bearish Bars, Doji Bars) display for every group: number of bars in the class (Big / Normal counts); average full range (high – low); average upper and lower wicks, computed separately per group; range targets: average open → high and open → low for the Big and Normal bull/bear bars. Live bias detection — while a new day is forming, the indicator compares its wicks against the stored statistics and prints a verdict on the chart: DOJI — when both wicks are within the doji average ±2 points; BULLISH — when open → low matches the bull average ±5 points; BEARISH — when open → high matches the bear average ±5 points; MONITORING — otherwise. The match buffers are fully configurable, so you can tighten or relax the rules to fit your instrument and trading style. Visual tools Pre-calculation range boxes around today's open — see the statistically expected daily zone before the day even develops; Target lines drawn directly on the chart (dotted style) with optional labels; Doji-day markers for a quick visual scan of history. All statistics are computed from completed daily bars (the current forming day is excluded by default), so panels, boxes and lines remain stable. Only the live bias label updates as the day develops. Customization Panel corner, X/Y offsets, width and font size; Individual colors for background, border, title, text and each class; Box width in days and fill transparency (0–255); Target line style, width, length and labels; Whole-point display option for clean integer values; Optional CSV export of the daily bias analysis for further study in Excel or other tools. The dashboard is rebuilt only when the day, symbol or timeframe changes, which keeps the chart free of flicker even on slow machines. Input parameters Parameter Default Purpose Days to analyze 90 Lookback window in daily bars Exclude current forming day true Statistics use closed days only Doji: max body as % of range 5 Body/range threshold for a doji Doji: body below X% of avg body 30 Doji body size filter Show values as whole points true Display clean integer values Bull/Bear wick match buffer 5 ±N points for bias match Doji wick match buffer 2 ±N points for doji match Write daily bias to CSV false Debug/analysis export Show dashboard panels true Toggle panels Panel corner / X / Y / font / width — Layout of the dashboard Colors (bg, border, title, text, bull, bear, doji) — Full palette control Mark doji days on chart true Visual history marks Draw pre-calc range boxes true Expected daily zone Box width / transparency 5 days / 40 Box appearance Draw target levels / length / style / width / labels true / 5 / dot / 1 / true Target lines Requirements MetaTrader 5 terminal; Any symbol and timeframe (analysis is performed on daily bars); No external dependencies, no DLL, no buffers — pure MQL5 drawing indicator; Works in real time and in the Strategy Tester (visual mode).