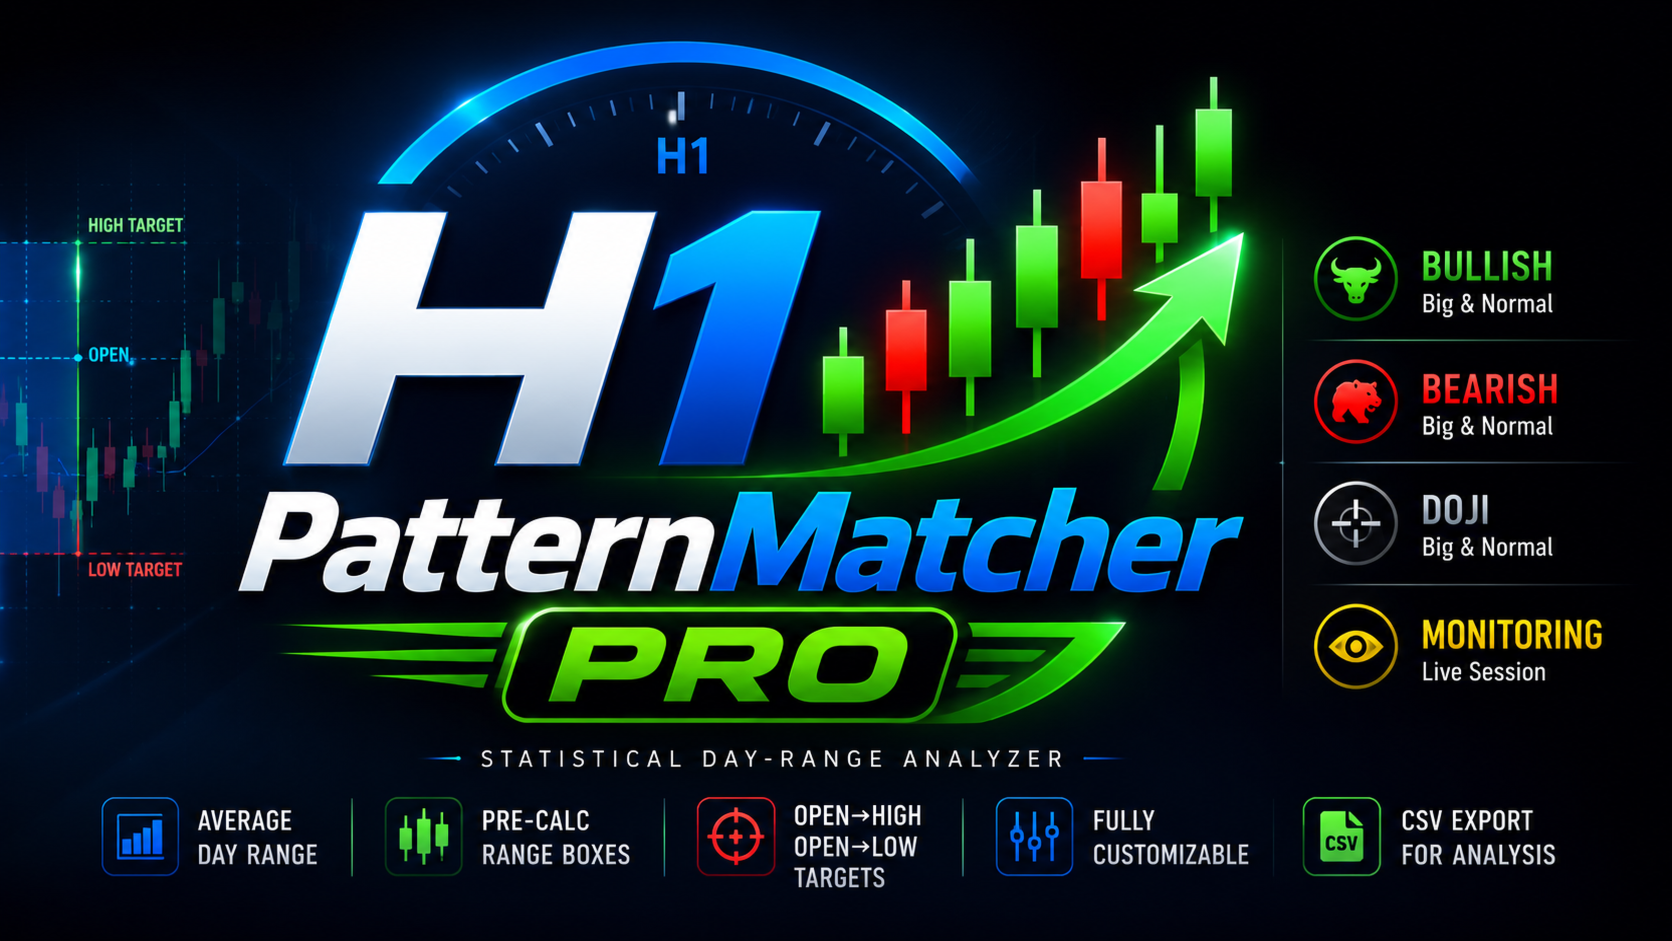
H1PatternMatcherPro

Short description (for the one-line field) Statistical day-range dashboard: classifies daily bars into Bullish, Bearish and Doji, splits each class into Big vs Normal, shows averaged wicks and open→high / open→low targets, and labels the live session BULLISH / BEARISH / DOJI / MONITORING. Works on any symbol and timeframe. Full description AverageDayRange is a statistical day-range analyzer that shows you what an "average" day really looks like on your symbol — and where the current day stands relative to those averages. The indicator scans the last N completed daily bars and separates them into three classes: BULLISH, BEARISH and DOJI. Each class is then split into BIG and NORMAL bars by comparing the full high–low range against the class average, so you can instantly see how often the market moves more or less than its typical size. Three compact dashboard panels (Bullish Bars, Bearish Bars, Doji Bars) display for every group: number of bars in the class (Big / Normal counts); average full range (high – low); average upper and lower wicks, computed separately per group; range targets: average open → high and open → low for the Big and Normal bull/bear bars. Live bias detection — while a new day is forming, the indicator compares its wicks against the stored statistics and prints a verdict on the chart: DOJI — when both wicks are within the doji average ±2 points; BULLISH — when open → low matches the bull average ±5 points; BEARISH — when open → high matches the bear average ±5 points; MONITORING — otherwise. The match buffers are fully configurable, so you can tighten or relax the rules to fit your instrument and trading style. Visual tools Pre-calculation range boxes around today's open — see the statistically expected daily zone before the day even develops; Target lines drawn directly on the chart (dotted style) with optional labels; Doji-day markers for a quick visual scan of history. All statistics are computed from completed daily bars (the current forming day is excluded by default), so panels, boxes and lines remain stable. Only the live bias label updates as the day develops. Customization Panel corner, X/Y offsets, width and font size; Individual colors for background, border, title, text and each class; Box width in days and fill transparency (0–255); Target line style, width, length and labels; Whole-point display option for clean integer values; Optional CSV export of the daily bias analysis for further study in Excel or other tools. The dashboard is rebuilt only when the day, symbol or timeframe changes, which keeps the chart free of flicker even on slow machines. Input parameters Parameter Default Purpose Days to analyze 90 Lookback window in daily bars Exclude current forming day true Statistics use closed days only Doji: max body as % of range 5 Body/range threshold for a doji Doji: body below X% of avg body 30 Doji body size filter Show values as whole points true Display clean integer values Bull/Bear wick match buffer 5 ±N points for bias match Doji wick match buffer 2 ±N points for doji match Write daily bias to CSV false Debug/analysis export Show dashboard panels true Toggle panels Panel corner / X / Y / font / width — Layout of the dashboard Colors (bg, border, title, text, bull, bear, doji) — Full palette control Mark doji days on chart true Visual history marks Draw pre-calc range boxes true Expected daily zone Box width / transparency 5 days / 40 Box appearance Draw target levels / length / style / width / labels true / 5 / dot / 1 / true Target lines Requirements MetaTrader 5 terminal; Any symbol and timeframe (analysis is performed on daily bars); No external dependencies, no DLL, no buffers — pure MQL5 drawing indicator; Works in real time and in the Strategy Tester (visual mode).
おすすめのプロダクト
マルチタイムフレーム対応、カスタマイズ可能なビジュアル信号、設定可能なアラートシステムを備えた相対力指数(RSI)インジケーター。 フリーランスプログラミングサービス、アップデート、その他のTrueTL製品は私の MQL5プロフィール からご利用いただけます。 フィードバックとレビューを心よりお待ちしております! RSIとは? 相対力指数(RSI)は、価格変化の速度と大きさを測定するモメンタムオシレーターです。このインジケーターは0から100の間で振動し、指定された期間にわたって最近の上昇幅と最近の下落幅の大きさを比較します。 RSIは主に買われすぎと売られすぎの状態を識別するために使用されます。高い値は買われすぎ状態を示し、低い値は売られすぎ状態を示します。トレーダーはまた、RSIと価格動作の間のダイバージェンスにも注目しており、これは潜在的なトレンド転換を示す可能性があります。 機能: 矢印と垂直線を使用したビジュアルシグナルマーカー 設定可能なトリガー付きの3つの独立したシグナルバッファ(方向変化、レベル交差、ピーク/谷、極端ゾーン) 時間帯フィルタリング付きの設定可能なア
FREE
Apex Point is a trend-following indicator for MetaTrader 5, transforming complex market data into signals for traders. It displays blue dots for uptrends, red dots for downtrends, and yellow crosses at potential reversals, helping users identify momentum shifts quickly. Key features include a confirmation system requiring multiple bars (default: 3) to validate changes, reducing false signals; dynamic ATR-based offsets for adaptive trailing, with instant ratcheting in the trend direction and smo
FREE
An oscillator that shows price changes and identifies areas of overbought and oversold. It can also show trend reversal points. WaveTrend Oscillator is a port of a famous TS /MT indicator. When the oscillator is above the overbought band (red lines) and crosses down the signal (solid line), it is usually a good SELL signal. Similarly, when the oscillator crosses above the signal when below the Oversold band (green lines), it is a good BUY signal. Good luck.
This indicator is a scalping indicator intended solely for the Boom and Crash indices of the Deriv Limited market It supports Boom 500, Boom 1000, Crash 500 and Crash 1000 Not repaint and no bug The settings are intuitive and easy to use The product activation number is 20 The Time Frame used depends on the user If you are an aggressive scalper then just use M1 For long trades use M15 If you are conservative use M5 Please contact me for more details of its use
これは、SMC(スマートマネー・コンセプト)とCPR(セントラル・ピボット・レンジ)分析を組み合わせたハイブリッド型インジケーターです。 主な目的 トレーダーが機関投資家のオーダーフロー、重要な価格水準、インバランス(不均衡)、および市場構造を、すっきりとしたダッシュボード形式のインジケーター一つで把握できるようにします。 主な構成要素 1. CPR(セントラル・ピボット・レンジ) デイリー・ピボット(マゼンタ色の線) BC(ボトム・セントラル)およびTC(トップ・セントラル)— ティール色(青緑色)の線 CPRクラウド(薄黄色) これらは前日の高値、安値、終値から算出されます。 2. 前日の水準 PDH(前日高値)— シルバー色の線 PDL(前日安値)— シルバー色の線 取引セッション開始後の「IBPeriodMinutes」(デフォルトは60分)の間に形成された実際の高値・安値の範囲を表示します。デイトレードや、セッション序盤の市場の方向性(バイアス)を判断するのに非常に役立ちます。  4. Smart Money Concepts (SMC) の機能 F
Trend Indicator Pro Use any currency and any time period you want For greater profitability use a risk return of at least 1:3 or 1:4 Entry Signal : Appears after the moving average crossover closes ️️ Histogram Flip : Signals important trend changes ️ Easy to use : Perfect for those who want fast, confident decisions! Boost your accuracy : Find the best market entry moments with more confidence! Get straight to the point and seize the best trend opportunities!
GDS Renko Entry Helper - Free Renko Price Interaction Indicator for MetaTrader 5 GDS Renko Entry Helper is a free Renko price interaction indicator for MetaTrader 5. It helps traders highlight important areas where price reacts, slows down, returns to a zone or changes behavior around support and resistance. The tool is designed for manual Renko analysis. It does not generate buy or sell signals and does not tell the trader when to enter the market. Its purpose is to help focus attention on area
GDS Renko Pip ST - Fixed Brick Renko Chart Tool for MetaTrader 5 GDS Renko Pip ST is a Renko chart tool for MetaTrader 5 designed for traders who want to build and study fixed brick Renko movement using a practical pip or point-based setup. The purpose of this tool is simple: create a cleaner Renko structure so the trader can observe direction, brick runs, pullbacks, support and resistance behavior without normal candle noise. This is not a signal indicator and it does not predict the market. It
Main purpose:   "Pin Bars"   is designed to automatically detect pin bars on financial market charts. A pin bar is a candle with a characteristic body and a long tail, which can signal a trend reversal or correction. How it works:   The indicator analyzes each candle on the chart, determining the size of the body, tail and nose of the candle. When a pin bar corresponding to predefined parameters is detected, the indicator marks it on the chart with an up or down arrow, depending on the directi
FREE
KS Dual Timeframe Candle Box Pro — MetaTrader 5 (MT5) チャートウィンドウ用インジケーター 主な機能 現在のチャート上に、上位時間足に基づく2つの独立した期間ボックスを描画します。さらに、オプションで「直前の高値・安値ライン」や「情報パネル/コーナー・ローソク足」を表示することも可能です。 1. デュアル期間ボックス ボックス1とボックス2は、それぞれ個別に有効/無効を切り替えられます。 各ボックスには任意の時間足を設定可能です(デフォルト:ボックス1はD1、ボックス2はW1)。 選択した各期間について、過去のボックスを連続して描画します(遡る期間数はプログラム内で固定値として設定されており、デフォルトは約10個です)。 ボックスの塗りつぶし色: 強気(終値 ≥ 始値) 弱気(終値 < 始値) 塗りつぶしには適度な透明度が適用されます。 オプションで、ボックスの周囲に細い枠線を描画することも可能です。 2. 直前の高値・安値ライン 有効化された各ボックスについて、直前に確定したローソク足(P1)およびその一つ
インジケーター技術仕様 – Delta Profile for MetaTrader 5 Delta Profile は MetaTrader 5 用に開発されたインジケーターで、指定されたローソク足範囲内の出来高フローを詳細に分析するためのものです。異なる価格レベルにおける正の出来高(上昇に関連)と負の出来高(下降に関連)の不均衡を構造化し、可視化します。その結果、ユーザーは最も多くの取引が集中する価格帯や実際の市場不均衡が形成される領域を明確に把握できます。 以下に、本インジケーターの主要な技術特性と設定パラメータを示します。 基本コンセプト インジケーターは 価格レベル を識別し、それらを正の出来高、負の出来高、および純 Delta(正負の出来高差)に分類します。 各価格レベルは 水平バー としてチャートに表示され、市場の活動ゾーンや不均衡領域を視覚的に確認できます。 ユーザーは 分析対象ローソク足数 、 価格の丸め精度 、 最大表示レベル数 、および 表示スタイル を自由に設定できます。 主要機能 価格レベルのマッピング :設定された精度に基づき価格を丸め、対応するローソク足の
ZumikoFX Trading Stats - Professional Account Dashboard Overview ZumikoFX Trading Stats is a comprehensive, real-time account monitoring dashboard designed for serious traders who need complete visibility of their trading performance. This indicator displays all crucial trading statistics in an elegant, easy-to-read panel positioned in the top-right corner of your chart. Key Features Complete Account Monitoring Balance & Equity - Real-time account status with current balance and equity includ
FREE
Stop guessing your lot size. Risk the same amount on every trade. Most traders blow accounts not because of bad entries, but because of inconsistent position sizing: fixed lots with variable stops means every trade risks a different — and unknown — amount of money. TrendSync Risk Calculator solves this in one drag. How it works Attach the indicator. It automatically anchors three draggable lines at the current price: Entry , SL at N×ATR and TP at your chosen R:R . Drag any line — or type a new A
FREE
Volume Profile by Trading Session   — Visualize where price spent its time and where the smart money traded, automatically segmented by Sydney, Tokyo, London, or New York sessions. What is Market Volume Profile? Market Volume Profile (MVP)   is a professional-grade Volume Profile indicator built for traders who think in   sessions, not just candles . While most volume tools show you a single profile across an arbitrary range, MVP automatically segments your chart by the four major Forex session
Price Magnet — Price Density and Attraction Levels Indicator Price Magnet is a professional analytical tool designed to identify key support and resistance levels based on statistical Price Density. The indicator analyzes a specified historical period and detects price levels where the market spent the most time. These zones act as “magnets,” attracting price action or forming a structural base for potential reversals. Unlike traditional Volume Profile tools, Price Magnet focuses on price-time d
High Low Open Close
Alexandre Borela
4.98 (45)
このプロジェクトが好きなら、5つ星レビューを残してください。 このインジケータは、指定されたためのオープン、ハイ、ロー、クローズ価格を描画します 特定のタイムゾーンの期間と調整が可能です。 これらは、多くの機関や専門家によって見られた重要なレベルです トレーダーは、彼らがより多くのかもしれない場所を知るために有用であり、 アクティブ。 利用可能な期間は次のとおりです。 前の日。 前週。 前の月。 前の四半期。 前年。 または: 現在の日。 現在の週。 現在の月。 現在の四半期。 現年。
FREE
概要 このインジケーターは、クラシックな ドンチャンチャネル を強化したバージョンで、実践的なトレード機能を追加しています。 標準の3本線(上限、下限、中央線)に加え、 ブレイクアウト を検出し、チャート上に矢印で視覚的に表示します。また、チャートを見やすくするために、 現在のトレンド方向と逆側のラインのみを表示 します。 インジケーターの機能: 視覚的シグナル :ブレイクアウト時にカラフルな矢印を表示 自動通知 :ポップアップ、プッシュ通知、Eメール RSIフィルター :市場の相対的な強弱に基づいてシグナルを検証 カスタマイズ可能 :色、ラインの太さ、矢印コード、RSI閾値など 動作原理 ドンチャンチャネルは次のように計算します: 上限線 :直近N本のクローズ済みローソク足の最高値 下限線 :直近N本のクローズ済みローソク足の最安値 中央線 :最高値と最安値の平均値 上方ブレイクアウト は終値が上限線を超えたときに発生し、 下方ブレイクアウト は終値が下限線を下回ったときに発生します。 インジケーターは以下を行います: 3本のドンチャンラインを描画 方向転換後の最初のブレイクアウト
FREE
Intraday Session TPO: Precision Volume Profiling for Day Traders Stop trading blind during the most volatile hours of the day. Standard daily volume profiles blend everything together, masking the true areas of liquidity and institutional interest. The Intraday Session TPO is engineered specifically for session-to-session traders. It empowers you to isolate and profile specific time windows—like the London Open, the New York Killzone, or the Asian range—so you can see exactly where the volume is
This spread indicator displays the actual spread of each candle. It highlights the maximum spread and the minimum spread of the chosen symbol. This indicator is very helpful to see in real time the spread evolution helping to avoid taking a trade when the spread is too high. Inputs: Print value in Points: if true displays the spread as a whole number D isplay minimum and maximum spread of the past N days: select the number of days to consider the maximum and minimum spread Automatically adj
FREE
Overview The Ultimate RSI Indicator for MT5 is an advanced oscillator designed to provide a more adaptive and dynamic interpretation of market momentum compared to the traditional RSI. It incorporates range normalization, adaptive smoothing, and flexible averaging methods to enhance responsiveness and reduce lag. How It Works Unlike the standard RSI, which only measures relative price strength, the Ultimate RSI dynamically adjusts to recent price range expansions and contractions. It calculate
Radar Trade Analytic
Jeverson Rodrigues Ferreira
Radar Trade Analytic 2.0 – MT5用クオンツパネル Radar Trade Analyticとは? Radar Trade Analyticは、Radar Tradeエコシステムのクオンツ(定量分析)モジュールです。メインチャートの下に独立したウィンドウで表示され、同一の独自エンジン「Sigma」で構築された4つの同期レイヤーを表示します。チャート上で見えるものとパネルで読み取れるものが直接対応することを保証しています。 売買シグナルはありません。ターゲットもありません。アラートもありません。Radar Trade Analyticは本当に重要なデータだけを整理し、明確な判断ができるようにします。 バージョン2.0での変更点 # 改善点 旧バージョン (1.00) バージョン2.0 1 Delta Flow (CVD) M1足のみを使用して計算(下位時間足での推定値) TICK_FLAG_BUY/SELLフラグ付きティックによる実際のアグレッション・デルタ。プロ向けプラットフォームと同じデータを使用 2 自動フォールバック M1が利用できな
Friend of the Trend: Your Trend Tracker Master the market with Friend of the Trend , the indicator that simplifies trend analysis and helps you identify the best moments to buy, sell, or wait. With an intuitive and visually striking design, Friend of the Trend analyzes price movements and delivers signals through a colorful histogram: Green Bars : Signal an uptrend, indicating buying opportunities. Red Bars : Alert to a downtrend, suggesting potential selling points. Orange Bars : Represent cons
FREE
You can change the time period of the chart at the touch of a button. You can also change multiple charts at the touch of a button. You can also change multiple charts at the touch of a button,   saving you the trouble of changing time periods. We are live-streaming the actual operation of the system. Please check for yourself if it is usable. Please check it out for yourself. https://www.youtube.com/@ganesha_forex We do not guarantee your investment results. Investments should be made at you
Kiwi Multi Pairs Indicator MT5 v1.01 Kiwi Multi Pairs Indicator MT5 is a multi-market and multi-timeframe confirmation dashboard for MetaTrader 5. Instead of opening many charts and checking indicators individually, Kiwi Multi Pairs Indicator brings 9 markets, 5 technical indicators and 7 timeframes together in one easy-to-read dashboard. The indicator is designed to help traders quickly identify bullish, bearish and mixed market conditions and compare confirmation across different symbols and t
FREE
Titan NPC Pro - Makine Öğrenimi Olasılık Motoru Titan NPC Pro, Çekirdek Regresyonu ve dinamik volatilite kanalları etrafında tasarlanmış gelişmiş bir analitik göstergedir. Yüksek olasılıklı ortalama-geri dönüş girişlerini tespit etmek ve özel, Smart Shield ADX Filtresi adlı özel bir filtreleme mekanizmasını uygulamak için tasarlanmıştır; bu filtre agresif piyasa koşullarında sermayeyi korur. Temel Özellikler: Sinirsel Temeli (Sıfır Gecikme): Rasyonel Quadratic Kernel Regression kullanılarak, bu
Here's how to use the BTC_PriceAlert.mq5 indicator in MetaTrader 5: What it does It's a custom indicator (not an EA) for BTCJPY that draws horizontal alert lines on your chart and fires a notification when price touches your specified upper or lower target. It checks the high/low of each bar (wick touches count, not just closes). Install the indicator Copy BTC_PriceAlert.mq5 into your MT5 data folder under MQL5/Indicators (File > Open Data Folder in MetaEditor or MT5). Compile it in MetaEditor
FREE
Product Name:   Auto Trend Pattern Pro [Subho - India] Short Description: An advanced Price Action tool that automatically detects and draws Trend Channels, Wedges, and Triangles with a live Dashboard. Full Description: Auto Trend Pattern Pro   is a sophisticated technical indicator designed for MetaTrader 5. It automates the complex task of drawing Trend Lines and Channels. By analyzing historical price action, the indicator identifies the most accurate "Best Fit" channels for both short-term
FREE
CHoCH + BOS + Hacim Profili — Akıllı Piyasa Yapısı Göstergeleri Gerçek zamanlı piyasa yapısı dağılımı ve canlı hacim analiziyle birleştirilmiş bu gösterge sayesinde piyasa yapısı değişiklikleri (CHoCH) ve yapı kırılmaları (BOS) sinyallerini hem salınım hem de iç yapı üzerinde otomatik olarak tanımlar, emir bloklarını, eşit yüksek/düşük seviyeleri ve likidite hareketlerini işaretler ve alıcı ve bunların en aktif olduğu yerlerde tam olarak canlı bir Hacim Profili görüntüler. "The price will be u
ichimoku indicator with alert; audible alert, email alert, push alert you can enable or disable the settings as you wish When there is a crossing of tenkansen and kijun you will get an alert When there is a cross between Senkouspan A and Senkouspan B you will get an alert Affordable sound settings possibility to modify the parameters of the ichimoku indicator
General Description In the simplest terms this is a contrarian intra-day scalping system. Built to try and let correct trades run as far as possible and flip the trade when indicated. The indicator looks at historical daily trading ranges to lay out levels at which it takes long and short positions based on the statistical levels. The indicator is built around index futures, mainly around S&P and the DOW but can be used an any futures contract mainly using AMP Futures to trade. The indicator is
このプロダクトを購入した人は以下も購入しています
First time on MetaTrader, introducing IQ Star Lines - an original Vedic Astrology based indicator. "Millionaires don't use astrology, billionaires do" . - J.P. Morgan, Legendary American financier and banker. We don't offer free or bonus indicators in exchange of reviews from you. You won't need any free products with this indicator to make it work. ;) Enjoy! Welcome to  the new and updated  IQ Star Lines , the ultimate fusion of ancient planetary harmonic cycles and modern quantitative trading.
UZFX {SSS} スキャルピング・スマートシグナル v5.0 MT5は、変動の激しい市場において正確かつリアルタイムのシグナルを求めるスキャルパー、デイトレーダー、スイングトレーダー向けに設計された、リペイントのない高性能な取引インジケーターです。(UZFX-LABS)によって開発されたこのインジケーターは、価格行動分析、トレンド確認、スマートフィルタリングを組み合わせることで、すべての通貨ペアおよび時間枠において、高確率の売買シグナル、警告シグナル、トレンド継続の機会を生成します。 トレードの判断に迷うのはもうやめましょう。明確さ、正確さ、そして規律ある市場執行を求めるトレーダーのために設計された、体系的なシグナルシステムに従い始めましょう。 間違いなく、MQL5で入手可能な最高のインジケーターの一つです。絶対に見逃さないでください!!「スマートなトレーダーのためのスマートシグナル」 最新バージョン5.0がリリースされました。価格は予告なく最大499.99ドルまで値上がりする可能性がありますので、チャンスを逃さないようお早めにお求めください!! 購入を決める前に!無料トライアル
ARICoin is a powerful trading companion designed to generate high-probability entry signals with dynamic TP/SL/DP levels based on volatility. Built-in performance tracking shows win/loss stats, PP1/PP2 hits, and success rates all updated live. Key Features: Buy/Sell signals with adaptive volatility bands Real-time TP/SL/DP levels based on ATR Built-in MA Filter with optional ATR/StdDev volatility Performance stats panel (Success, Profit/Loss, PP1/PP2) Alerts via popup, sound, push, or email Cust
Boom & Crash & PainX & GainX Ultimate Spike Detector Trade Spikes With Confidence — Not Guesswork Catching spikes should be one of the most profitable strategies in synthetic markets. But for most traders, it becomes one of the most frustrating. You enter too early… price goes against you. You wait for a spike… it never comes. You finally catch one… but don’t know whether to hold or close. You make profit… then give it all back because there’s no exit plan. This is exactly the problem the Ultim
一言でいうと このインジケーターは RSI と MACD という2人の専門家を1つにまとめたもの です。2つのチャートを別々に見て判断する代わりに、両方が同意したときだけ「買い」または「売り」の矢印を表示します。 矢印は再描画されません 。一度出現すれば、そのまま固定されます。 「コンボ」の意味 通常、トレーダーは RSI(値動きの勢い)と MACD(トレンドの方向)を別々に見ます。しかし両者が矛盾することも多いです。 このインジケーターでは、 両方が同時に同意したときのみシグナル を出します。これにより、多くの偽シグナルが排除されます。 画面で見えるもの 価格チャートとは別のインジケーターウィンドウ 青と赤の矢印 —— そのまま使えるシグナル 拡大表示された MACD ヒストグラム(見やすく強調されている) RSI と MACD のラインも表示されるが、注目すべきは矢印 こんな人におすすめ 初心者 —— 2つのインジケーターを別々に解釈し、矛盾に対処する必要がない 経験者 —— シグナルの高速フィルタリングと、再描画しないクリアなロジック 迷いたくない人 —— 「買い」「売り」「待て
このインジケーターは、市場で 関心が示されたゾーン をハイライトし、その後に 注文の蓄積ゾーン を表示します。 これは、大規模な**板情報(オーダーブック)**のように機能します。 これは、 巨大な資金 のためのインジケーターです。その性能は卓越しています。 市場にどんな関心が存在していても、 必ず目に見えるようになります 。 (これは 完全に再設計され、自動化されたバージョン です。もはや手動分析は必要ありません。) トランザクションスピード(取引速度) は新しい概念のインジケーターで、市場で大口注文が どこに・いつ 集中しているかを示し、それに基づいたチャンスを提供します。 トレンドの変化を 非常に早い段階 で察知することができます。 FXでは「出来高」と呼ばれているものは誤解されています。実際には、これは 時間あたりの価格変動量 です。したがって、正しい名称は トランザクションスピード です。 考え方・行動・分析の仕方すべてが問われます。 分析パラダイムの転換は非常に重要です。 このインジケーターは、FXにおける出来高の考え方を 根本から再定義 し、論理的な形で正確に活用する、
MERAVITH SCANNERは、MetaTrader 5用のプロフェッショナルな金融市場インジケーターで、複数の分析ツールを一つの統合システムにまとめています。独自の出来高加重平均価格(VWAP)手法を使用してすべての計算を自動で行い、主観的な解釈を完全に排除します。 このインジケーターは、すべての資産クラス(FX、株式、指数、商品、暗号通貨)およびM1から月足までのすべての時間軸で動作します。基本原理は「価格は出来高に従う」というものです。MERAVITHは機関投資家の出来高が集中するポイントを特定し、その集中から数学的に正確な価格レベルを導き出します。予測や投機は行わず、計算のみを行います。 MERAVITH SCANNERを使用すると、28の主要FX通貨ペアをすべての時間軸でわずか2~3分でスキャンできます。また、任意の市場をスキャンすることも可能です。例えば、約100銘柄の株式を約10分でスキャンできます。 インジケーターは、消耗レベル、均衡線、偏差、統計レベル、およびターゲット予測を算出します。 チャート要素 Origin Point :すべての計算が始まる起点です。イン
note: this indicator is for METATRADER4, if you want the version for METATRADER5 this is the link:  https://www.mql5.com/it/market/product/108106 TRENDMAESTRO ver 2.5 TRENDMAESTRO recognizes a new TREND from the start, he never makes mistakes. The certainty of identifying a new TREND is priceless. DESCRIPTION TRENDMAESTRO identifies a new TREND in the bud, this indicator examines the volatility, volumes and momentum to identify the moment in which there is an explosion of one or more of these da
相場が本当は何をしているのかを見抜く。   3つの市場フェーズ(収縮・拡張・トレンド)を目の前でライブに捉え、トレンド・フェーズの初期段階でより優れたエントリーを取りましょう   。      当て推量はもう終わり。機関投資家やスマートマネーのように相場を読み始めましょう。   Apex Market Structure Pro(MT5版)は、ノイズを取り除き、あらゆるローソク足の下にある真の構造を見せる高精度のスマートマネー分析ツ   ールです。流動性、構造転換、蓄積ゾーン、トレンドバイアスを、ひとつのクリーンでプロフェッショナルなオーバーレイに集約します。遅行   指標に見切りをつけ、明晰さをもってトレードする準備のできた本気のトレーダーのために作られました。   重要:本インジケーターは Heikin Ashi(平均足)ローソク足での動作を前提に設計されています。使用前にチャートを Heikin Ashi   に設定し、その真価を解き放ってください。分析のすべては Heikin Ashi の価格の流れを軸に構築されています。Apex Market Structure Pr
Title:FX-AIEA Supply and Demand Zone Indicator (MT5) — Technical Overview Version: 2.51 | Platform: MetaTrader 5 Introduction Supply and demand zones are considered a core manifestation of institutional order flow, providing a more direct reflection of buying and selling pressure than traditional support/resistance levels. This indicator attempts to automate the identification of high-probability supply and demand zones using an adaptive ZigZag algorithm, reducing the subjectivity and time asso
MasterTrend Indicator for MT5 A powerful trend-following and signal-evaluation tool MasterTrend   is a custom MT5 indicator that combines Moving Averages and ATR-based risk/reward logic to generate clear buy/sell signals. It visualizes dynamic SL/TP levels, evaluates past trade outcomes, and displays win/loss statistics in a clean on-chart panel. Key features include: Buy/Sell signals based on MA crossovers ATR-based SL/TP1/TP2/TP3 levels with visual lines and labels Signal outcome tracking wit
SMC Sweep Fvg MT5 — スマートマネーと同じ目線で、チャート上に市場を映す こんな経験はありませんか。価格がストップを巻き取り、反転し、まさに想定どおりの方向へ進む。方向は正しかった。間違えたのはエントリーだけです。 このインジケーターは、そうした場面を減らすために作られています。分析で最も重い部分——チャートのマークアップ——を引き受け、本当に重要な「判断」をあなたに残します。 チャートに表示されるもの マーケットストラクチャー — 実際の構造的高値・安値に HH / HL / LH / LL ラベルとレベルライン。トレンドが一目で分かり、推測は不要です。 インバランスゾーン(FVG) — 価格が急ぎ過ぎて通過し、後で戻りやすい領域。未埋めと既埋めのゾーンは別色で表示されます。 流動性の動き — 反転前に市場がレベルを巻き取る瞬間を追跡します。 トレード設計の完成形 — エントリー矢印、ストップロス、利益目標。すべて描画済みで、頭の中で計算する必要はありません。 トレンドフィルター — 上位足のラインで、主戦場の動きの側に立ち続けられます。 インジケーターは
Zain Gold ScalpingV5
Ahmed Gamal Abdel Nasser Mohamed
Zain Gold Scalping V5 is a technical analysis indicator for MetaTrader 5 designed for Forex and Gold markets. It provides chart-based market information, trend analysis, signal conditions, and an on-screen dashboard to help traders analyze price movement across multiple timeframes. Main Features The indicator supports multiple timeframes, including M1, M5, M15, M30, H1 and higher timeframes. It can be used with Gold (XAUUSD), Forex currency pairs, indices and other supported instruments. The in
==================================================================== SMC Pro v6.1 APEX AI — XAUUSD Gold Empire MetaTrader 5 インジケーター · Smart Money Concepts · 予測インテリジェンス・エンジン ==================================================================== SMC Pro v6.1 APEX AI は、MetaTrader 5 上の XAUUSD(ゴールド)専用に構築された、プロフェッショナルな Smart Money Concepts インジケーターシステムです。 完全な SMC フレームワーク — Order Blocks、Liquidity sweeps(流動性スイープ)、Fair Value Gaps、Break of Structure、Change of Character — に加え、AI を活用した 8 つの新モジュールを組み合わせ、精密なビ
AriX
Temirlan Kdyrkhan
1 (4)
AriX Indicator for MT5 A powerful trend-following and signal-evaluation tool AriX is a custom MT5 indicator that combines Moving Averages and ATR-based risk/reward logic to generate clear buy/sell signals. It visualizes dynamic SL/TP levels, evaluates past trade outcomes, and displays win/loss statistics in a clean on-chart panel. Key features include: Buy/Sell signals based on MA crossovers ATR-based SL/TP1/TP2/TP3 levels with visual lines and labels Signal outcome tracking with real-time stat
OrderFlow Absorption – MT5用プロフェッショナル・デルタ&アブソープションシグナルインジケーター OrderFlow Absorptionで本物のオーダーフロー分析の力を解き放ちましょう。MetaTrader 5向けの究極のデルタヒストグラム&アブソープションシグナルインジケーターです。あらゆる価格変動の裏側で何が起きているのかを知りたいトレーダーのために設計されており、市場を動かす隠れた買い/売り圧力や吸収イベントを明らかにします。 特徴 デルタヒストグラムの可視化:   買い圧力・売り圧力を色分けされたヒストグラムで即座に表示。 アブソープションシグナル検出:   高度なロジックで強気・弱気の吸収イベントを特定し、反転の兆しを早期に通知。 チャートマーカー:   吸収シグナルをチャート上に直接マークし、視覚的に分かりやすく表示。 ポップアップアラート:   新しい吸収シグナルが出現した際にリアルタイムで通知。 カスタマイズ可能な閾値:   弱いシグナルを除外し、高確率のセットアップに集中。 リソース管理:   大きなチャートでも高速に動作する効率的な計算。
Historical Similarity Matcher Indicator (HI.SI.MA) Try it free today — demo version now available!   https://www.mql5.com/en/market/product/167114 Overview The Historical Similarity Matcher is a technical analysis indicator for MetaTrader 5. It scans historical price data to find segments that show statistical similarity to a user-selected reference period on the chart.
VTrende Pro
Andrii Diachenko
5 (1)
VTrende Pro - MTF indicator for trend trading with a display panel for MT5 *** Videos can be translated into any language using subtitles (video language - Russian) Although the signals of the VTrende Pro indicator can be used as signals of a full-fledged trading system, it is recommended to use them in conjunction with the Bill Williams TS. VTrende Pro is an extended version of the VTrende indicator. Difference between Pro version and VTrende: - Time zones - Signal V - signal 1-2 waves -    S
マーケットメーカーのためのツール。 Meravith は次の機能を提供します: すべての時間足を分析し、現在有効なトレンドを表示します。 強気と弱気の出来高が等しくなる流動性ゾーン(出来高均衡)を強調表示します。 異なる時間足のすべての流動性レベルをチャート上に直接表示します。 テキスト形式の市場分析を生成し、参考情報として表示します。 現在のトレンドに基づいて目標値、サポートレベル、ストップロスを計算します。 取引のリスクリワード比を算出します。 口座残高に基づいてポジションサイズを計算し、潜在的な利益を推定します。 また、市場に大きな変化があった場合には警告を表示します。 インジケーターの主要ライン: 強気/弱気の出来高エグゾーストライン ― 目標値として機能します。 市場のトレンドを示すライン。市場が強気か弱気かによって色が変わり、トレンドのサポートとして機能します。主にその色が市場センチメントを示します。 出来高均衡ライン(Eq)。Eq(Volume Equilibrium)ラインはシステムの中核です。これは買い手と売り手の出来高のバランスポイントを表します。市場の流動性を示し
ScalpPoint is a powerful trading companion designed to generate high-probability entry signals with dynamic TP/SL/DP levels based on volatility. Built-in performance tracking shows win/loss stats, PP1/PP2 hits, and success rates — all updated live. Key Features: Buy/Sell signals with adaptive volatility bands Real-time TP/SL/DP levels based on ATR Built-in MA Filter with optional ATR/StdDev volatility Performance stats panel (Success, Profit/Loss, PP1/PP2) Alerts via popup, sound, push, or emai
ZIVA Signal Intelligence
Hassan Abdullah Hassan Al Balushi
ZIVA Signal Intelligence An Adaptive, Modular Market Intelligence System ZIVA Signal Intelligence is not positioned as a conventional trading indicator. It is a fully integrated, proprietary market intelligence system engineered to deliver structured, high-precision interpretation of price behavior within a controlled analytical environment. Developed through an independent architectural approach, ZIVA does not rely on, derive from, or replicate existing indicators. It represents a standalone
SMC Institutional Suite v3.7 Professional Smart Money Concept Indicator for MetaTrader 5 What is New in Version 3.7 - Visual Stability Update This release focuses entirely on one goal: making every zone, label, and line on your chart rock-solid stable. There is no more flickering, no more zones disappearing on a new candle, and no more duplicate drawings. Order Block (OB) zones no longer flicker or disappear. Once drawn, they stay permanently on the chart. Equal Highs and Equal Lows (EQH / EQL)
PrimeScalping is a powerful trading companion designed to generate high-probability entry signals with dynamic TP/SL/DP levels based on volatility. Built-in performance tracking shows win/loss stats, PP1/PP2 hits, and success rates — all updated live. Key Features: Buy/Sell signals with adaptive volatility bands Real-time TP/SL/DP levels based on ATR Built-in MA Filter with optional ATR/StdDev volatility Performance stats panel (Success, Profit/Loss, PP1/PP2) Alerts via popup, sound, push, or e
Binary Compound Indicator V3 Binary Compound Indicator V3 is a technical analysis indicator for MetaTrader 5 designed to help traders identify potential market opportunities using multiple confirmation filters and structured risk management concepts. The indicator combines trend analysis, momentum confirmation, and market condition filtering to provide visual trading signals directly on the chart. Main Features Triple-confirmation signal system EMA trend filtering RSI momentum analysis Stochast
Triple Crox Strategy v4.10 Triple Crox Strategy v4.10 Professional MetaTrader 5 Indicator 13 Patterns • Fibonacci • CLUSTER ML • Multi-Filter 1. Overview Advanced MT5 indicator combining 13 Pattern Detection , Fibonacci Analysis , CLUSTER Machine Learning and Multi-Filter system for precise signals on Forex, indices, commodities, crypto. 5-step pipeline: indicators → filter → patterns → signals → levels. 2. Trading Setup Heikin-Ashi colored bars. Buy/Sell arrows with Entry, TP1(1x ATR), TP2(2x
TraderHUD
Justino Porto Neto
5 (1)
TraderHUD v2 — プロトレーダーのための完全ダッシュボード TraderHUD v2 は、MetaTrader 5向けの最も包括的なビジュアルインジケーターの進化版です。トレーダーがより的確な判断を下すためにチャート上で確認すべきすべての情報を一つのツールに統合します:時間的コンテキスト、ドルの強さ、統計的レンジ、ピボットレベル、値動きの速度、マクロトレンド——すべてが統合され、設定可能で、チャートを煩雑にしません。 このバージョンは実際のライブトレードでの使用経験に基づいて構築されており、明確な哲学に従っています: より多くのコンテキスト、より少ないノイズ 。 v2の新機能 8つのモジュールを単一のインジケーターに完全統合 DayRangeとDollarFlowが連動する設定可能なサイドパネル 正時表示と連動した市場セッションのマーキング レベル間の平均線オプション付きクラシックピボットポイント ベータ版としてマークされた2つの実験的モジュール:ボラティリティとマクロトレンド平均線 完全に設定可能なレイアウト——コーナー、幅、色、フォント モジュール タイマーとスプレ
XCalper TFO
Aecio de Feo Flora Neto
This oscillator was developed exclusively by xCalper in 2015 based on moving averages calculations to indicate and try predicting oversold and overbought levels. The fast line (white, by default) oscillates basically between values -0.5 (oversold) and +0.5 (overbought). Whenever this line crosses upward value -0.5, it means an oversold price level. When it crosses downward value +0.5, it means an overbought price level. When fast line crosses value 0.0 and returns, it is a strong pull-back indic
The Expert Advisor and the video are attached in the Discussion tab . The robot applies only one order and strictly follows the signals to evaluate the indicator efficiency. Pan PrizMA CD Phase is an option based on the Pan PrizMA indicator. Details (in Russian). Averaging by a quadric-quartic polynomial increases the smoothness of lines, adds momentum and rhythm. Extrapolation by the sinusoid function near a constant allows adjusting the delay or lead of signals. The value of the phase - wave s
Классификатор силы тренда. Показания на истории не меняет. Изменяется классификация только незакрытого бара. По идее подобен полной системе ASCTrend, сигнальный модуль которой, точнее его аппроксимация в несколько "урезанном" виде, есть в свободном доступе, а также в терминале как сигнальный индикатор SilverTrend . Точной копией системы ASCTrend не является. Работает на всех инструментах и всех временных диапазонах. Индикатор использует несколько некоррелируемых между собой алгоритмов для класси
作者のその他のプロダクト
The indicator continuously analyzes price action and highlights abnormal volatility spikes before they become obvious on the chart. Using a multi-level strength system, traders can instantly distinguish between moderate, strong, and extreme market impulses. Features Real-time Impulse Strength calculation using ATR normalization Multi-Level Detection System Level 1 (Aqua) – Strong Momentum Level 2 (Orange) – High Momentum Level 3 (Red) – Extreme Momentum Groupe (Megenta) Reversal OR Trend Fol
RSI With Alert – Advanced Relative Strength Index Indicator Stay ahead of market momentum with RSI With Alert , a powerful MetaTrader 5 indicator designed to monitor overbought and oversold conditions in real time. Built on the classic Relative Strength Index (RSI), this tool provides instant notifications whenever the RSI reaches user-defined levels, helping traders identify potential reversal and breakout opportunities without constantly watching the charts. Key Features Standard RSI calcula
Market Speed M5 measures how fast the market is moving by calculating the price range (High-Low) of each M5 candle and converting it into a movement speed value. This indicator helps traders quickly identify periods of high activity, momentum bursts, and slow market conditions. Higher histogram values indicate stronger price movement within the candle, while lower values suggest a quieter market. Features Measures candle movement speed in real-time Easy-to-read histogram display Works on a
Average Day Range Short description  A daily-range statistics engine that classifies the last 90 days into Bullish / Bearish / Doji bars, splits them into Big & Normal groups, and projects today's expected open→high / open→low targets and bias straight onto your chart. Full description Average Day Range turns raw daily-bar history into an actionable intraday roadmap. Instead of guessing "where will price go today?", it measures what price actually did after the open over the last three months,
Short description (one line): KeyLevels draws a dynamic grid of key price levels around the previous daily close — a base line plus two independent step-level grids — to highlight support and resistance zones on any chart. How it works The indicator anchors to a base price, which by default is the closing price of the previous completed daily (D1) candle. From that base it draws three sets of levels: Level 1 — Base line: a single, clearly visible anchor line at the base price (color and thick
Short description (marketplace listing, ~400 chars) MarketDominance   visualizes intraday market control by accumulating candle bodies from the session start. Every bar is classified as Bullish, Bearish or Doji and "poured" into green/red bottles on an on-chart panel — the taller the bottle, the stronger the side's dominance. Includes doji detection with wick analysis, Big/Normal bar classification (ATR or average body), 90-day historical averages, and a color-coded dominance footer. Fully custo
SHORT DESCRIPTION ----------------- A range-bound market detector with an adaptive 10–120 bar lookback that draws a sloped average line (midpoint / SMA / linear regression) and marks L-shaped breakouts (BO / BD) with an honest paper-trade win-rate panel. Signals are computed on closed bars only — no repainting on the forming bar. HOW IT WORKS ------------ 1. ADAPTIVE RANGE DETECTION — scans lookback windows (default 10..120    bars) and selects the LONGEST window whose high-low width is within
Short description (one line) ZigZag-style swing indicator that plots swing highs/lows, leg midpoints, range labels and dynamic Small/Medium/Large target levels with a latched target-chaser line. Full description Swing Cross is a highly customizable ZigZag-style indicator that identifies swing highs and lows, draws the connecting legs, and automatically builds dynamic target levels from your symbol's recent leg-range history. How it works Detects local swing highs/lows using the classic ZigZag
OpenHedgePro 5m — Logo Description OpenHedgePro 5m is a professional MT5 Expert Advisor designed around hedging and 5-minute scalping . The logo represents the EA’s core concept: Green Bull — BUY positions and upward market movement. Red Bear — SELL positions and downward market movement. Candlestick chart — automated market analysis and trading. Opposing arrows — the EA’s hedge-based BUY + SELL approach. ️ 5m clock — the strategy operates on the 5-minute timeframe . OpenHedgePro —
RangeMoveLine – MT5 Indicator RangeMoveLine is a simple price-action based MT5 indicator designed to track meaningful price movement while filtering out small market fluctuations. The indicator monitors the opening price of each selected timeframe candle and maintains an anchor level. When the price remains within the defined range, the line stays flat. When a candle open moves beyond the selected range, the RangeMoveLine immediately jumps to the new price level. Key Features Dynamic Step Lin
Gold RangeBreak L-Shape EA for MT5 RangeBreak L-Shape EA is an automated MetaTrader 5 trading system designed to detect range-bound market conditions and identify potential breakout (BO) and breakdown (BD) opportunities. The EA uses an adaptive 10–120 bar range lookback , ATR-based range detection, and a sloped linear-regression average line to identify the market's current structure. When price breaks the average line, the EA can generate an L-shape or reverse-L breakout signal. Key Features Ad
フィルタ:
レビューなし
レビューに返信