A Chart Manager Pro
- Utilities
- Version: 1.87
- Updated: 15 October 2026
- Activations: 10

Advanced Chart Manager:
- Puts your chart look back when another program changes it, on your next click.
- Names the setting that was changed, so you can tell which tool did it.
- Styles every open chart from one instance, then returns you to your chart.
- Builds your own theme from thirteen colors, or uses one of five ready ones.
- Watches second by second right after load, while slow indicators start up.
- Clears leftover drawings on a schedule, leaving panel backgrounds in place.
When the chart keeps changing under you
You run several Expert Advisors and a handful of indicators across many charts. You set each chart up the way you like to read it.
- After a restart, one tool repaints the background with its own colors.
- Another turns the grid back on or switches the chart to bars.
- Arrows and lines from tools you closed weeks ago are still there.
You fix it, and an hour later something has moved again. The worst part is not the fixing. It is not knowing which of your programs keeps doing it.
Set it once, and have it watched
Your chart look should live in one place and be checked against the chart itself. When something drifts, you should hear what it was, and get your look back without hunting through windows. And it should reach every chart you have open, not one at a time.
Advanced Chart Manager is an indicator built around that idea.
Chart Guard
Chart Guard is on from the start. It compares the chart with your settings every 15 seconds and whenever the chart changes. When a color or setting has moved, it puts it back on your next click or key press on that chart, so it never pulls a chart to the front while you are working on another one.
After a terminal restart it checks again, and anything changed while the terminal was loading is restored on your first click.
It tells you what changed
Each repair writes one line to the Experts tab naming the setting, such as the background, the grid or the chart mode. If a tool keeps changing the same thing, you get one line a minute with a count instead of a flood. With several Expert Advisors on one chart, that line is how you find the one responsible.
Defend After Load
Right after it loads, slow indicators may still be starting and setting their own colors. For that window the check runs every second instead of every 15 seconds. Choose 30 seconds, 60 seconds (the default), 2 minutes, 5 minutes, or Off.
Every open chart from one instance
Set Manage to All open charts, and one copy styles every chart in the terminal with a single click on the chart it is attached to. When it finishes, it brings that chart back to the front and says so in the journal. Only one instance can hold this role; a second one notices and looks after its own chart.
Deleting objects cannot be undone, so cleanup has its own reach. Cleanup Applies To stays on This chart only unless you choose Follow Manage scope.
Your own theme, or a ready one
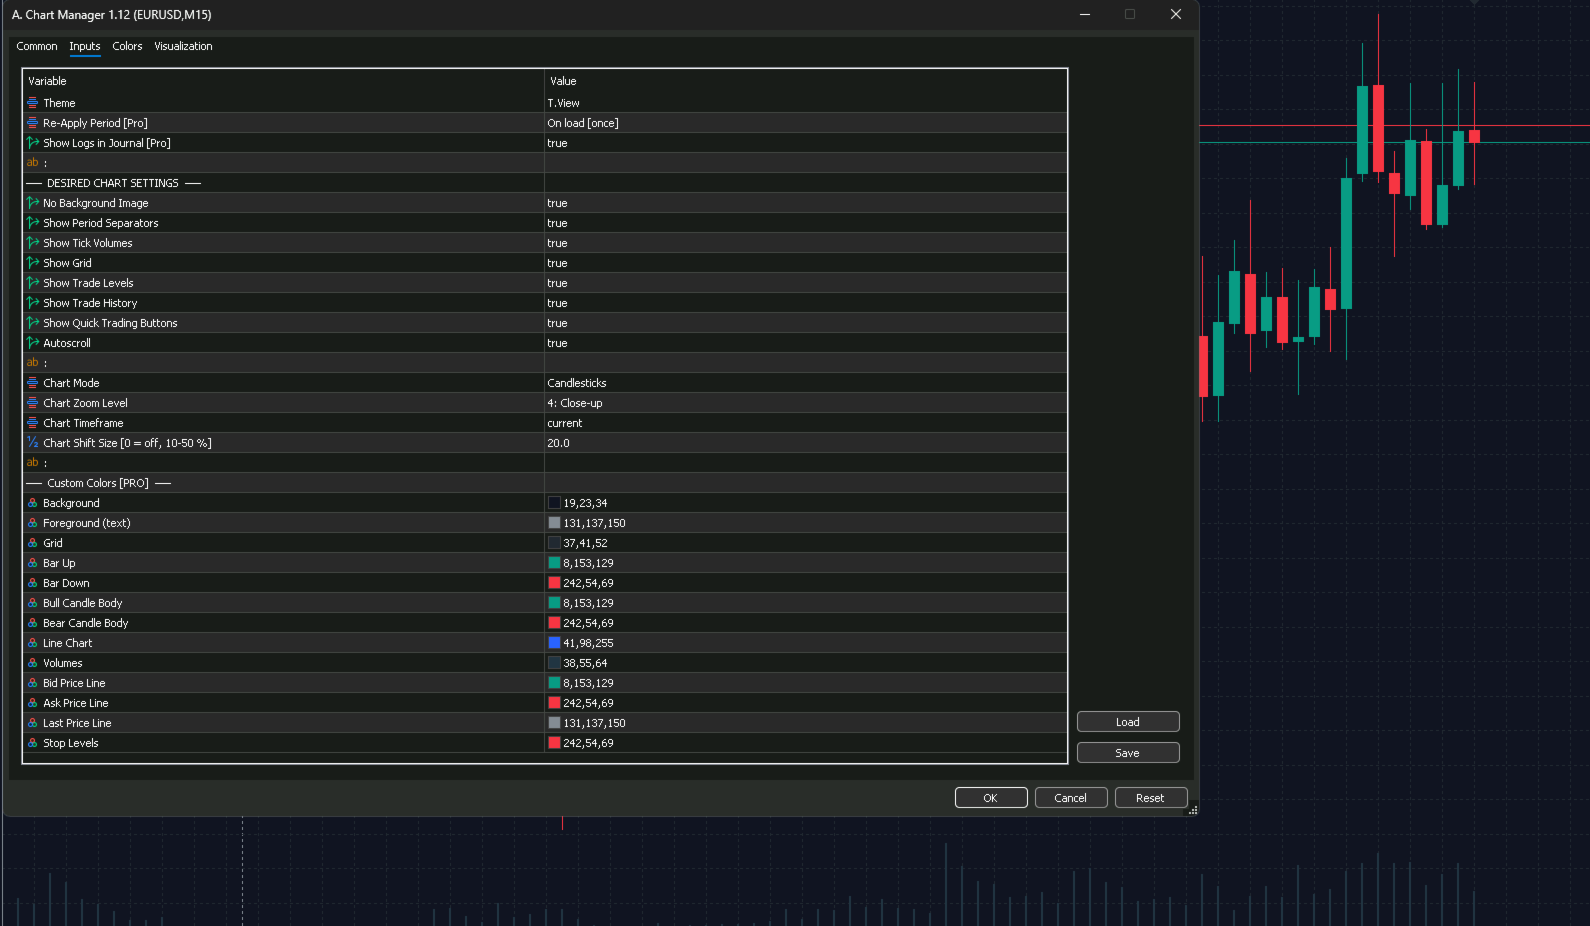
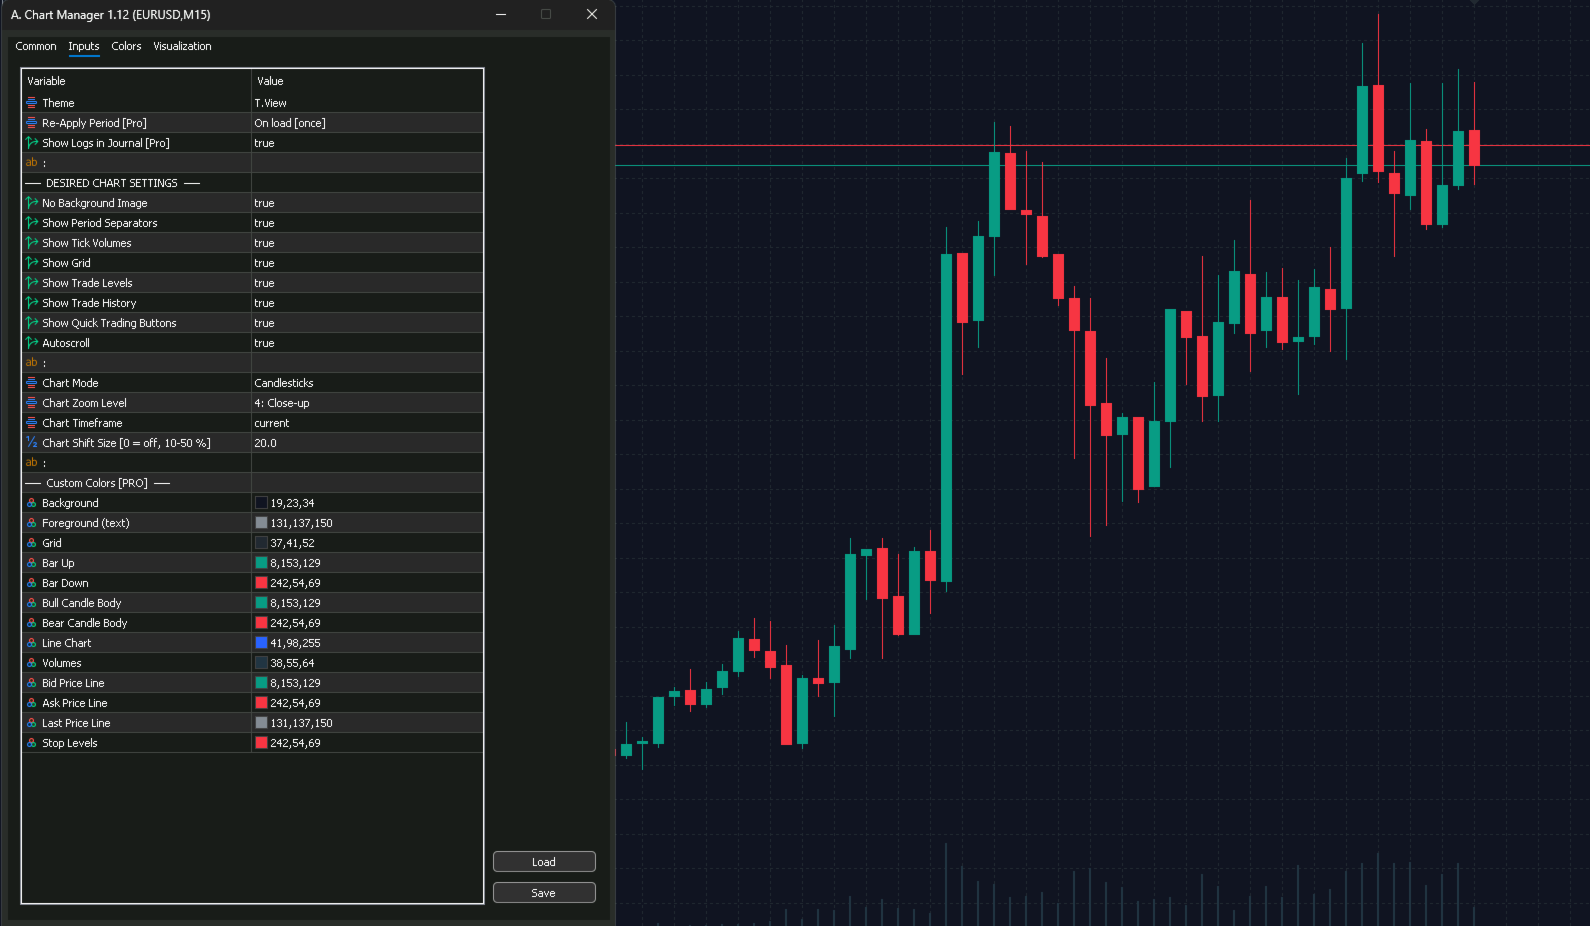
Custom Colors gives you thirteen colors to set: background, text, grid, bars up and down, bull and bear candle bodies, line chart, volumes, the bid, ask and last price lines, and stop levels. It starts from the T.View palette, so you only change what you want. The ready themes are T.View, Black, Dim, Light and White, and Current Colors leaves the colors untouched.
Re-apply on a schedule
Colors, settings and cleanup each have their own period: manually, 5 minutes, 15 minutes, 1 hour, 12 hours or every day. When a color or settings period comes round, your look is reapplied on your next click on the chart. Cleanup runs by itself when its period is due.
Cleanup that leaves panels alone
Pick the object types to remove: rectangles, labels, text, trend, horizontal and vertical lines, arrows including buy and sell signals, channels, Fibonacci tools and shapes. Each starts at Keep. Rectangle labels, which Expert Advisor panels are made of, are never removed, and pictures are only removed when they sit behind the chart.
Some Expert Advisors draw their panel text as labels. If you plan to remove labels, list that Expert Advisor's object prefix in Never Delete Prefixes first. Background Image starts at Remove; set it to As it is to keep yours.
Display, scales and layout
Turn period separators, grid, tick volume, trade levels, trade history, trading buttons, autoscroll, the open-high-low-close line, the bid, ask and last price lines and object descriptions on or off. You can also hide the price scale and the date scale, which the chart properties window does not offer. Chart mode, six zoom levels from Panoramic to Micro, timeframe and chart shift from 10 to 50 percent are all here, and each has As it is to leave it alone.
Applied when you click
Nothing changes the moment you attach it. A short line in the middle of the chart asks for a click, and your first click or key press applies everything. Change its inputs later and press OK, and the new settings apply at once.
How to start
- Drag Advanced Chart Manager from the Navigator onto the chart you work from.
- Choose your theme and settings in the Inputs tab, set Manage to All open charts if you want every chart, and press OK.
- Click that chart once.
Your charts keep the look you chose, and when something changes it, you know what it was.