 MetaTrader 5
 Experts
 Indicateurs
 Bibliothèque
 Utilitaires
 Widgets
 Règles
Regardez les tutoriels vidéo de Market sur YouTube
Comment acheter un robot de trading ou un indicateur
Exécutez votre EA sur
hébergement virtuel
hébergement virtuel
Test un indicateur/robot de trading avant d'acheter
Vous voulez gagner de l'argent sur Market ?
Comment présenter un produit pour qu'il se vende bien
Indicateurs techniques gratuits pour MetaTrader 5 - 61
 Les signaux provenant des indicateurs techniques jouent un rôle crucial dans l'ouverture et la clôture des transactions sur les marchés boursiers et les marchés forex. L'essence des indicateurs est une transformation mathématique du prix d'un symbole financier visant à prévoir les changements de prix futurs. Testez les indicateurs techniques pour mieux prédire le comportement du marché et en tirer profit.

Quantopro Plus: Skyrocket Your Trading Success Unleash the power of precision with Quantopro , the ultimate trading indicator for MetaTrader 5 that transforms market chaos into profitable opportunities. Engineered with a cutting-edge proprietary formula, Quantopro delivers crystal-clear buy and sell signals, empowering traders of all levels to dominate the markets with confidence. Why Choose Quantopro? Dynamic Signal Painting : Instantly spot high-probability trades with vivid, real-time signals
FREE

Англійська версія SMC Arbitrage Score PRO MT5 — трикутний кореляційний інтелект SMC Arbitrage Score PRO — це професійний математичний механізм для MetaTrader 5, розроблений для виявлення неефективності ринку за допомогою трикутного арбітражу . На відміну від стандартних індикаторів, які спираються на історію цін у минулому, цей інструмент розраховує «справедливу вартість» валютних триплетів у режимі реального часу для виявлення інституційних дисбалансів та «прихованих» потоків ліквідності.
FREE
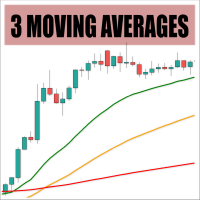
This is a customizable three-moving-averages indicator designed for crossover trading strategies. You can configure each moving average individually, including calculation method (e.g., exponential, simple), period, and price type, all from a single input dialog.
Parameters: Period <1,2,3> - Period of a moving average Shift <1,2,3> - Shift of a moving average Method <1,2,3> - Method of calculation for each moving average set separately Applied Price <1,2,3> - Set price type for calculations for
FREE

MQL5 PREMIUM INDICATOR
KIHAFY FVG PRO v7.0
Smart Money Fair Value Gap Scanner — ICT Concepts
FVG
AUTO DETECT 100
MAX SCORE A–D
GRADE SYSTEM 3×
CONFLUENCES OVERVIEW
Most traders miss Fair Value Gaps because they appear and disappear too fast.
KIHAFY FVG PRO catches every single one — scores it, grades it A through D, tracks its mitigation in real time, and alerts you instantly when price enters the zone. This is the FVG scanner built the way ICT traders ac
FREE

Spread Engine Nika — Analyse du Spread en Temps Réel pour MetaTrader 5 Spread Engine Nika est un indicateur professionnel d'analyse du spread pour MetaTrader 5. Il construit un profil statistique du spread pour n'importe quel symbole à partir de données de ticks historiques, affiche les conditions actuelles du spread en contexte et vous indique instantanément si le spread actuel est normal, élevé ou dangereux — le tout dans un panneau compact sur le graphique. Conçu pour les scalpers, les trader
FREE

The indicator ColorCandlesDaily draw candles with different colors depending on the day of the week.
FREE

Product Name: Sinwl Signal – Premium Price Action & Swing Trade Indicator (WinWiFi Robot Series) Overview: Unlock professional trading performance with "Sinwl Signal" , the latest innovation from the WinWiFi Robot Series . Specifically engineered for the CFD markets (Forex, Indices, Energy, and Crypto), this indicator solves the trader's biggest challenge: distinguishing between Trend and Sideway markets. Sinwl Signal filters out market noise, allowing you to catch profitable moves with precisio
FREE
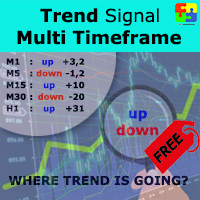
Free version. Only works on EURUSD Do you want to always know in a quick glance where price is going? Are you tired of looking back and forth between different timeframes to understand that? This indicator might just be what you were looking for. Trend Signal Multitimeframe shows you if the current price is higher or lower than N. candles ago, on the various timeframes. It also displays how many pips higher or lower current price is compared to N. candles ago. Number N. is customizable The data
FREE

Swing Detector — When You Think You Know Swings, Think Again
One of the key reasons many traders fail is their inattention to seemingly simple details they believe they’ve mastered. One such critical detail is the accurate identification of market swings (Swing Highs / Lows) on the chart. If you ask a group of traders to manually and consistently mark swing points on a chart, you'll find that more than half struggle to do it correctly . Not due to lack of knowledge, but because of mental fatigu
FREE

Tick Push Strength Indicator Catch rapid market momentum before the candle even closes. The Tick Push Strength Indicator tracks live order flow on a raw, tick-by-tick level. While standard indicators suffer from lag, this tool calculates the exact speed and volume pressure behind every micro-movement—giving you an instant visual of whether Bulls or Bears are driving the market. Key Highlights: Zero-Lag Analysis: Measures real-time tick velocity instead of waiting for candle closes. Breakout
FREE

The Missed Opportunity Analyzer is a professional historical analysis tool that identifies and visualizes high probability trading opportunities you missed in the past. Unlike predictive indicators, it provides 100% non-repainting hindsight analysis to help you study price behavior, refine your strategy, and improve your trading discipline. Core Concept The indicator scans historical data to find confirmed price swings where:
Price moved to your target (TP) before hitting your sto
FREE
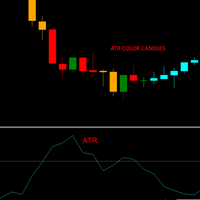
This indicator allows you to visually identify with a different color the candlesticks that exceed a certain limit of the ATR.
Just drag and drop it on the chart.
The user must enter the value of the ATR period.
The user must enter the value of the ATR limit with which he wants to identify the candlesticks.
In the colors tab, the user can select the colors with which to repaint the candles.
It is recommended that the first color always be None.
The second color corresponds to bullish c
FREE
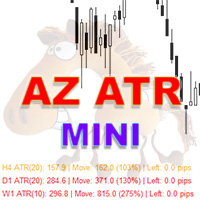
AZ Mini ATR Indicator
By popular demand, I've created a miniature version of the ATR indicator. In addition to its basic functions, such as calculating the average ATR based on specified parameters, it can change the color of a text bar depending on how far the price has already moved. If the price has moved more than 110% of its average ATR, the bar turns red; if it has moved less than 80%, the bar is green. The colors and parameters that influence the color change are configurable. This feat
FREE

Sentimento de Mercado é um indicador que usa os dados do nosso principal indicador: Market Strength Radar.: https://www.mql5.com/pt/market/product/114568?source=Site +Profile+Seller Ele imprime um gráfico de linhas que deve ser comparado com o gráfico de preço para entendermos o sentimento do mercado. As divergencias são pontos importantes de inflexão. As convergências mostram força da tendência atual.
FREE

**Experience Smarter Trading with FVG Super Signal**
Unlock simpler, more decisive trading with **FVG Super Signal**, an advanced MT5 indicator from the WinWiFi Robot Series. This powerful tool uniquely combines the Fair Value Gap (FVG) technique with robust trend-following logic.
* **Clear Signals:** Delivers intuitive Buy/Sell alerts, simplifying your trading decisions. * **Universal Compatibility:** Works seamlessly across all assets and timeframes. * **Highly Versatile:** Ideal for all tr
FREE
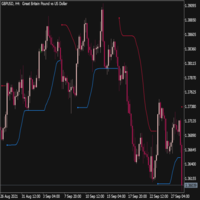
Trend Envelopes indicator is calculated based on a % of price change. That % is then used to determine if there is a new trend or trend remains the same.
This version is using Standard Deviation for the price change calculation instead and is adding prices smoothing prior to be used in calculations. The smoothing can be done using one of the 4 average types:
* Simple Moving Average
* Exponential Moving Average
* Smoothed Moving Average
* Linear Weighted Moving Average
Also, this
FREE
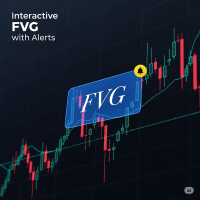
FVG Indicator with Alerts Description: This is a simple and effective indicator for identifying and displaying Fair Value Gaps (FVGs) on any timeframe. The indicator helps you see important price imbalances and provides powerful interactive tools for your analysis. Key Features: Detects FVGs: Clearly identifies and draws boxes around Bullish and Bearish Fair Value Gaps. Midline Level: Displays the 50% equilibrium level inside each FVG box, a critical point of interest. Complete Alert System: Rec
FREE
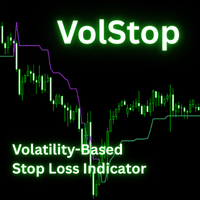
The VolStop Adaptive Volatility-Based Trailing Stop Indicator for MT5 VolStop is a precision volatility-stop indicator for MetaTrader 5, built for traders who want to stay in winning trades longer and exit with discipline. Instead of fixed pips or moving averages, VolStop dynamically tracks price action with ATR-based bands, automatically adapting to market turbulence. Key Features Adaptive Volatility Stops – Calculates a dynamic trailing stop using ATR and a user-set multiplier to match changi
FREE

Description of the Horizontal Levels Indicator with Manual Interval Adjustment The indicator is designed for automatic plotting of horizontal levels on the chart of a financial instrument. It allows users to manually set the interval between levels, making it adaptable to various trading strategies and timeframes. Key Features: Flexible Configuration : Users can define the interval between levels in points, percentages, or any other unit suitable for the selected asset. Automatic Plotting : The
FREE
Tired of adjusting the indicator settings losing precious time? Tired of the uncertainty regarding their efficiency? Afraid of the uncertainty in their profitability? Then the indicator ACI (automatically calibrateable indicator) is designed exactly for you. Launching it, you can easily solve these three issues just performing the simplest action: clicking a single Calibrate button. To achieve the highest efficiency, you should perform another additional action: move the power slider to the maxi
FREE

Displays previous months Highs & Lows. You can set the number of months to display levels for, also the line style, color and width. This is very useful for traders using the BTMM and other methods like ICT. I'll be creating more indicators for MT5 for the BTMM. Send me your suggestions to my Telegram: https://t.me/JDelgadoCR Take a look at my other products at: https://www.mql5.com/en/users/jdelgadocr/seller
FREE

AvSwingFinder is a free and lightweight indicator designed to help traders easily spot Swing Highs and Swing Lows on their charts. Features: Clear visualization of swing points Helps identify potential trend reversals Lightweight code, optimized for smooth performance Customizable parameter to define swing strength 100% free for all MetaTrader users How it works: AvSwingFinder uses a simple parameter to determine how many candles are required to confirm a swing. For example, if the paramet
FREE

Line Master – Trend Lines & Direction Arrows Line Master is a professional trend indicator for MetaTrader 5. It helps traders identify market direction by combining fast and slow trend lines and generating arrows at trend change points. Features: Slow Trend Line: Represents the overall market trend. Fast Trend Line: Responds quickly to short-term price changes. Color-Coded Lines: Uptrend: DodgerBlue Downtrend: Crimson Trend Arrows: Signals appear when the trend changes. Adjustable Inputs: Fast l
FREE

パラボリックのデータをもとにトレンドの方向性を1分足から月足まで表示します。 1分足から 月足 まで表示されているので今どの方向に価格が動いているのかがすぐに分かります。
更新はティク毎ではなくディフォルトでは1秒毎、もちろん変更も可能なのでチャートの表示が遅くなるようなことはありません。
機能:
どの通貨でも表示可能になります。
アイコンの色を指定することが可能になります。
表示位置(X軸、Y軸)が変更可能 になります。
表示位置 (左上 、 右上 、 左下 、 右下) が 指定 が可能 になります。
フォント を指定することが可能になります。
フォントサイズ が 変更可能 になります。
アイコンのサイズ が 変更可能 になります。
週足、 月足 の非表示 が 可能 になります。
FREE
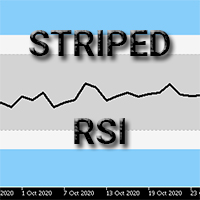
This indicator is a basic RSI but comes up with a useful feature.
You can set zones within the RSI and these zones can be displayed with different background colours. (You can see on the pictures below) You need to set the zone ranges and their colours at the input parameters. Six different zones can be set.
Should you have any questions or comments, feel free to contact me.
FREE
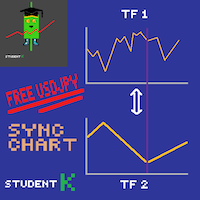
--- StudentK Sync Chart --- 1. Move charts at the same time 2. Cross check among different Symbols and Timeframes 3. Plan your own trading strategies
=== Simple (Free) Version ===
1. Allow USDJPY only
2. Support M5 and M15
3. * Contact StudentK for unlocking all timeframes *
--- Context --- StudentK is not indicated as a master or K Sir for knowledgeable person who claims for winning all the time. (But lots of traders should know the fact that it is rarely truth, especially in fluctuated per
FREE

Throw VolumeGap Mabrouk Identify Institutional Footprints with Precision Volume Analysis Overview VolumeGap is not just another volume indicator; it is a clinical trading tool designed to detect "Liquidity Surges" and "Institutional Entry Points." By analyzing the relative strength of every tick, this indicator pinpoint the exact moment when high-volume players enter the market, creating high-probability reversal and breakout opportun. LIMITED LAUNCH OFFER Current Price: $35 (Exclusive for the
FREE
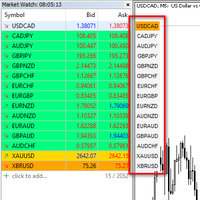
I want to quickly view the chart, so I created a small tool. I hope it can help you. Functions:
Use up/down arrow keys or mouse clicks to quickly open charts for currency pairs. Use left/right arrow keys to change the timeframe of the current chart. Automatically update the order based on the Market Watch
If you have any request or errors please tell me to help it better.
Donate us , Thank u!
Telegram: 0388894014
FREE
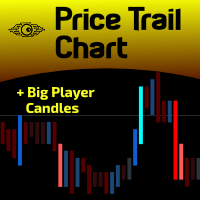
For those who hate candlesticks in lower timeframes (M1 through M15) we "invented" a clean new way to follow Price movement and displacement (volatility) called Price Trail Chart . The big "secret" is to get rid of those annoying candle wicks and draw the whole complete candle without them, this way we get a cleaner chart and a new view of the Price Path. No Open or Close markings, just LOW's and HIGH's, full body candle.
Additionaly we inserted a Volume monitor from our Best Downloaded indicato
FREE

ATR Accelerator Indicator informs you about strong price movements based on the ATR Indicator. This Indicator works for all Timeframes and Symbols, the strength of movements can be configured.
Important: Get informed about new Products, join our MQL Channel: https://www.mql5.com/en/channels/etradro
Useage This Indicator works for all Timeframes and Symbols, the strength of movements can be configured. Features works on all timeframes and forex pairs or indices. Alert and Notify function inc
FREE

Points Candles Osw
Il s'agit d'un indicateur de volatilité professionnel conçu pour quantifier le parcours exact des bougies en points. Grâce à un histogramme dynamique dans une fenêtre indépendante, il permet aux traders de visualiser le momentum et la force du prix, identifiant immédiatement les pics de volatilité et les niveaux de mouvement critiques.
Guide des paramètres (Menu des entrées) Show Points Candles Bullish : Active l'affichage des données correspondant aux bougies haussières. S
FREE
For support, visit cc.inni.cc where you will also find our Knowledge library and FAQ. PATHFINDER TREND is a complex, yet easy to manage trend indicator. It has various features that can aid in your decision making and boost your performance accuracy. Patfhinder Trend is a visually comfortable and user friendly tool that you should keep on your trading desk.
Key features Signal Detection & Trend Analysis Visually clear and decisive Early indication of signal direction with arrows Confirmed si
FREE
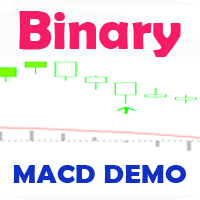
Индикатор, показывающий момент преодоления нулевой отметки индикатора MACD. Индикатор стрелочный и может быть использован для торговли бинарными опционами.
Входные параметры Period of SMA1 - Период 1 скользящей средней Period of SMA2 - Период 2 скользящей средней Period of SMA3 - Период 3 скользящей средней Inform about finding the signal - подавать уведомление, при нахождении сигнала
FREE

TITLE / OPENING PARAGRAPH: Spread Monitor displays your broker's live spread directly on the chart — updated every tick, color-coded by status, with an optional alert when the spread gets too wide. Know before you trade whether the spread is normal or dangerous. HOW IT WORKS: The indicator reads the current spread every tick and shows it as a colored panel on your chart: LOW — spread is within your normal range (green)
MID — spread is elevated, trade with caution (yellow)
HIGH — spread
FREE

CANDLE TIMER — Professional Market Description CANDLE TIMER is a lightweight and professional MetaTrader 5 indicator designed to help traders clearly see the remaining time before the current candlestick closes . Knowing when a candle will close is important for traders who analyze Price Action, SMC, Supply & Demand, Breakout, and Candlestick Patterns , because many trading decisions depend on the candle's closing price. KEY FEATURES ️ Real-Time Candle Countdown Displays the remaining time
FREE
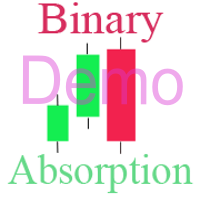
Бинарный индикатор находит свечной паттерн "Поглощение" и рисует соответствующий сигнал для входа рынок. Имеет встроенные фильтры и панель для просчета количества успешных сделок. Демо версия является ознакомительной, в ней нет возможности изменять параметры. Полная версия . Особенности Работает для всех валютных пар и любых таймфреймов. Индикатор рассматривает комбинацию из 2-х или 3-х свечей в зависимости от настроек. Имеется возможность фильтровать сигналы путем настройки количества свече
FREE

L’ Indicateur ATR Basé sur Heiken Ashi est un outil unique d’analyse de la volatilité qui combine l’ Average True Range (ATR) avec les calculs des chandeliers Heiken Ashi , offrant ainsi une mesure plus stable et fiable de la volatilité du marché. Contrairement à l’ATR traditionnel qui utilise des chandeliers standards, cet indicateur applique la formule Heiken Ashi pour filtrer le bruit du marché et fournir des signaux plus précis.
Principales caractéristiques : • Calcul de l’ATR basé sur Hei
FREE

"We have developed a highly accurate trading signal system applicable to all assets on the 15-minute (M15) timeframe. Calibrated against actual Gold price behavior, this system allows users to trade every candlestick effectively, regardless of market conditions—whether the market is trending, moving sideways, or reversing. The system features real-time arrows and color-coded indicators that signal immediate Buy or Sell entry points. This allows traders to use it as a reliable confirmation tool t
FREE
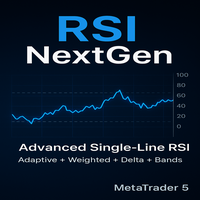
RSI NextGen Advanced RSI Indicator
The RSI NextGen is an advanced and modernized version of the classic Relative Strength Index (RSI). It comes with enhanced features that deliver far more accurate and reliable signals across different market conditions. This indicator has been designed to provide traders with a dynamic and adaptive view of overbought and oversold zones, instead of relying on the static and rigid settings of the traditional RSI.
Unlike the standard RSI, which is calculated us
FREE
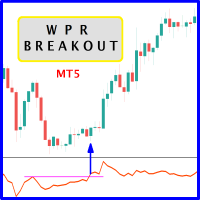
The likelihood of farther price movement increases when Larry Williams Percentage Range oscillator "WPR" breaks through its historical resistance levels in conjunction with prices breakout of resistance levels. It's strongly encouraged to confirm price breakout with oscillator breakout since they have comparable effects to price breaking support and resistance levels; similar perception is applied to short trades. Concept is based on find swing levels which based on number of bars by each side t
FREE

Market Trading Sessions is an indicator that identifies major market sessions such as:
London (09:00 - 18:00 UTC+2) New York (15:00 - 00:00 UTC+2) Sydney (23:00 - 8:00 UTC+2) Tokyo (02:00 - 11:00 UTC+2)
It displays each session’s start and end times, along with its high and low, providing traders with a clearer view of price volatility throughout the day. The indicator offers high customizability, allowing you to adjust session times and modify the plotting style to match your preference.
If yo
FREE
Purpose DG DayInfo is a free indicator that shows information about: Day's maximum prices; Day's minimum prices; Day's percentual variations; Daily candle direction (Up, Down or Flat); Candle timer; This way, DG DayInfo helps you to see day's maximum and minimum, check day's percentual variation and time left to close candle.
Key features Designed to be simple to use, with a few parameters Works in ALL pairs Works within ALL time frames*
Main Indicator Parameters Days - Set to how many days yo
FREE

Fair Value Gap Scanner LITE identifies institutional imbalances directly on your chart — no manual scanning, no guesswork. A Fair Value Gap forms when price moves so aggressively that a candle's range is skipped entirely, leaving an unfilled imbalance in the market. Smart money consistently returns to these zones, making them high-probability areas for entries, targets, and stop placement. What the indicator does: Scans H4 and D1 timeframes automatically Draws bullish and bearish FVG zones direc
FREE

Your feedback is very valuable to us. By sharing your experience, you help us improve and provide you with better service. Thank you!
PIPnova Candle Signals: Catch the Clearest Reversal Signals in the Market! PIPnova Candle Signals is a professional MetaTrader 5 indicator designed to instantly detect critical moments in price action—namely, potential trend reversals and points of indecision. It reliably catches the most powerful and trustworthy candle patterns, Pinbars and Dojis, with custo
FREE

Trade Details Tracker is a lightweight yet powerful chart-panel designed to give traders instant visibility into their open positions. Instead of checking multiple terminal tabs, this indicator displays real-time trade statistics directly on the chart , helping you manage risk, monitor exposure, and make faster decisions. Key Features Real-Time Trade Overview
Instantly view Buy & Sell trade counts for the active symbol. Automatic Breakeven Calculation
Volume-weighted breakeven
FREE

HiperCube Tornado est là ! Code de réduction de 20% sur Darwinex Zero : DWZ2328770MGM_20 HiperCube Tornado est un indicateur simple mais efficace qui vous aide à identifier quand un nouveau pouvoir haussier ou baissier est proche.
Facile à utiliser Couleurs personnalisées Indicateur de fenêtres séparées TEMA est utilisé pour faire des calculs Périodes personnalisées Méthode personnalisée Chat GPT et IA utilisés pour se développer Stratégie Attendez que TI+ croise le TI- Cela signifie, signal d
FREE

MACD and Price Structure Confluence Indicator The indicator is based on the principles of the MACD in its formula , combined with price structure, support, and resistance levels identified on the D1 (Daily) timeframe . The regions identified by the system are represented by dashed lines extending across the entire chart , allowing users to visually monitor important levels within the market structure. The system's studies and analysis were primarily conducted using the M30 (30-minute) timeframe
FREE

Chaikin Money Indicator (CMF) – Free Trading Indicator
The Chaikin Flow Indicator (CMF) is a technical analysis tool based on the original Chaikin Money Flow (CMF) indicator, developed by Marc Chaikin in the 1980s. It is designed to track capital flows into an asset and helps identify buying and selling pressure. This indicator is useful for both intraday trading and medium-term analysis .
How CMF Works CMF analyzes price action and volume over a given period by calculating the Money Flow Mult
FREE

Description The Profit and Loss Indicator by Creative Tech Solutions is a robust and comprehensive tool designed to help traders monitor their trading performance in real-time. This indicator provides detailed metrics on profits and drawdowns, ensuring traders are always informed about their trading activities and performance. With customisable alerts and display settings, this indicator is an essential tool for any serious trader. Features Real-Time Metrics : Monitor profit and drawdown percent
FREE

TerminalBridge Account Analytics is an on-chart account statistics indicator for MetaTrader 5.
It organizes closed trading activity into day, week, month, quarter and year views. Account-wide records include all symbols by default.
Main features
- Live floating profit or loss - Recorded daily maximum floating loss - Floating-loss percentage, occurrence time and data status - Today, All, Last 1 Month, Last 3 Months and Custom history ranges - Built-in calendar for custom date selection - Filt
FREE

//////////////////////////////////////////////// //////////////////////////////////
An improved version of the standard Bulls Power and Bears Power indicators.
Now it's two in one.
The setup is simple - you just need to specify the period. It is also very easy to understand the readings of this indicator, a signal above zero is a buy, and below it is a sell.
//////////////////////////////////////////////// ///////////////////////////////////
I hope this indicator will be very useful to you
FREE
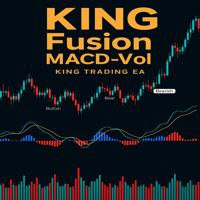
- وصف المنتج - مؤشر احترافي متكامل
لا يعد KING Fusion MACD-Vol من KING TRADING EA مجرد MACD آخر — فهو عبارة عن مجموعة أدوات تداول كاملة تجمع بين مؤشرات احترافية متعددة في نافذة فرعية واحدة أنيقة. لم تعد بحاجة إلى تحميل مخططك بأدوات منفصلة. يجمع هذا المؤشر بين:
MACD مع خطوط مزدوجة ورسم بياني مكبر
رسم بياني ملون ومثبت بالحجم
ملصقات ديناميكية مع قيم المؤشرات في الوقت الفعلي (ATR، ADX، RSI، Volume)
عداد تنازلي للبار
التنبيهات المتقاطعة (مرئية + صوتية)
كل ما تحتاجه من الوضوح والسرعة والدقة -
FREE

A ideia do indicador é mudar de cores assim que o candle viole a banda; Caso o candle viole a banda superior, pinta o candle de vermelho, Caso o candle viole a banda inferior , pinta o candle de verde, Se o candle passar em algum momento pela média, ele assume uma cor acinzentada; Os candles que não passem pela média, nem violem a banda, apresentarão cor verde fraca, se for de alta e cor vermelha fraca se for de baixa. Projeto concebido no canal Aprenda a programar, keltner cores.
FREE

The idea behind this indicator is to find all currency pairs that are over-bought or over-sold according to the RSI indicator at one go.
The RSI uses the default period of 14 (this can be changed in the settings) and scans all symbols to find the RSI level you will have specified. Once currency pairs that meet the specification are found, the indicator will open those charts for you incase those charts aren't open and proceed to write the full list of currencies on the experts tab.
FREE
Este indicador foi desenvolvido para auxiliar na tomada de decisão em operações de compra e venda. Ele realiza uma análise minuciosa baseada em um cálculo complexo que leva em conta múltiplos fatores do mercado. A partir dessa análise, o indicador gera um ponto visual que representa, de forma clara e objetiva, a direção sugerida – seja de entrada ou saída de uma posição. Sua principal função é fornecer ao trader uma leitura simplificada de dados sofisticados, facilitando o entendimento do moment
FREE

This is a FREE Trend Direction Indicator for MetaTrader 5.
Features:
Identifies market trend direction
Uses EMA 50 and EMA 200
Non-repainting logic
Clear visual display
Suitable for manual trading
Free version includes:
- Single timeframe
- Trend direction only
- No alerts
If you need:
Alerts
Multi-timeframe version
EA automation
Custom modifications
My Name is Khalaf Hamza , You can contact me for freelance work --> khalaf.hamza.hi@gmail.com
FREE

Quantum DivDash — Multi-Indicator Divergence Dashboard for MetaTrader 5 Quantum DivDash is a technical analysis indicator for MetaTrader 5. It is designed to help traders detect and monitor regular and hidden divergences directly on the chart through a clean dashboard interface. The indicator analyzes price pivots and compares them with selected technical indicators to identify possible bullish and bearish divergence structures. It can work with several popular indicators, including MACD, MACD H
FREE
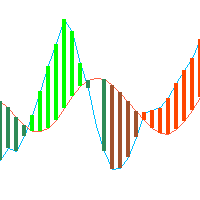
This is just a ADX with multi symbols, multi timeframes, and colors. features. different symbols and timeframes from the main chart. draw ADX and ADX moving average. easy to identify if ADX is above 25 or not. e asy to identify if ADX is above moving average or not. easy to identify the direction of the trend by color, not by DI line. unnecessary DI lines can be erased
FREE

PFG Risk Meter The PFG Risk Meter is a free companion indicator for the PropFirmGuardian EA Suite . It displays real-time daily and total drawdown as visual gauge panels on your chart, giving you instant visual feedback on your prop firm rule status. Features Live daily drawdown gauge Live total drawdown gauge Color-coded warning and danger zones Works on any symbol and timeframe Designed to run alongside the PropFirmGuardian EA Requirements This indicator is part of the PropFirmGuardian EA Suit
FREE

Custom Panel allows you to gather all kind of important information and display it as one handy table in the upper right corner of the chart.
You can choose the contents of the panel yourself. Every row will show your own customized condition or value. Every column shows a different timeframe. The panel may contain up to 10 rows and up to 8 columns. Sample usage Row : Price > EMA(30)
Mode : YES_NO
Meaning : is current price above EMA(30)
Row : Ask < Bands[L]
Mode : YES_NO
Meaning : is current a
FREE

FlagTrendTF Free Indicator for MetaTrader 5 FlagTrendTF is a free MetaTrader 5 indicator designed to help traders identify market trends across multiple timeframes quickly and visually. It is ideal for confirming whether the market direction is aligned from higher timeframes down to the trading timeframe. How FlagTrendTF Works The indicator allows you to monitor up to 4 timeframes simultaneously , displaying easy-to-read arrows: Green arrow : bullish trend Red arrow : bearish trend This fa
FREE

If you are Looking Best indicators in Mql5 Market. Check these out!
SSS Scalping Smart Signals MT5 Indicator
Scalping Winning Signals Pro SWS
LTL Long Trend Locator
The Ultimate FXIFY Challenge Protection Dashboard for MetaTrader 5 Trade with Confidence. Stay Within the Rules. Pass Your FXIFY Challenge. Passing an FXIFY challenge requires more than profitable trading—it requires strict compliance with the firm's risk management rules. Many traders lose their funded opportunity not because o
FREE
RSIBandsTREND is a custom trend-focused indicator that enhances the classic RSI approach by visualizing dynamic upper and lower bands based on RSI calculations.
It plots three clean bands (upper, lower, and midline) directly on the chart, helping traders identify overbought and oversold zones with precision. Features: Three-band system: upper, lower, and center RSI lines EMA-smoothed RSI band calculation Clear trend zone visualization on chart Works on all timeframes (M1 to Monthly) Ideal
FREE

Bollinger Breakout with Stop-Loss Levels Description This indicator tracks breakouts of the upper and lower Bollinger Bands and automatically displays dynamic entry lines and stop-loss levels on the chart. The lines dynamically extend to the current candle, allowing visual tracking of signal relevance. Key Features 1. Color Coding Upper Breakout (BLUE) – buy signal (bullish breakout) Lower Breakout (RED) – sell signal (bearish breakout) 2. Dynamic Lines Breakout and stop-loss lines autom
FREE

A simple indicator showing the size of the spread at the current time, the maximum for the day and the maximum for the entire duration of the indicator.
Daily statistics of the maximum spread are also displayed, indicating the time when this spread was fixed.
The location of the display of the received information can be changed depending on your preferences and positioned anywhere on the screen.
It is possible to output alerts about exceeding the size of the spread specified in the input pa
FREE

MT5 Enveloping Pattern Detector: Your competitive advantage in trading Are you looking for a tool to help you accurately identify the best trading opportunities in the forex market? Our Engulfing Pattern Detector provides you with a highly reliable buy or sell signal, based on one of the most recognized and effective Japanese candlestick patterns: the engulfing pattern. With an average success rate of 70%, this indicator will allow you to make safer and more profitable investment decisions. Don'
FREE

The indicator plots a curve of the difference between the values of two trading instruments (currency pairs).
The purpose of the indicator is to observe the processes of divergence and convergence of the values of two trading instruments. The results obtained can be used for trading strategies of statistical arbitrage, pair trading, correlation, and others.
Trading strategy
The indicator is attached to the chart of any trading instrument. In the input parameters, the names of trading instr
FREE

SATORI Monthly Trade Statistics V15 Overview :
An MQL5 Expert Advisor for MetaTrader 5 that visualizes trading performance by month and week, offering a customizable interface to track profits. Key Features : Profit Tracking : Displays monthly and weekly profits, color-coded (green for positive, orange for negative). Customizable : Set time range, magic number, font size, and button sizes; hide zero-profit months. Interactive UI : Toggle month details, update profits, and adjust display scale wi
FREE

Executive Summary Total Profit Buy/Sell Indicator is a comprehensive real-time dashboard that displays all your trading statistics in one organized panel. Perfect for traders who want instant visibility of their positions, profits, and market conditions without switching between multiple windows. Key Features Complete Position Overview Profit by Direction : Separate tracking of Buy vs Sell profits Lot Size Monitoring : Total volume in both directions Position Count : Number of ac
FREE

OVERVIEW
The Fibonacci Moving Averages are a toolkit which allows the user to configure different types of Moving Averages based on key Fibonacci numbers.
Moving Averages are used to visualise short-term and long-term support and resistance which can be used as a signal where price might continue or retrace. Moving Averages serve as a simple yet powerful tool that can help traders in their decision-making and help foster a sense of where the price might be moving next.
The aim of this scrip
FREE
Découvrez comment acheter un robot de trading sur le MetaTrader Market, le magasin d'applications de la plateforme MetaTrader.
e système de paiement de MQL5.community prend en charge les transactions via PayPal, les cartes bancaires et les systèmes de paiement populaires. Nous vous recommandons vivement de tester le robot de trading avant de l'acheter, pour une meilleure expérience client.

Vous manquez des opportunités de trading :
- Applications de trading gratuites
- Plus de 8 000 signaux à copier
- Actualités économiques pour explorer les marchés financiers
Inscription
Se connecter
Vous acceptez la politique du site Web et les conditions d'utilisation
Si vous n'avez pas de compte, veuillez vous inscrire