Market Condition Evaluation based on standard indicators in Metatrader 5 - page 187
You are missing trading opportunities:
- Free trading apps
- Over 8,000 signals for copying
- Economic news for exploring financial markets
Registration
Log in
You agree to website policy and terms of use
If you do not have an account, please register
Forum on trading, automated trading systems and testing trading strategies
Press review
Sergey Golubev, 2016.08.30 07:13
AUD/USD Intra-Day Fundamentals: Australia Building Approvals and 15 pips price movement
2016-08-30 01:30 GMT | [AUD - Building Approvals]
if actual > forecast (or previous one) = good for currency (for AUD in our case)
[AUD - Building Approvals] = Change in the number of new building approvals issued.
==========
==========
AUD/USD M5: 15 pips range price movement by Australia Building Approvals news event
Forum on trading, automated trading systems and testing trading strategies
Forecast for Q3'16 - levels for Brent Crude Oil
Sergey Golubev, 2016.08.31 17:10
U.S. Commercial Crude Oil Inventories news event: intra-day bearish breakdown, daily ranging correction
2016-08-31 14:30 GMT | [USD - Crude Oil Inventories]
[USD - Crude Oil Inventories] = Change in the number of barrels of crude oil held in inventory by commercial firms during the past week.
==========
"U.S. commercial crude oil inventories (excluding those in the Strategic Petroleum Reserve) increased by 2.3 million barrels from the previous week."
==========
Crude Oil M5: bearish breakdown. The price was bounced from 100 SMA to below for the bearish breakdown:
If the price breaks 48.33 resistance level so the reversal of the intra-day price movement to the primary bullish market condition will be started.If the price breaks 47.31 support so the intra-day primary bearish trend will be continuing.
If not so the price will be on ranging within the levels.
==========
Crude Oil Daily: daily correction. The price is breaking descending triangle pattern together with 48.21 support level to below for the daily correction. The price is testing 100 SMA value at 47.48 to below for the correction to be continuing in the secondary ranging way.
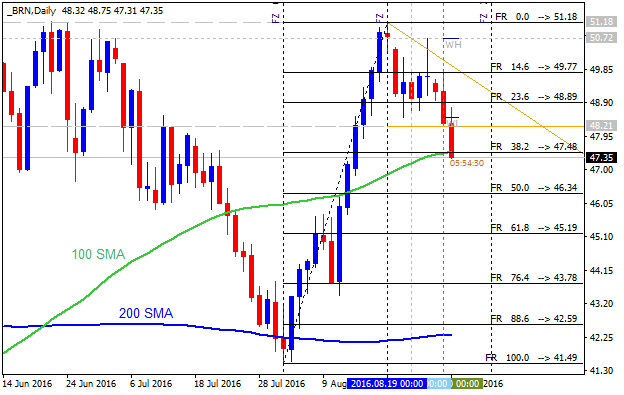
If the price breaks 51.18 resistance on close daily bar so the primary bullish trend will be resumed.If the price breaks 47.48 support level on close daily bar so the secondary correction within the primary bullish trend will be continuing.
If the price breaks 41.49 support level on close daily bar so the primary ebarish reversal will be started.
If not so the price will be on ranging within the levels.
Forum on trading, automated trading systems and testing trading strategies
Forecast for Q3'16 - levels for DAX Index
Sergey Golubev, 2016.09.01 11:28
Dax Index Technical Analysis 2016, September: bullish breakout to be continuing or ranging for direction
Daily price is located above Ichimoku cloud in the bullish area of the chart: the price is testing 10,686.2 resistance level together with ascending triangle pattern to above for the bullish trend to be continuing with 10,803.8 resistance as a nearest bullish target to re-enter. Absolute Strength indicator is evaluating the bullish trend to be continuing in the near future.
Weekly price is on the breakout with the bullish reversal since the beginning of July this year: price is testing 10,803.8 level to above for the bullish trend to be continuing.
If W1 price breaks 10,803.8 resistance level on close bar from below to above so the bullish breakout will be continuing.If W1 price breaks 10,089.1 resistance level on close bar from above to below so the bearish reversal of the weekly price movement will be started.
If not so the price will be on ranging within the levels waiting for direction.
SUMMARY : bullish
Forum on trading, automated trading systems and testing trading strategies
Something Interesting
Sergey Golubev, 2016.09.01 17:17
Paramon Trading System
The history of the development.
Paramon is username of the trader who created this system long time ago for Metatrader 3 (Metatrader 4 and Metatrader 5 did not exist in that time - it was very long time ago). Paramon named his system Paramon Scalping (but as we see - it is not real scalping). He did not use any indicators and he traded just price action only using M5 timeframe charts (MT3).
Later on - the other traders created indicators for MT3 and MT4 to use this system (Maksigen indicators or/and Paramon indicators) just because they could not trade live without any indicator (having just price only on the chart). For now - Paramon indicators were converted to MT5.
Paramon is legendary person and he was the first trader in our Metatrader world who started to trade breakout systems live on real account without any indicators placed on the chart.
We should always remember the people who were the first.
--------------
How to Trade and Free to Download
Paramon Trading system Part #1 (download indicators and template)
Paramon Trading system Part #2 (How to Trade)
Paramon Trading system Part #2 continuing (Pending order execution and stop loss placing)
Paramon Trading system Part #2 continuing (moving the stop loss by the trailing stop)
Paramon Trading system Part #2 continuing (Breakeven)
Forum on trading, automated trading systems and testing trading strategies
Press review
Sergey Golubev, 2016.09.02 14:48
Intra-Day Fundamentals - EUR/USD, USD/JPY, AUD/USD and NZD/USD: Non-Farm Payrolls
2016-09-02 12:30 GMT | [USD - Non-Farm Employment Change]
if actual > forecast (or previous one) = good for currency (for USD in our case)
[USD - Non-Farm Employment Change] = Change in the number of employed people during the previous month, excluding the farming industry.
==========
"Total nonfarm payroll employment increased by 151,000 in August, and the unemployment rate remained at 4.9 percent, the U.S. Bureau of Labor Statistics reported today. Employment continued to trend up in several service-providing industries."
==========
EUR/USD M5: 91 pips price movement by Non-Farm Payrolls news event
==========
USD/JPY M5: 62 pips price movement by Non-Farm Payrolls news event
==========
AUD/USD M5: 58 pips price movement by Non-Farm Payrolls news event
==========
NZD/USD M5: 65 pips price movement by Non-Farm Payrolls news event
Forum on trading, automated trading systems and testing trading strategies
EURUSD Technical Analysis 2016, 04.09 - 11.09: ranging near bearish reversal
Sergey Golubev, 2016.09.03 13:40
Daily price is located in the bullish area of the chart to be near and above Senkou Span line of Ichimoku indicator on the border between the primary bearish and the primary bullish trend.
- The price is testing 1.1122 support level to below for the bearish reversal to be started.
- Chinkou Span line of Ichimoku indicator is located near and above the price indicating the possible breakdown to be started in the near future.
- Absolute Strength indicator is estimating the bearish reversal.
- Symmetric triangle pattern was formed by the price, and if the price breaks this pattern to above together with 1.1365 resistance level so the primary bullish trend will be resumed.
If D1 price breaks 1.1122 support level on close bar so the reversal of the daily price movement to the primary bearish market condition will be started with 1.0951 lever as a nearest daily target.If D1 price breaks 1.1365 resistance level on close bar from below to above so the bullish trend will be resumed.
If not so the price will be on bullish ranging within 1.1365/1.1122 levels.
SUMMARY : ranging near bearish reversal
TREND : rangingForum on trading, automated trading systems and testing trading strategies
AUDUSD Technical Analysis 2016, 04.09 - 11.09: ranging correction to the bearish reversal
Sergey Golubev, 2016.09.03 15:10
Daily price was on the secondary correction within the primary bullish market condition: the price was bounced from 0.7489 support level to above for the ranging condition to be started. For now, the price is on ranging within the following support/resistance levels:
Absolute Strength indicator is estimating the ranging bullish market condition to be continuing in the near future.
If D1 price breaks 0.7489 support level on close bar so the secondary correction within the primary bullish trend will be resumed with the ranging way: the price will be located inside Ichimoku cloud in this case.
If D1 price breaks 0.7407 support level on close bar so the reversal of the price movement from the ranging bullish to the primary ebarish market condition will be started.
If D1 price breaks 0.7691 resistance level on close bar from below to above so the bullish trend will be resumed with 0.7755 nearest bullish target to re-enter.
If not so the price will be on bullish ranging within the levels.
SUMMARY : bullish
TREND : rangingThe most interesting pair you can make money with - EUR/NZD
EUR/NZD: bearish breakdown. This pair is on bearish market condition condition for the breakdown to be started on open daily bar for now: the price is breaking 1.5218 support level to below for the breakdown to be continuing. Chinkou Span line of Ichimoku indicator is located below the price indicating the bearish trend to be continuing on good breakdown way.
The most likely scenarios for the price movement for the week:
If daily price breaks 1.5218 support level to below on close bar so the daily breakdown will be continuing with 1.5113 bearish target to re-enter, if not so the price will be on bearish ranging within the levels.
There are the following news events which will be affected on EUR/NZD price movement for the coming week:
Next setup.
For M1 and M5 timeframe.
I call it PriceChannel ColorPar Ichi
AUDUSD:
GBPUSD:
USDJPY:
hi i just try to download the indicator but it didnt appear exactly the way it is in the screen you showThis post?
Two indicators and two templates are in zip archive on this post. So, download it, unzip, and
And you will have the charts which may be similar with this one:
The rules: