Something Interesting - page 20
You are missing trading opportunities:
- Free trading apps
- Over 8,000 signals for copying
- Economic news for exploring financial markets
Registration
Log in
You agree to website policy and terms of use
If you do not have an account, please register
Forum on trading, automated trading systems and testing trading strategies
how to set moving average apply to ""PREVIOUS INDICATOR'S DATA"" in MT4
Sergey Golubev, 2016.08.05 06:38
1. Attach your first indicator to the chart to separate window, for example - Stochastics:
2. Find Moving Averages indicator in Navigator and move this indicator by mouse to the separate window of the chart (it will be the second indicator on that separate chart as Stochastic indicator alrady exists there)
3. And you will see 2 indicators in one separate window:
Very usefull tool: Order Closer Scripts - script for MetaTrader 4
Hi Guys:
Three basic scripts tools for you guys to play around with basically they are order closers that are irrespective of chart and directed to look at the open orders in the Terminal Trade Section.
- CloseAllOrders : Well noobs what do ya think it does? You're Right thats what it does! It closes all your open orders silultainiously. "Its a Nuke"........ LOL
- CloseAllProfit : This one's a little more selective, it closes only those open orders that are showing positive profit silultainiously. "Cash Collector".......Like Tony Soprano only nicer
- CloseAllLosses: OK heres the deal with this one, nobody likes to accept a loss willingly but sometimes it just has to happen, this one closes all your losing positions silultainiously. "Cut and Run"
THEY ARE ALL CHART IRRESPECTIVE IT DOEST MATTER IF YOU HAVE MULTIPLE TRADES ACROSS 20 DIFFERENT PAIRS THESE SCRIPTS WILL AFFECT EACH ONE SIMULTAINIOUSLY BASED ON THEIR PROFIT OR LOSS OR IN THE CASE OF "CLOSEALLORDERS" ALL OF THEM.
Genie RSI - expert for MetaTrader 4
This is the EA based on RSI indicator and on one kind of the RSI signals only: on overbought/oversold levels. It means the following:
We can attach RSI indicator to the chart just to understand about how it works:
The settings/parameters of RSI indicator are the following:
We can backtesting this EA (1 week statement for statement for EURUSD H4 is attached):
-------------
This is interesting EA especially for newbies, and for professional traders/programmers as well - because this EA can easily be improved and developed more on the way we want.
There are some situations when you are backtesting EA with result #1, after that - you can backtest same EA with same settings for the same period of time with the result #2 ... if everything is same so why the results may be the difference?
The results should not be the difference ones. That is because the pairs/symbols were not prepared for backtesting and for trading. because we should make this preparation by ourselves (MT4 will not do it for us for example). So, we are having the following steps:
How to prepare the symbol in Metatrader 4 for backtesting/optimization and for trading -
Forum on trading, automated trading systems and testing trading strategies
problem with history center on MQL4 --> losing data for 4 days
Sergey Golubev, 2016.08.05 12:36
'"download GU pair" means - place it on MT4 chart? or export the data?
If on the chart so this is my example:
- open History Center (Tools - History Center);
- find GBPUSD for example:
- double mouse click on all the timeframes there for this pair (1 Minute, 5 Minute, and so on), the data will be downloaded from the server to the History Center:
- open GBPUSD chart, M1 timeframe, right mouse click on the chart and select "Refresh", M5 chart and Refresh, and so on up to MN timeframe. And the data from History Center will be loaded to the chart (for backtesting or for trading), and you can see it:
Forum on trading, automated trading systems and testing trading strategies
Something Interesting
Sergey Golubev, 2016.01.27 12:41
Just some example about how to solve An array is out of range issue (I personally had this issue few times so it may be good to read the thread about how we can solve this our error during the coding for example).Average Directional Movement Index (ADX)
Developed by J. Welles Wilder
The ADX is a momentum indicator used to determine the strength of a price trend; it is derived from the DMI –Directional Movement Index which has two indicators
ADX is calculated by subtracting these two values and applying a smoothing function, example a function of ten to come up with a 10 period ADX.
The ADX is not a directional indicator but a measure of the strength of the trend. The ADX has a scale of Zero -100.
ADX indicator combined with DMI- Directional Movement Index
Technical Analysis of ADX indicator
Buy Signal
- A buy signal is generated when the +DI is above –DI, and the ADX is above 20
- The Exit signal is generated when the ADX turns down from above 30.
Sell Signal-------
ADX - Average Directional Index
This lesson describes the ADX with the DI+ and DI- Directional Indicators, and also shows how they are commonly use
Forum on trading, automated trading systems and testing trading strategies
Something Interesting
Sergey Golubev, 2016.06.26 07:07
How To Trade: ADX 50 trend trading strategy (adapted from the article)
Finding a strong directional move is the first priority of any trend trader. However, when having to select a currency pair to trade, it can be difficult to identify the best trends. For the ADX 50 strategy we will be using the ADX (Average Directional Index) indicator for this process. First, add a 14 period ADX to the 4Hour chart, using Daily periods.
Remember, ADX is not identifying the direction of the trend, only its intensity. If a currency pair’s trend is weak or if the pair is consolidating, ADX will read significantly lower than a strong directional market. For the ADX 50 strategy, we will only be looking for currency pairs with an ADX value of over 50! If Daily ADX reads over 50, you can then begin to move to the execution phase of the strategy.
Once a strong trend is found, it is time to plan an entry into the market. The ADX 50 trend trading strategy uses an RSI (Relative Strength Index) indicator with a 14 period setting on a 4Hour chart.
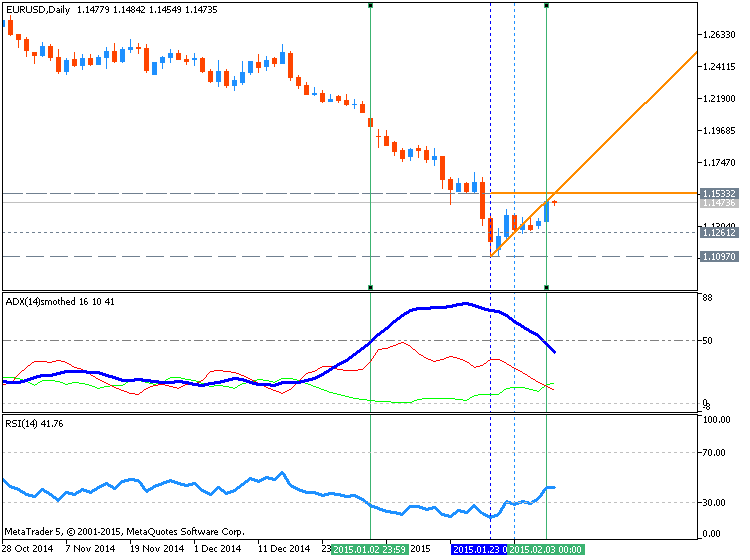
In a downtrend, new sell positions should be entered only when ADX reads over 50 and RSI closes below 30 (oversold). Conversely buy positions will be initiates when ADX reads over 50 and RSI closes above 70.Traders should always have a plan for managing their position. Eventually trends will come to an end and any existing trades should be exited. When initiating a buy order, stop orders should be placed at a 14 period low on the 4Hour chart. That way if a new low is created, all existing buy trades will be closed. Conversely if a trader is selling in a downtrend, stops can be placed at a 14 period high again using the 4Hour chart.
Forum on trading, automated trading systems and testing trading strategies
Something Interesting
Sergey Golubev, 2016.01.17 19:42
Just one forecasting indicator:
MT5 version is more good to be used (concerning the prediction etc) than MT4 version (I tried both of them).
This is interesting indicator especially for Moving Average systems lovers (coded by FX Sniper):
LSMA in Color - indicator for MetaTrader 4
The indicator is build on the basis of moving averages. Its main feature is entering/leaving signal - the indicator's line is colored in a certain color signaling for the user to buy or to sell. The accuracy of the signal is very high. If even you don't enter the market using this indicator, it will ideally suit you to help close your positions.
This is interesting indicator which can be very usefull for the technical analysis for example.
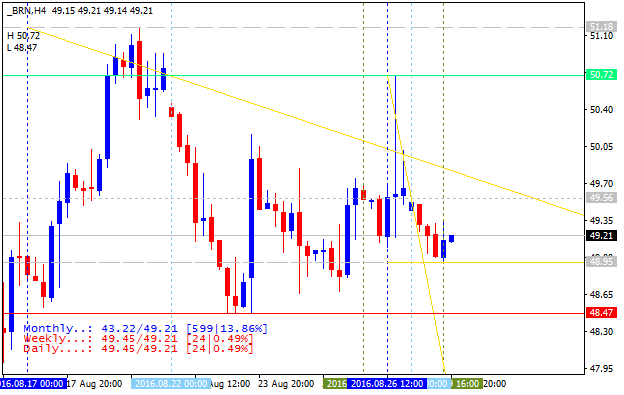
Percentage - indicator for MetaTrader 4The problem arise when I want to know what is current daily percentage gain/loss at current price in this moment. Then I found the solutions to display current daily, weekly, monthly percentage gain in terminal windows. This will help me to know if current price is overbought or oversold at this time because certain pair only has certain daily, weekly, monthly price range.
It show current daily, weekly, and monthly percentage gain. This indicator color could be modified as you like in the indicator parameter, in this example: red is minus percentage gain and blue is plus percentage gain.
This is Brent Crude Oil (as we see - the oil price was increased by 13.86% for this month):
Bovespa Index was increased by 3.79% in a month and by 1.96% for the week:
FTSE 100 index :