Something Interesting in Financial Video November 2013 - page 5
You are missing trading opportunities:
- Free trading apps
- Over 8,000 signals for copying
- Economic news for exploring financial markets
Registration
Log in
You agree to website policy and terms of use
If you do not have an account, please register
This lesson describes the ADX with the DI+ and DI- Directional Indicators, and also shows how they are commonly use
Forum
Indicators: Average Directional Movement Index (ADX)
newdigital, 2013.09.26 13:06
Average Directional Movement Index (ADX)Developed by J. Welles Wilder
The ADX is a momentum indicator used to determine the strength of a price trend; it is derived from the DMI –Directional Movement Index which has two indicators
+DI- Positive Directional indicator
–DI - Negative Directional Indicator
ADX is calculated by subtracting these two values and applying a smoothing function, example a function of ten to come up with a 10 period ADX.
ADXThe ADX is not a directional indicator but a measure of the strength of the trend. The ADX has a scale of Zero -100.
The higher the ADX value the stronger the trend.
ADX value below 20 indicates that the market is not trending but moving in a range.
ADX value above 20 confirms a buy or sell signal and indicates a new trend is emerging.
ADX value above 30 signifies a strong trending market.
When ADX value turns down from above 30, it signifies that the current trend is losing momentum.
ADX indicator combined with DMI- Directional Movement Index
Since the ADX alone is a directionless indicator it is combined with the DMI index to determine the direction of the currency pair.
When the ADX is combined with DMI index a trader can determine the direction of the trend and then use the ADX to determine the momentum of the forex trend.
Technical Analysis of ADX indicator
Buy Signal
A buy signal is generated when the +DI is above –DI, and the ADX is above 20
The Exit signal is generated when the ADX turns down from above 30.
Sell SignalA short signal is generated when the –DI is above +DI, and the ADX is above 20
The Exit signal is generated when the ADX turns down from above 30.
Using MACD to Determine Buy and Sell Points
Forum
Indicators: MACD
newdigital, 2013.07.31 19:53
MACD Strategy Center Line Crossover Bullish Signal and Bearish Signal
The MACD indicator is one of the most widely and commonly used indicators available. MACD indicator is a momentum oscillator with some trend following characteristics.
MACD is one of the most popular indicators used in technical analysis. It is used to generate signals using crossovers
MACD indicator plots the divergence and convergence of moving averages. It is constructed using moving average analysis. Moving Average Convergence/Divergence is a trend-following indicator. It indicates the correlation between two moving averages.
One moving average is of a shorter period and the other for a longer period of price bars
This indicator has a zero center line; values above zero line are bullish while those below zero are bearish.
In an uptrend the shorter MACD line rises faster that the longer MACD line this creates a gap.
In a downtrend the shorter MACD line falls faster than the longer MACD line this creates a gap.
When the trend is about to reverse the MACD lines start to move closer to each other, thus closing the gap.
Forum
Indicators: MACD
newdigital, 2013.08.01 09:16
MACD Oscillator Technical Analysis Fast Line and Signal Line
MACD is used in various ways to give technical analysis information.
MACD Construction
The MACD is constructed using two exponential moving averages and MACD indicator plots two lines. The two default exponential moving averages used are 12 and 26. Then a smoothing factor of 9 is also applied when drawing.
Summary of how MACD is plotted
MACD uses 2 EMAs + a smoothing factor (12, 26 Exponential Moving Averages and 9 smoothing periods)
MACD only plots two lines- the fast line and the signal line
Implementation
The MACD indicator implements the MACD line as a continuous line while the signal line is implemented as a histogram.
The fast line and signal line is used to generate trading signals using the crossover method.
There is also the center-line which is also known as the zero mark and it is a neutral point between buyers and sellers.
Values above the center-mark are considered bullish while those below are bearish.
The MACD being an oscillator indicator, oscillates above and below this center line.
193. How to Place a Trailing Stop in the Futures Market
For this example lets say that we have defined our trailing stop conditions on the platform like we just looked at with the following conditions: The Stop Condition will be set to 10, the Trailing Condition will be Set to 5, and the Distance Condition will be set to 10. The first thing that it is important to keep in mind here, is that each of the numbers we have set here, represent the number of ticks, which as we have discussed in previous lessons, is the minimum movement that a futures contract can make. As we have also discussed, the value of a 1 tick move in the market varies from market to market, so make sure you know how much a 1 tick move is in the market that you are trading, before using the trailing stop.
For this example we are going to be using the E Mini S&P contract, where a 1 tick move in the market is .25 points. With this in mind a movement from 800 to 801 for example, represents a 4 tick move in the market.
Now that we understand this, for this example we are going to say that I am buying 1 contract of the E Mini S&P, at a current market price of 808.50. As I had the auto box checked as we just covered, the first thing that is going to happen, is a stop order to sell 1 contract is going to be placed 10 ticks behind the market, at a price of 806.00. To quickly go through the math here, .25 which is a 1 tick move in the E Mini S&P, times 10, equals 2.50, and the execution price of 808.50 - 2.50 gives me the price level of a 10 tick stop which is 806.00.
If, for example, the market moves lower from there, then nothing is going to happen with my stop order, unless the market trades down to 806.00, in which case the stop order will turn into a market order, and I will be closed out of my position at the next available price.
If however the market trades up to 809.75, which is 5 ticks above my entry price, and the condition that I have set in the "Trailing Condition" portion of the trailing stop, then the trailing portion of my stop order will activate. At this point, my stop is going to move automatically from its original price of 806.00, to 807.25, which is 10 ticks behind the current market price, and the amount that I set for the "Distance" condition of the order.
If the market then trades lower from there, to for example 809.00, then my stop will not move, and will remain at 807.25. If however the market trades higher from there at any point, to 810.00 for example, then my stop is going to move up tick for tick behind the market, so that it is always 10 ticks behind the market, which would be 807.50 if the market moved to 810.00.
The math can look a little tricky at first but if you pause the video here and go over this slide a couple of times you should see that it is actually very basic.
MACD Divergence Part 1
Take a look at MACD Divergence in MT5 CodeBase - go here to download.
MACD Divergence Part 2
Take a look at MACD Divergence in MT5 CodeBase - go here to download.
Forum
Indicators: MACD
newdigital, 2013.08.01 16:56
MACD Classic Bullish and Bearish Divergence
MACD Classic divergence is used as a possible sign for a trend reversal. Classic divergence is used when looking for an area where price could reverse and start going in the opposite direction. For this reason classic divergence is used as a low risk entry method and also as an accurate way of exit out of a trade.
1. It is a low risk method to sell near the market top or buy near the market bottom, this makes the risk on your trades are very small relative to the potential reward.
2. It is used to predict the optimum point at which to exit a Forex trade
There are two types:
Classic Bullish Divergence
Classic bullish divergence occurs when price is making lower lows (LL), but the oscillator is making higher lows (HL).
MACD Classic bullish divergence
Classic bullish divergence warns of a possible change in the trend from down to up. This is because even though the price went lower the volume of sellers that pushed the price lower was less as illustrated by the MACD indicator. This indicates underlying weakness of the downward trend.
Classic bearish divergence
Classic bearish divergence occurs when price is making a higher high (HH), but the oscillator is lower high (LH).
MACD Classic bearish divergence
Classic bearish divergence warns of a possible change in the trend from up to down. This is because even though the price went higher the volume of buyers that pushed the price higher was less as illustrated by the MACD indicator. This indicates underlying weakness of the upward trend.
MACD Divergence Part 3
Take a look at MACD Divergence in MT5 CodeBase - go here to download.
When MACD Divergences FAIL and how to manage those trades.
MACD Divergence Part 4 of 4
More MACD Divergence examples.
Take a look at MACD Divergence in MT5 CodeBase - go here to download.
Forum
Indicators: MACD
newdigital, 2013.08.01 17:00
MACD Hidden Bullish and Bearish Divergence
MACD Hidden divergence is used as a possible sign for a trend continuation.
This setup occurs when price retraces to retest a previous high or low.
1. Hidden Bullish Divergence
2. Hidden Bearish Divergence
Hidden Bullish Divergence
Forms when price is making a higher low (HL), but the MACD oscillator is showing a lower low (LL).
Hidden bullish divergence occurs when there is a retracement in an uptrend.
MACD bullish divergence
This divergence confirms that a retracement move is complete. This divergence indicates underlying strength of an uptrend.
Hidden Bearish Divergence
Forms when price is making a lower high (LH), but the MACD oscillator is showing a higher high (HH).
Hidden bearish divergence occurs when there is a retracement in an uptrend.
MACD bearish divergence
This setup confirms that a retracement move is complete. This diverging indicates underlying strength of a downtrend.
NB: Hidden divergence is the best divergence to trade because it gives a signal that is in the same direction with the trend. It provides for the best possible entry and is more accurate than the classic type of diverging.
Video 8 - Forex support and resistance lines
Support and resistance lines are among the most common factors that you will come across when you trade. They both represent a price point at which the opposite forces cannot penetrate. Instead, price bounces back into the opposite direction as the support or resistance lines are far too strong.
Forum
Indicators: Support and Resistance
newdigital, 2013.09.23 10:15
Support and Resistance Technical Indicator
Support and Resistance is one of the widely used concepts in Forex trading. Most traders plot horizontal lines to show support levels and resistance levels.
There is also an indicator used to plot Support levels automatically and indicate the resistance and support levels.
When it comes to these levels price can either bounce off these levels or break these levels.
If a resistance level is broken price will move higher and the resistance level will turn to a support.
If a support level is broken price will move lower and the support level will turn to a resistance.
Price where the majority of investors believe that prices will move higher, while resistance levels indicate the price at which a majority of investors feel prices will move lower.
Once price has broken through a support level or a resistance level then it is likely that the price will continue moving in that particular direction until it gets to the next support or resistance level.
The more often a support or resistance level is tested or is touched by the price and bounces, the more major that particular support level or resistance level becomes.
Technical Analysis of Resistance and Support Technical IndicatorThese levels are calculated a trend lines method.
Upward TrendIn an upward trend the resistance and support will generally head upwards
Downward TrendIn a downward trend the resistance and support will generally head downwards
How To Use Fibonacci Retracement Levels
Forum
Indicators: Fibonacci retracement
newdigital, 2013.11.21 12:06
Fibonacci Retracements (based on stockcharts article)
Introduction
Fibonacci Retracements are ratios used to identify potential reversal levels. These ratios are found in the Fibonacci sequence. The most popular Fibonacci Retracements are 61.8% and 38.2%. Note that 38.2% is often rounded to 38% and 61.8 is rounded to 62%. After an advance, chartists apply Fibonacci ratios to define retracement levels and forecast the extent of a correction or pullback. Fibonacci Retracements can also be applied after a decline to forecast the length of a counter trend bounce. These retracements can be combined with other indicators and price patterns to create an overall strategy.
The Sequence and RatiosThis article is not designed to delve too deep into the mathematical properties behind the Fibonacci sequence and Golden Ratio. There are plenty of other sources for this detail. A few basics, however, will provide the necessary background for the most popular numbers. Leonardo Pisano Bogollo (1170-1250), an Italian mathematician from Pisa, is credited with introducing the Fibonacci sequence to the West. It is as follows:
0, 1, 1, 2, 3, 5, 8, 13, 21, 34, 55, 89, 144, 233, 377, 610……
The sequence extends to infinity and contains many unique mathematical properties.
1.618 refers to the Golden Ratio or Golden Mean, also called Phi. The inverse of 1.618 is .618. These ratios can be found throughout nature, architecture, art and biology. In his book, Elliott Wave Principle, Robert Prechter quotes William Hoffer from the December 1975 issue of Smithsonian Magazine:
….the proportion of .618034 to 1 is the mathematical basis for the shape of playing cards and the Parthenon, sunflowers and snail shells, Greek vases and the spiral galaxies of outer space. The Greeks based much of their art and architecture upon this proportion. They called it the golden mean.
Alert ZonesRetracement levels alert traders or investors of a potential trend reversal, resistance area or support area. Retracements are based on the prior move. A bounce is expected to retrace a portion of the prior decline, while a correction is expected to retrace a portion of the prior advance. Once a pullback starts, chartists can identify specific Fibonacci retracement levels for monitoring. As the correction approaches these retracements, chartists should become more alert for a potential bullish reversal. Chart 1 shows Home Depot retracing around 50% of its prior advance.
The inverse applies to a bounce or corrective advance after a decline. Once a bounce begins, chartists can identify specific Fibonacci retracement levels for monitoring. As the correction approaches these retracements, chartists should become more alert for a potential bearish reversal. Chart 2 shows 3M (MMM) retracing around 50% of its prior decline.
Keep in mind that these retracement levels are not hard reversal points. Instead, they serve as alert zones for a potential reversal. It is at this point that traders should employ other aspects of technical analysis to identify or confirm a reversal. These may include candlesticks, price patterns, momentum oscillators or moving averages.
Common RetracementsThe Fibonacci Retracements Tool at StockCharts shows four common retracements: 23.6%, 38.2%, 50% and 61.8%. From the Fibonacci section above, it is clear that 23.6%, 38.2% and 61.8% stem from ratios found within the Fibonacci sequence. The 50% retracement is not based on a Fibonacci number. Instead, this number stems from Dow Theory's assertion that the Averages often retrace half their prior move.
Based on depth, we can consider a 23.6% retracement to be relatively shallow. Such retracements would be appropriate for flags or short pullbacks. Retracements in the 38.2%-50% range would be considered moderate. Even though deeper, the 61.8% retracement can be referred to as the golden retracement. It is, after all, based on the Golden Ratio.
Shallow retracements occur, but catching these requires a closer watch and quicker trigger finger. The examples below use daily charts covering 3-9 months. Focus will be on moderate retracements (38.2-50%) and golden retracements (61.8%). In addition, these examples will show how to combine retracements with other indicators to confirm a reversal.
Moderate RetracementsChart 3 shows Target (TGT) with a correction that retraced 38% of the prior advance. This decline also formed a falling wedge, which is typical for corrective moves. The combination raised the reversal alert. Chaikin Money Flow turned positive as the stock surged in late June, but this first reversal attempt failed. Yes, there will be failures. The second reversal in mid July was successful. Notice that TGT gapped up, broke the wedge trend line and Chaikin Money Flow turned positive (green line).
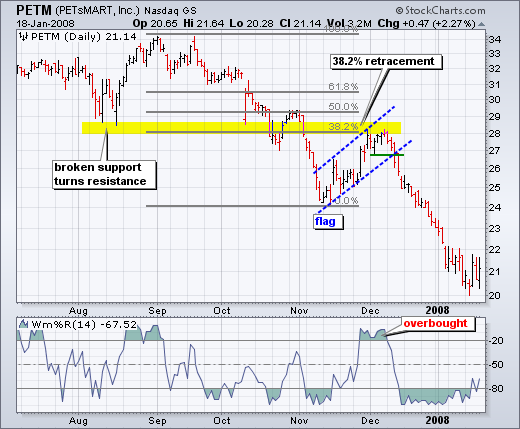
Chart 4 shows Petsmart (PETM) with a moderate 38% retracement and other signals coming together. After declining in September-October, the stock bounced back to around 28 in November. In addition to the 38% retracement, notice that broken support turned into resistance in this area. The combination served as an alert for a potential reversal. William %R was trading above -20% and overbought as well. Subsequent signals affirmed the reversal. First, Williams %R moved back below -20%. Second, PETM formed a rising flag and broke flag support with a sharp decline the second week of December.
Golden RetracementsChart 4 shows Pfizer (PFE) bottoming near the 62% retracement level. Prior to this successful bounce, there was a failed bounce near the 50% retracement. The successful reversal occurred with a hammer on high volume and follow through with a breakout a few days later.
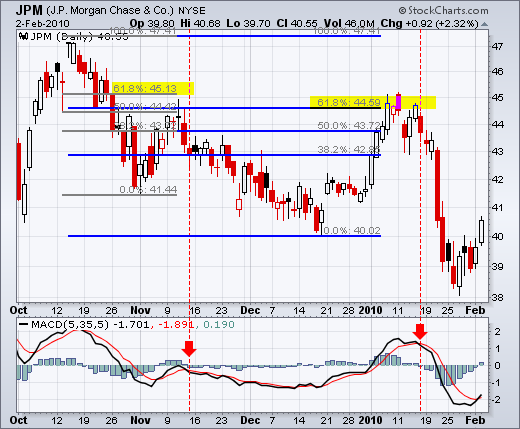
Chart 5 shows JP Morgan (JPM) topping near the 62% retracement level. The surge to the 62% retracement was quite strong, but resistance suddenly appeared with a reversal confirmation coming from MACD (5,35,5). The red candlestick and gap down affirmed resistance near the 62% retracement. There was a two day bounce back above 44.5, but this bounce quickly failed as MACD moved below its signal line (red dotted line).
ConclusionsFibonacci retracements are often used to identify the end of a correction or a counter-trend bounce. Corrections and counter-trend bounces often retrace a portion of the prior move. While short 23.6% retracements do occur, the 38.2-61.8% covers the more possibilities (with 50% in the middle). This zone may seem big, but it is just a reversal alert zone. Other technical signals are needed to confirm a reversal. Reversals can be confirmed with candlesticks, momentum indicators, volume or chart patterns. In fact, the more confirming factors the more robust the signal.
How to trade the ADX Indicator in Forex
In this Forex training video we discuss the ADX indicator and how it can be used in your Forex trading, We firstly define the ADX indicator, explain what it does and how it is used in measuring the strength of a trend. We also discuss the +DI and -DI lines that produce the final ADX line.
Forum
Indicators: Average Directional Movement Index Wilder
newdigital, 2013.08.29 16:55
Average Directional Movement Index (ADX)
Developed by J. Welles Wilder
The ADX is a momentum indicator used to determine the strength of a price trend; it is derived from the DMI –Directional Movement Index which has two indicators
+DI- Positive Directional indicator
–DI - Negative Directional Indicator
ADX is calculated by subtracting these two values and applying a smoothing function, example a function of ten to come up with a 10 period ADX.
The ADX is not a directional indicator but a measure of the strength of the trend. The ADX has a scale of Zero -100.
The higher the ADX value the stronger the trend.
ADX value below 20 indicates that the market is not trending but moving in a range.
ADX value above 20 confirms a buy or sell signal and indicates a new trend is emerging.
ADX value above 30 signifies a strong trending market.
When ADX value turns down from above 30, it signifies that the current trend is losing momentum.
ADX indicator combined with DMI- Directional Movement Index
Since the ADX alone is a directionless indicator it is combined with the DMI index to determine the direction of the currency pair.
ADX indicator and DMI IndexWhen the ADX is combined with DMI index a trader can determine the direction of the trend and then use the ADX to determine the momentum of the forex trend.
Technical Analysis of ADX indicator
Buy Signal
A buy signal is generated when the +DI is above –DI, and the ADX is above 20
The Exit signal is generated when the ADX turns down from above 30.
Sell SignalA short signal is generated when the –DI is above +DI, and the ADX is above 20
The Exit signal is generated when the ADX turns down from above 30.
Example :
Below is a strategy using a Simple Moving Average crossover of the 50 and 20 period on an Hourly chart of the EUR/USD. The rules of the strategy are easy, buy when the 20 period crosses above the 50 period, and sell when the 20 period crosses below the 50 period.This crossover strategy thrives in trending markets but suffers in ranging markets.
The signals that occurred while the ADX was above 30 were much more reliable. We took out all of the trades where the EURUSD was moving sideways and only opened trades during the long trending moves up or down. You might have also noticed that some of the winning trades were filtered out along with the bad trades, but this is ok. Overall, we cut out more losing trades than winning trades so it was an overall positive filter to this trending strategy.