How to determine a trend of an Oscillator (RSI, IMI, etc.)
There are many approaches related to oscillators:
- the line is crossing some level is for the trend reversal/established; for example, line crossed 70 level is for buy/uptrend, or line crossed 0 level is for buy, or line crossed 0 level os for ranging uptill 70 crossed which is for buy ... and so on
- line crossing some level is for breakout/breakdown; example: line crossed 30 level to below is for breakdown/downtrend.
- overbought/oversold levels.
-----------------
Look at the following thread for more examples: https://www.mql5.com/en/forum/12391
Forum on trading, automated trading systems and testing trading strategies
Sergey Golubev, 2013.06.03 18:07
So, just about this documentation Signals of the Oscillator Stochastic - some traders are using some more signals:
The main line is above some level (50%, 70% or 80%):
- as a confirmation for sell trade - for trend following system
- as a confirmation for buy trade - for breakout systems (breaking support/resistance levels)
The main line is below some level (50%, 30% or 20%):
- as a confirmation for buy trade - for trend following system
- as a confirmation for sell trade - for breakout systems (breaking support/resistance levels)

- 2013.06.01
- www.mql5.com
Forum on trading, automated trading systems and testing trading strategies
Sergey Golubev, 2016.03.28 14:13
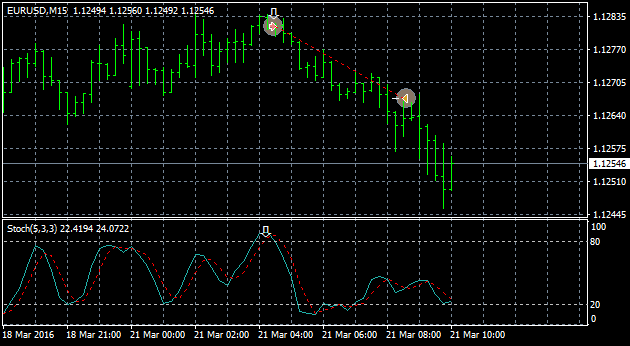
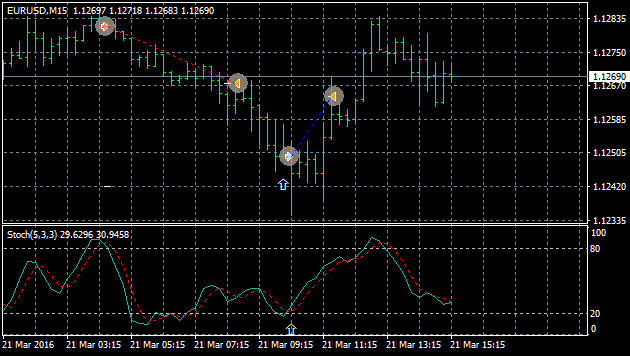
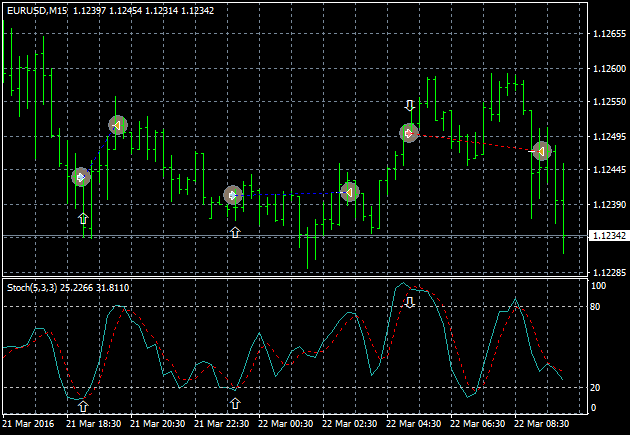
This is very good EA for newbies - for the traders who are learning Stochastic indicator about how it works. EA is trading on overbought/oversold levels of Stochastic indicator with the following parameters which were coded to be inside this EA:
- the parameters of Stochastic indicator which were coded inside this EA: 5/3/3
- overbought/oversold levels to be coded in EA: 80/20
- "Advisor analyzes the readings of the indicator Stochastic has, signal for buying is the intersection of the main and signal indicator lines in the oversold zone, a signal for the intersection of sales is the main indicator and signal lines in the overbought zone."
The coder proposed set file for this EA so we may use this EA on EURUSD M15 timeframe according to this set file/parameters.
I backtested EA just to see how it works - please find backtesting results and some charts with the ideas about overbought/oversold levels:
- Free trading apps
- Over 8,000 signals for copying
- Economic news for exploring financial markets
You agree to website policy and terms of use
Hi,
How can I determine the trend direction of an oscillator (whether the oscillator direction is up or down?) because I need this in my strategy.
Shall I just compare it to its MA even if it looks horizontal in some cases or trending in other cases as per these charts?