Something Interesting in Financial Video - page 17
You are missing trading opportunities:
- Free trading apps
- Over 8,000 signals for copying
- Economic news for exploring financial markets
Registration
Log in
You agree to website policy and terms of use
If you do not have an account, please register
Behind central banks in terms of size and ability to move the foreign exchange market are the banks which we learned about in our previous lessons which make up the Interbank market. It is important to understand here that in addition to executing trades on behalf of their clients, the bank's traders often times try to earn additional profits by taking speculative positions in the market as well.
While most of the other players we are going to discuss in this lesson do not have the size and clout to move the market in their favor, many of these bank traders are an exception to this rule and can leverage their huge buying power and inside knowledge of client order flow to move the market in their favor. This is why you hear about quick market jumps in the foreign exchange market being attributed to the clearing out the stops in the market or protecting an option level, things which we will learn more about in later lessons.
The next level of participants is the large hedge funds who trade in the foreign exchange market for speculative purposes to try and generate alpha, or a return for their investors that is over and above the average market return. Most forex hedge funds are trend following, meaning they tend to build into longer term positions over time to try and profit from a longer term uptrend or downtrend in the market. These funds are one of the reasons that currencies often times develop nice longer term trends, something that can be of benefit to the individual position trader.
Although not the typical way that Hedge funds profit from the market, probably the most famous example of a hedge fund trading foreign exchange is the example of George Soros' Quantum fund who made a very large amount of money betting against the Bank of England.
In short, the Bank of England had tried to fix the exchange rate of the British Pound at a particular level buy buying British Pounds, even though market forces were trying to push the value of the Pound Down. Soros felt that this was a losing battle and essentially bet the entire value of his $1 Billion hedge fund that the value of the pound would decrease. The market forces which were already at play, combined with Soro's huge position against the Bank of England, caused so much selling pressure on the pound that the Bank of England had to give up trying to prop up the currency and it preceded to fall over 5% in one day. This is a gigantic move for a major currency, and a move which netted Soros' Quantum Fund over $1 Billion in profits in one day.
Next in line are multinational corporations who are forced to be participants in the forex market because of their overseas earnings which are often converted back into US Dollars or other currencies depending on where the company is headquartered. As the value of the currency in which the overseas revenue was earned can rise or fall before that conversion, the company is exposed to potential losses and/or gains in revenue which have nothing to do with their business. To remove this exchange rate uncertainty many multinational corporations will hedge this risk by taking positions in the forex market which negate any exchange rate fluctuation on their overseas revenues.
Secondly these corporations also buy other corporations overseas, something which is known as cross boarder mergers and acquisitions. As the transaction for the company being bought or sold is done in that company's home country and currency, this can drive the value of a currency up as demand is created for the currency to buy the company or down as supply is created when the company is sold.
Lastly are individuals such as you and I who participate in the forex market in three main areas.
1. As Investors Seeking Yield: Although not very popular in the United States, overseas and particularly in Japan where interest rates have been close to zero for many years, individuals will buy the currencies or other assets of a country with a higher interest rate in order to earn a higher rate of return on their money. This is also referred to as a carry trade, something that we will learn more about in later lessons.
2. As Travelers: Obviously when traveling to a country which has a different currency individual travelers must exchange their home currency for the currency of the country where they are traveling.
3. Individual speculators who actively trade currencies trying to profit from the fluctuation of one currency against another. This is as we discussed in our last lesson a relatively new phenomenon but most likely the reason why you are watching this video and therefore a growing one.
Scalping
Forum on trading, automated trading systems and testing trading strategies
Press review
newdigital, 2014.03.07 09:08
Who Can Trade a Scalping Strategy? (based on dailyfx article)
The term scalping elicits different preconceived connotations to different traders. Despite what you may already think, scalping can be a viable short term trading methodology for anyone. So today we will look at what exactly is scalping, and who can be successful with a scalping based strategy.
What is a Scalper?
So you’re interested in scalping? A Forex scalper is considered anyone that takes one or more positions throughout a trading day. Normally these positions are based around short term market fluctuations as price gathers momentum during a particular trading session. Scalpers look to enter the market, and preferably exit positions prior to the market close.
Normally scalpers employ technical trading strategies utilizing short term support and resistance levels for entries. While normally fundamentals don’t factor into a scalpers trading plan, it is important to keep an eye on the economic calendar to see when news may increase the market’s volatility.
High Frequency Trading
There is a strong misconception that all scalpers are high frequency traders. So how many trades a day does it take to be considered a scalper? Even though high frequency traders ARE scalpers, in order for you to qualify as a scalper you only need to take 1 position a day! That is one of the benefits of scalping. You can trade as much or as little as you like within a giving trading period.
This also falls in line with one of the benefits of the Forex market. Due to the 24Hr trading structure of Forex, you can scalp the market at your convenience. Take advantage of the quiet Asia trading session, or the volatile New York – London overlap. Trade as much or as little as you like. As a scalper the choice is ultimately yours to make!
Risks
There are always risks associated with trading. Whether you are a short term, long term, or any kind of trader in between any time you open a position you should work on managing your risk. This is especially true for scalpers. If the market moves against you suddenly due to news or another factor, you need to have a plan of action for limiting your losses.
There are other misconceptions that scalpers are very aggressive traders prone to large losses. One way to help combat this is to make scalping a mechanical process. This means that all of your decisions regarding entries, exits, trade size, leverage and other factors should be written down and finalized before approaching the charts. Most scalpers look to risk 1% or even less of their account balance on any one position taken!
Who can Scalp?
So this brings us to the final question. Who can be a scalper? The answer is anyone with the dedication to develop a trading strategy and the time to implement that strategy on any given trading day.
=================
Trading examples
Metaquotes demo
GoMarkets broker, initial deposit is 1,000
Alpari UK broker initial deposit is 1,000
RoboForex broker initial deposit is 1,000
Forum on trading, automated trading systems and testing trading strategies
PriceChannel Parabolic system
newdigital, 2013.03.22 14:04
PriceChannel Parabolic system
PriceChannel Parabolic system basic edition
Latest version of the system with latest EAs to download
How to trade
The settingas for EAs: optimization and backtesting
Trading examples
Metaquotes demo
GoMarkets broker, initial deposit is 1,000
Alpari UK broker initial deposit is 1,000
RoboForex broker initial deposit is 1,000
Forum on trading, automated trading systems and testing trading strategies
Indicators: Moving Average of Oscillator (OsMA)
newdigital, 2014.03.21 07:04
Scalping with MACD (based on dailyfx article)
When a scalper begins their day, there are usually quite a few questions that need to be answered before ever placing a trade.
What’s moving the market this morning?
Which markets are most active?
What drivers (or news) might come out to push the market further?
Is my coffee ready yet?
These are just a few examples… but suffice it to say that those who are day-trading in markets have quite a bit on their mind every single trading day.
The Setup
Before a scalper ever triggers a position they need to first find the appropriate market environment.
For fundamental-based traders, Multiple Time Frame Analysis can be helpful; but more important is their outlook or opinion and the fact that that outlook or opinion should mesh with the ‘bigger picture’ view of what’s going on at the moment.
For scalpers, the hourly and 4-hour charts carry special importance, as those are the ideal timeframes for seeing the bigger picture.
After that, traders should look to diagnose the trend (or lack thereof).
A great indicator for investigating trend strength is the Average Directional Index (ADX). Also popular for investigating trends is the Moving Average Indicator.
The Entry
After the day-trader has found a promising setup, they then need to decide how to trigger into positions, and MACD can be a very relevant option for such situations.
Because the trader already knows the direction they want to trade in, they merely need to wait for a corresponding signal via MACD to initiate the position.
When MACD crosses up and over the signal line, the trader can look to go long.
After a long position is triggered, the trader can look to close the position when MACD moves down and under the signal line (which is usually looked at as a sell signal, but because you did the ‘bigger picture analysis’ with the longer-term chart, this is merely a ‘close the long signal.’)
Scalpers can trigger positions when MACD Signal takes place in direction of their bias
On the other side of this equation: If the trader had determined the trend to be down on the longer-term chart or if their fundamental bias is pointing lower, they can look for MACD to cross down and under the signal line to trigger their short position.
And once MACD crosses up and over the signal line, the trader can look to cover their short position.
Scalpers can close positions when opposing MACD Signal takes place
The Context
The aforementioned approach can work phenomenally in a day-trading/scalping approach. But the fact-of-the-matter is that scalping profitably entails a lot more than just a trading plan, and an entry strategy.
Risk management is the undoing of most new traders; and day-traders and scalpers fall victim to this susceptibility even more so than most.
Forum on trading, automated trading systems and testing trading strategies
Something Interesting in Financial Video June 2013
newdigital, 2013.06.11 06:55
Scalping the forex market
All the ins and outs on scalping the Forex market. May Chris dives into the world of Scalping where he explains in great detail how this style of trading can be accomplished in the Forex market. This live webinar not only clarifies how a trader can scalp but also provides every Forex trader with a great guidance and extra tips.
Suri Duddella, Webinar: The Success and Failure of Chart Patterns
Suri Duddella, 19+ years full-time Futures/Equities/Options Trader. Patterns based Algorithmic Trading. Author -- "Trade Chart Patterns Like The Pros" book.
======
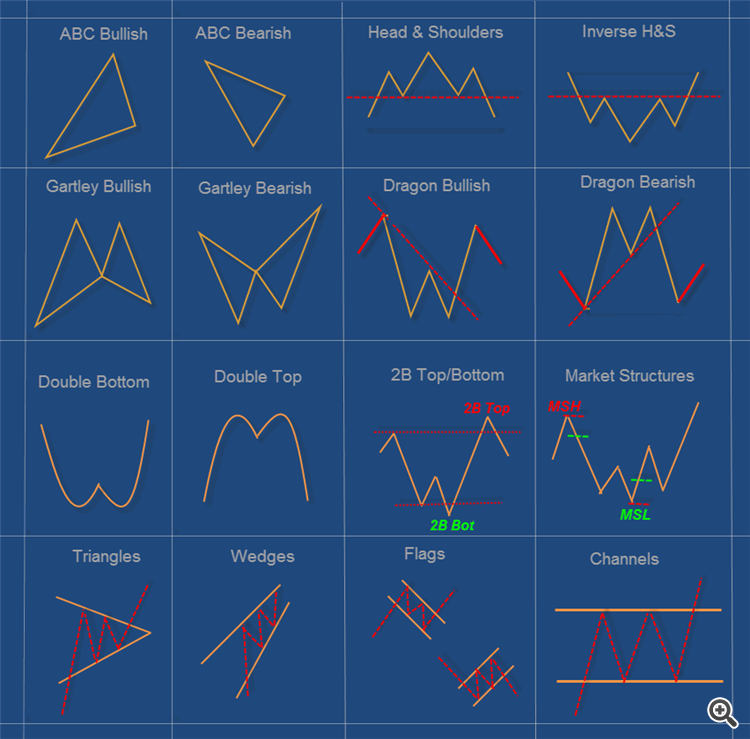
A chart pattern is a distinct formation on a stock chart that creates a trading signal, or a sign of future price movements. Chartists use these patterns to identify current trends and trend reversals and to trigger buy and sell signals.
Identifying chart patterns is simply a system for predicting stock market trends and turns! Well, a trend is merely an indicator of an imbalance in the supply and demand. These changes can usually be seen by market action through changes in price. These price changes often form meaningful chart patterns that can act as signals in trying to determine possible future trend developments. Research has proven that some patterns have high forecasting probabilities. These patterns include: The Cup & Handle, Flat Base, Ascending and Descending Triangles, Parabolic Curves, Symmetrical Triangles, Wedges, Flags and Pennants, Channels and the Head and Shoulders Patterns.
Video 1 of 2 - In this Forex training video we discuss the characteristics of the double top and the surrounding market conditions you should consider. Before you learn how to trade the double top you must know how to identify the pattern. Watch the next video to learn how to trade the double top.
Forum on trading, automated trading systems and testing trading strategies
Don`t read this thread..Make Money with it.
Sergey Golubev, 2021.08.17 08:27
Patterns with Examples (Part I): Multiple Top
How to trade a double top in Forex Part 2
Video 2 of 2 - In this Forex trading course video we discuss how to trade the double top pattern. Instructions are provided on entry and exit points and also where to put your stop loss.
Veteran Trading Skills w/Damon Pavlatos
How to Trade the MACD Indicator Like a Pro Part 1
The indicator, which was developed by Gerald Appel, is constructed by taking a 12 period exponential moving average of a financial instrument and subtracting its 26 period exponential moving average. The resulting line is then plotted below the price chart and fluctuates above and below a center line which is placed at value zero. A 9 period EMA of the MACD line is normally plotted along with the MACD line and used as a signal of potential trading opportunities.
When the MACD line is above zero this tells the trader that the 12 period exponential moving average is trading above the 26 period exponential moving averages. When the MACD line is below zero this tells the trader that the 12 period exponential moving average is below the 26 period exponential moving average. Traders will watch the MACD line as when it is above zero and rising this is a sign that the positive gap between the 12 and 26 EMA's is widening, a sign of increasing bullish momentum in the financial instrument they are analyzing. Conversely when the MACD line is below zero and falling this represents a widening in the negative gap between the 12 and 26 day EMA's, a sign of increasing bearish momentum in the financial instrument they are analyzing.
The purpose of the 9 period exponential moving average line is to further confirm bullish changes in momentum when the MACD crosses above this line and bearish changes in momentum when the MACD crosses below this line.
Lastly many traders and charting packages will plot a histogram along with the MACD which is representative of the distance between the MACD and its signal line. When the MACD histogram is above zero (the MACD line is above the signal line) this is an indication that positive momentum is increasing. Conversely when the MACD histogram is below zero this is an indication that negative momentum is increasing.
When the MACD histogram is above zero (the MACD line is above the signal line) this is an indication that positive momentum is increasing. Conversely when the MACD histogram is below zero this is an indication that negative momentum is increasing. The higher or lower the histogram goes above or below zero the greater the momentum of the trend is thought to be.
How to Trade the MACD Indicator Like a Pro Part 2
As we learned in our last lesson the MACD indicator is used to identify trends in the market and the momentum of those trends. Because of this the MACD is an indicator that traders will look to trade when the market is trending and avoid when the market is range bound.
In addition to being able to tell if the stock, futures contract, or currency you are analyzing is trending or not from simply looking at its price action on the chart, you can also use the MACD indicator. Very simply if the MACD line is at or close to the zero line, this indicates that the financial instrument you are analyzing is not exhibiting strong trending characteristics, and thus should not be traded using the MACD.
Once it is determined that the financial instrument you are analyzing is exhibiting trending characteristics, there are three ways that you can trade the MACD.
Trading the MACD Divergence:
Trading the MACD CrossoverDivergence occurs when the direction of the MACD is not moving in the same direction of the financial instrument you are analyzing. This can be seen as an indication that the upward or downward momentum in the market is failing. Traders will thus look to trade the reversal of the trend and consider this signal particularly strong when the market is making a new high or low and the MACD is not.
This is the simplest way to trade the MACD as it involves simply watching the MACD line and going long when the MACD line crosses above the signal line and going short when the MACD line crosses below the signal line. As this strategy generates the most signals, it also generates the most false signals, and the potential to get into a bad trade using just this method is high. For this reason traders will confirm the signals with other methods such as the chart patterns we have learned so far, volume etc.
The MACD Zero Line Crossover:
The MACD zero line cross over occurs when the MACD crosses above or below the line plotted at point zero on the indicator. When this occurs it is an indication that market momentum has reversed direction. The strength of the move that can be expected as a result of this depends on what has been happening in the market, and what has been happening with the indicator. If the market and the MACD are both coming off of recent new highs then this could be considered a strong signal. If the market is simply trading in a weak trend or range and the MACD has simply crossed from just above to just below the zero line, then this would be considered a weak signal.
Commodity Channel Index (CCI) Explained
The Commodity Channel Index (CCI) is a technical indicator that can help investors decide when they might buy or sell stocks and other securities.
----------------
Forum on trading, automated trading systems and testing trading strategies
CCI Woodie like
Sergey Golubev, 2021.09.17 17:45
CCIOnMA Four Colors - indicator for MetaTrader 5
Series of indicators 'Four Colors'. Now the 'CCIOnMA' indicator (iCCI indicator based on the iMA indicator) is in the form of a colored histogram.
----------------
Jobs Report Explained