Press review - page 579


Why Is The Price Of An Ethereum Going Up? (based on the article)

Intra-day H4 price is on bullish breakout: the price is located very far from Ichimoku cloud in the primary bullish area of the chart with resistance level at 684 to be broken to above for the bullish trend to be continuing.


  • "The value of Ethereum’s currrency is increasing alongside its altcoins Bitcoin and Litecoin, and the price of one Ether is currently at a high of $625.25 USD, according to CoinMarketCap, despite the CryptoKitties drama. 2018 will welcome a range of regulatory requirements and financial institutions are launching new products on the blockchain in order to simplify compliance, and this is where the Ethereum blockchain is becoming increasingly popular."
  • "A project named the Massive Autonomous Distributed Reconciliation program (Madrec) was announced this week and will be led by UBS with involvement from Barclays, Credit Suisse, KBC, SIX and Thomson Reuters. For a while now, financial news has been dispersed with updates of how banks are experimenting with cryptocurrencies and this announcement is one of the most recent, after Bitcoin futures began trading."
  • "Unlike Bitcoin, however, Ethereum has always been spoken about in a more positive way and has become the second largest digital currency in two years. After being launched in 2015, the value of Ethereum’s currency, otherwise known as Ether, has increased by more than 6,800% since the start of the year, according to The Telegraph."

============

The chart was made on H4 timeframe with Ichimoku market condition setup (MT5) from this post (free to download for indicators and template) as well as the following indicators from CodeBase:


GBP/USD Intra-Day Fundamentals: ILO Unemployment Rate, Average Earnings Including Bonuses 3m/y and range price movement 

2017-12-13 09:30 GMT | [GBP - Average Earnings Index]

  • past data is 2.3%
  • forecast data is 2.5%
  • actual data is 2.5% according to the latest press release

if actual > forecast (or previous one) = good for currency (for GBP in our case)

[GBP - Average Earnings Index] = Change in the price businesses and the government pay for labor, including bonuses. 

==========

From official report :

  • "Latest estimates show that average weekly earnings for employees in Great Britain in nominal terms (that is, not adjusted for price inflation) increased by 2.5% including bonuses and by 2.3% excluding bonuses, compared with a year earlier."
  • "The unemployment rate (the proportion of those in work plus those unemployed, that were unemployed) was 4.3%, down from 4.8% for a year earlier and the joint lowest since 1975."

==========

GBP/USD M5: range price movement by Average Earnings Index news event 


==========

The chart was made on MT5 with MA Channel Stochastic system uploaded on this post, and using standard indicators from Metatrader 5 together with following indicators:


Intra-Day Fundamentals - EUR/USD, AUD/USD and GOLD: Federal Funds Rate

2017-12-13 19:00 GMT | [USD - Federal Funds Rate]

  • past data is 1.25%
  • forecast data is 1.50%
  • actual data 1.50% according to the latest press release

if actual > forecast (or previous one) = good for currency (for USD in our case)

[USD - Federal Funds Rate] = Interest rate at which depository institutions lend balances held at the Federal Reserve to other depository institutions overnight.

==========

From official report :

  • "Information received since the Federal Open Market Committee met in November indicates that the labor market has continued to strengthen and that economic activity has been rising at a solid rate. Averaging through hurricane-related fluctuations, job gains have been solid, and the unemployment rate declined further. Household spending has been expanding at a moderate rate, and growth in business fixed investment has picked up in recent quarters. On a 12-month basis, both overall inflation and inflation for items other than food and energy have declined this year and are running below 2 percent. Market-based measures of inflation compensation remain low; survey-based measures of longer-term inflation expectations are little changed, on balance.""In view of realized and expected labor market conditions and inflation, the Committee decided to raise the target range for the federal funds rate to 1-1/4 to 1‑1/2 percent. The stance of monetary policy remains accommodative, thereby supporting strong labor market conditions and a sustained return to 2 percent inflation."

==========

EUR/USD M5: range price movement by Federal Funds Rate news events


==========

AUD/USD M5: range price movement by Federal Funds Rate news events


==========

XAU/USD M5: rrange price movement by Federal Funds Rate news events


============

Chart was made on MT5 with BrainTrading system (MT5) from this thread (free to download) as well as the following indicators from CodeBase:

All about BrainTrading system for MT5:

Federal Reserve issues FOMC statement
  • www.federalreserve.gov
Information received since the Federal Open Market Committee met in November indicates that the labor market has continued to strengthen and that economic activity has been rising at a solid rate. Averaging through hurricane-related fluctuations, job gains have been solid, and the unemployment rate declined further. Household spending has been...
 

S&P 500 - daily bullish breakout; 2,671 is the key (based on the article)

Daily price is on bullish breakout for the resistance level at 2,671 to be broken to above for the bullish trend to be continuing.


  • "Retail trader data shows 26.2% of traders are net-long with the ratio of traders short to long at 2.81 to 1. The number of traders net-long is 7.7% lower than yesterday and 10.9% lower from last week, while the number of traders net-short is 2.1% higher than yesterday and 8.0% higher from last week."
  • "We typically take a contrarian view to crowd sentiment, and the fact traders are net-short suggests US 500 prices may continue to rise. Traders are further net-short than yesterday and last week, and the combination of current sentiment and recent changes gives us a stronger US 500-bullish contrarian trading bias."

============

The chart was made on H4 timeframe with Ichimoku market condition setup (MT5) from this post (free to download for indicators and template) as well as the following indicators from CodeBase:


AUD/USD Intra-Day FundamentalsAustralia Employment Change and range price movement 

2017-12-14 00:30 GMT | [AUD - Employment Change]

  • past data is 7.8K
  • forecast data is 18.1K
  • actual data is 61.6K according to the latest press release

if actual > forecast (or previous one) = good for currency (for AUD in our case)

[AUD - Employment Change] = Change in the number of employed people during the previous month. 

==========

From official report :

  • "Unemployment rate remained steady at 5.4%."
  • "Employment increased 61,600 to 12,403,000. Full-time employment increased 41,900 to 8,501,900 and part-time employment increased 19,700 to 3,901,100."

==========

AUD/USD H1: range price movement by Australia Employment Change news event 


==========

Chart was made on MT5 with Brainwashing system/AscTrend system (MT5) from this thread (free to download) together with following indicators:

Same system for MT4:

  1. Brainwashing. Trades: manually and using EAs (MT4)
  2. Brainwashing EAs - the thread (MT4)
  3. Brainwashing: system setup for trading manually and for EAs (MT4) - the thread 
  4. Brainwashing: system development (MT4) - the thread
 

More Interest Rate Hikes To Come In 2018? (based on the article)


  • "As expected, the Federal Reserve has decided to raise interest rates by another quarter point. Now what? A closer look at the details reveals a great deal about the likelihood of more rate hikes in 2018—and what this could mean for investors."
  • "As we dig into the details, the first thing worth looking at is what's known as the dot plot. This plot shows individual committee members’ expectations for where interest rates will be."
  • "As you can see from the chart, the 2017 plot reflects the meeting that just passed, where all members but two voted to raise rates. Looking at the 2018 plot, a majority of members expect three or more rate increases. And in 2019, almost all expect rates to rise further. This suggests two things:
    1. The upward pressure on interest rates is likely to continue.
    2. The Fed feels pretty good about the economy."


S&P 500 - bounced from 55 SMA for the strong intra-day trend to be continuing (based on the article)

Intra-day price on H4 chart is above 200 SMA for the primary bullish trend: the price was bounced from 55 SMA to above for the strong bullish trend to be continuing, otherwise - ranging within the levels.


  • "Yesterday, the S&P 500 declined off the top-side slope extending over from a peak created in April 2016. It’s the same slope the market experienced a gap reversal off of on 12/4. At that time, the S&P looked poised to start rolling downhill towards support around 2600, but as has been the case during this latest run the dip was quickly bought. Will buyers snatch up stocks so quickly on weakness this time around? Recent history says, yes, that in all likelihood we will see a dip bought, and probably sooner rather than later. The trend is up and seasonality is favorable, so it’s hard to argue against the case that mild weakness won’t end up as another ‘buy-the-dip’ opportunity."
  • "The sequence has been pretty clear the past few months, with higher-highs and higher-lows marking a strong trend. In the event that market halts its decline ahead of that key low and turns higher, creating another higher-low, it will be viewed as a positive and eyes will turn back towards the April 2016 top-side slope and new record highs. On the flip-side, if we see selling accelerate and 2624.75 is snapped, then we may be in for a larger decline back towards support around 2600."

==========

The chart was made on MT5 with MA Channel Stochastic system uploaded on this post, and using standard indicators from Metatrader 5 together with following indicators:


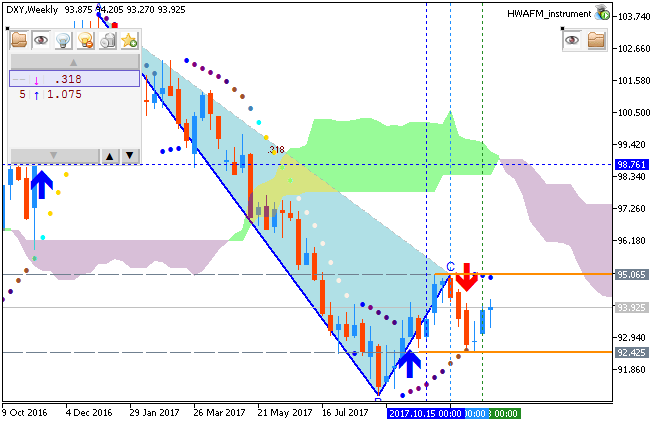
Weekly Outlook: 2017, December 17 - December 24 (based on the article)

The US dollar was on the back foot but managed to climb back in a busy week. As we enter the last week before the holidays, how will currencies make their last-minute adjustments? GDP data from the US, the UK, and Canada stand out. Here are the highlights for the upcoming week.


  1. US housing data: Tuesday, 13:30. Note that for a meaningful effect, both figures need to go in the same direction. In some cases, one surprises to the upside and the other to the downside, offsetting each other.
  2. US Existing Home Sales: Wednesday, 15:00. Another advance is on the cards now: 5.54 million.
  3. New Zealand GDP: Wednesday, 21:45. A slightly slower rate is on the cards now: 0.6%.
  4. Japanese rate decision: Thursday, early in the morning. The Bank of Japan seems to be the only central bank in the developed world not to take a hawkish turn. They keep on buying bonds in full-force. No change is expected now, as we reach the end of the year.
  5. US final GDP: Thursday, 13:30. The third and final read is expected to confirm this growth rate, the second consecutive quarter of over 3% GDP growth.
  6. US durable goods orders: Friday, 13:30. The data impacts Q4 growth projections.
  7. US Core PCE: Friday, 13:30.
  8. Canadian GDP: Friday, 13:30.
  9. US new home sales: Friday, 15:00. 
 

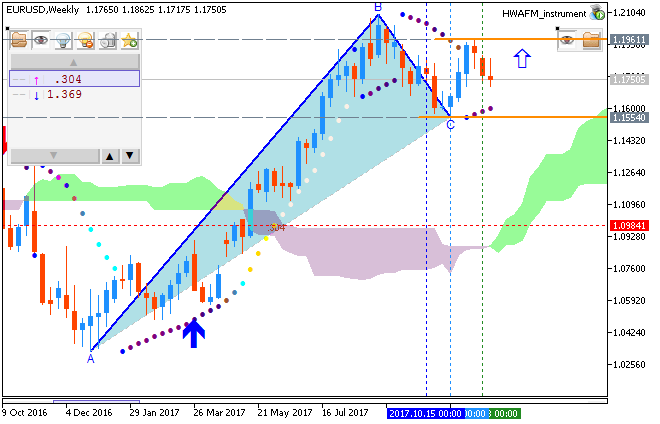
Weekly EUR/USD Outlook: 2017, December 17 - December 24 (based on the article)

EUR/USD made a move to the upside but eventually failed to stay there and retreated amid the ECB meeting. What’s next? Final inflation figures and a key German survey stand out. Here is an outlook for the highlights of this week.


  1. Final CPI: Monday, 10:00. A confirmation of these figures is on the cards now.
  2. German Ifo Business Climate: Tuesday, 9:00. A small tick up to 117.6 is forecast now.
  3. German PPI: Wednesday, 7:00. A more modest rise of 0.2% is predicted now.
  4. Current Account: Wednesday, 9:00. After +37.8 billion in September, the surplus for October carries expectations for a narrower 33.4 billion.
  5. Belgian NBB Business Climate: Wednesday, 7:00. A positive score of 1.6 was seen in November, above expectations. Yet another improvement is projected: 2.1 for December.
  6. Consumer Confidence:  Thursday, 15:00.
  7. German GfK Consumer Climate: Friday, 7:00. A score of 10.7 was reported in this survey back in November and a minor increase to 10.8 is on the cards for December.
  8. French Consumer Spending: Friday, 7:45. The fall is seen as temporary as a jump of 1.5% is on the cards now.
Reason: