Join our fan page
- Views:
- 6966
- Rating:
- Published:
- Updated:
-
Need a robot or indicator based on this code? Order it on Freelance Go to Freelance
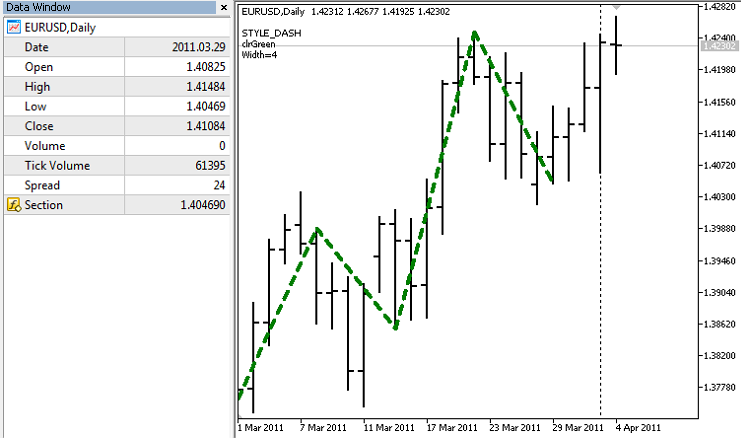
The indicator plots sections between the High and Low prices of the bars.
The color, width and style of the sections changes randomly each N ticks. Note that initial properties of the plot1 graphic plot (DRAW_SECTION) are defined using the #property preprocessor directive, further these properties changed randomly (OnCalculate() function). The N variable is defined as input parameter, it can be changed manually using the "Properties" window.
See also: The Drawing Styles in MQL5.

Translated from Russian by MetaQuotes Ltd.
Original code: https://www.mql5.com/ru/code/331
 DRAW_LINE
The DRAW_LINE style is used for plotting the values of the indicator's buffer as a line.
 DRAW_NONE
The DRAW_NONE drawing style is used in cases, when you need to calculate and show the values of the indicator in "Data Window", but the plotting isn't needed.
 DRAW_HISTOGRAM
The DRAW_HISTOGRAM drawing style is used for plotting the values of the indicator's buffer as a histogram.
 DRAW_HISTOGRAM2
The DRAW_HISTOGRAM2 drawing style is used for plotting the values of two indicator's buffers as a histogram.