Designing Low Drawdown Trading Systems: Drawdown as an Input, Not an Outcome

Reversing the usual build order
Most trading systems come together in a familiar sequence. The entry idea arrives first. Then the exits get tuned, the backtest runs, and somewhere near the end of the report a maximum drawdown number appears — which the developer either accepts or tries to tweak away.
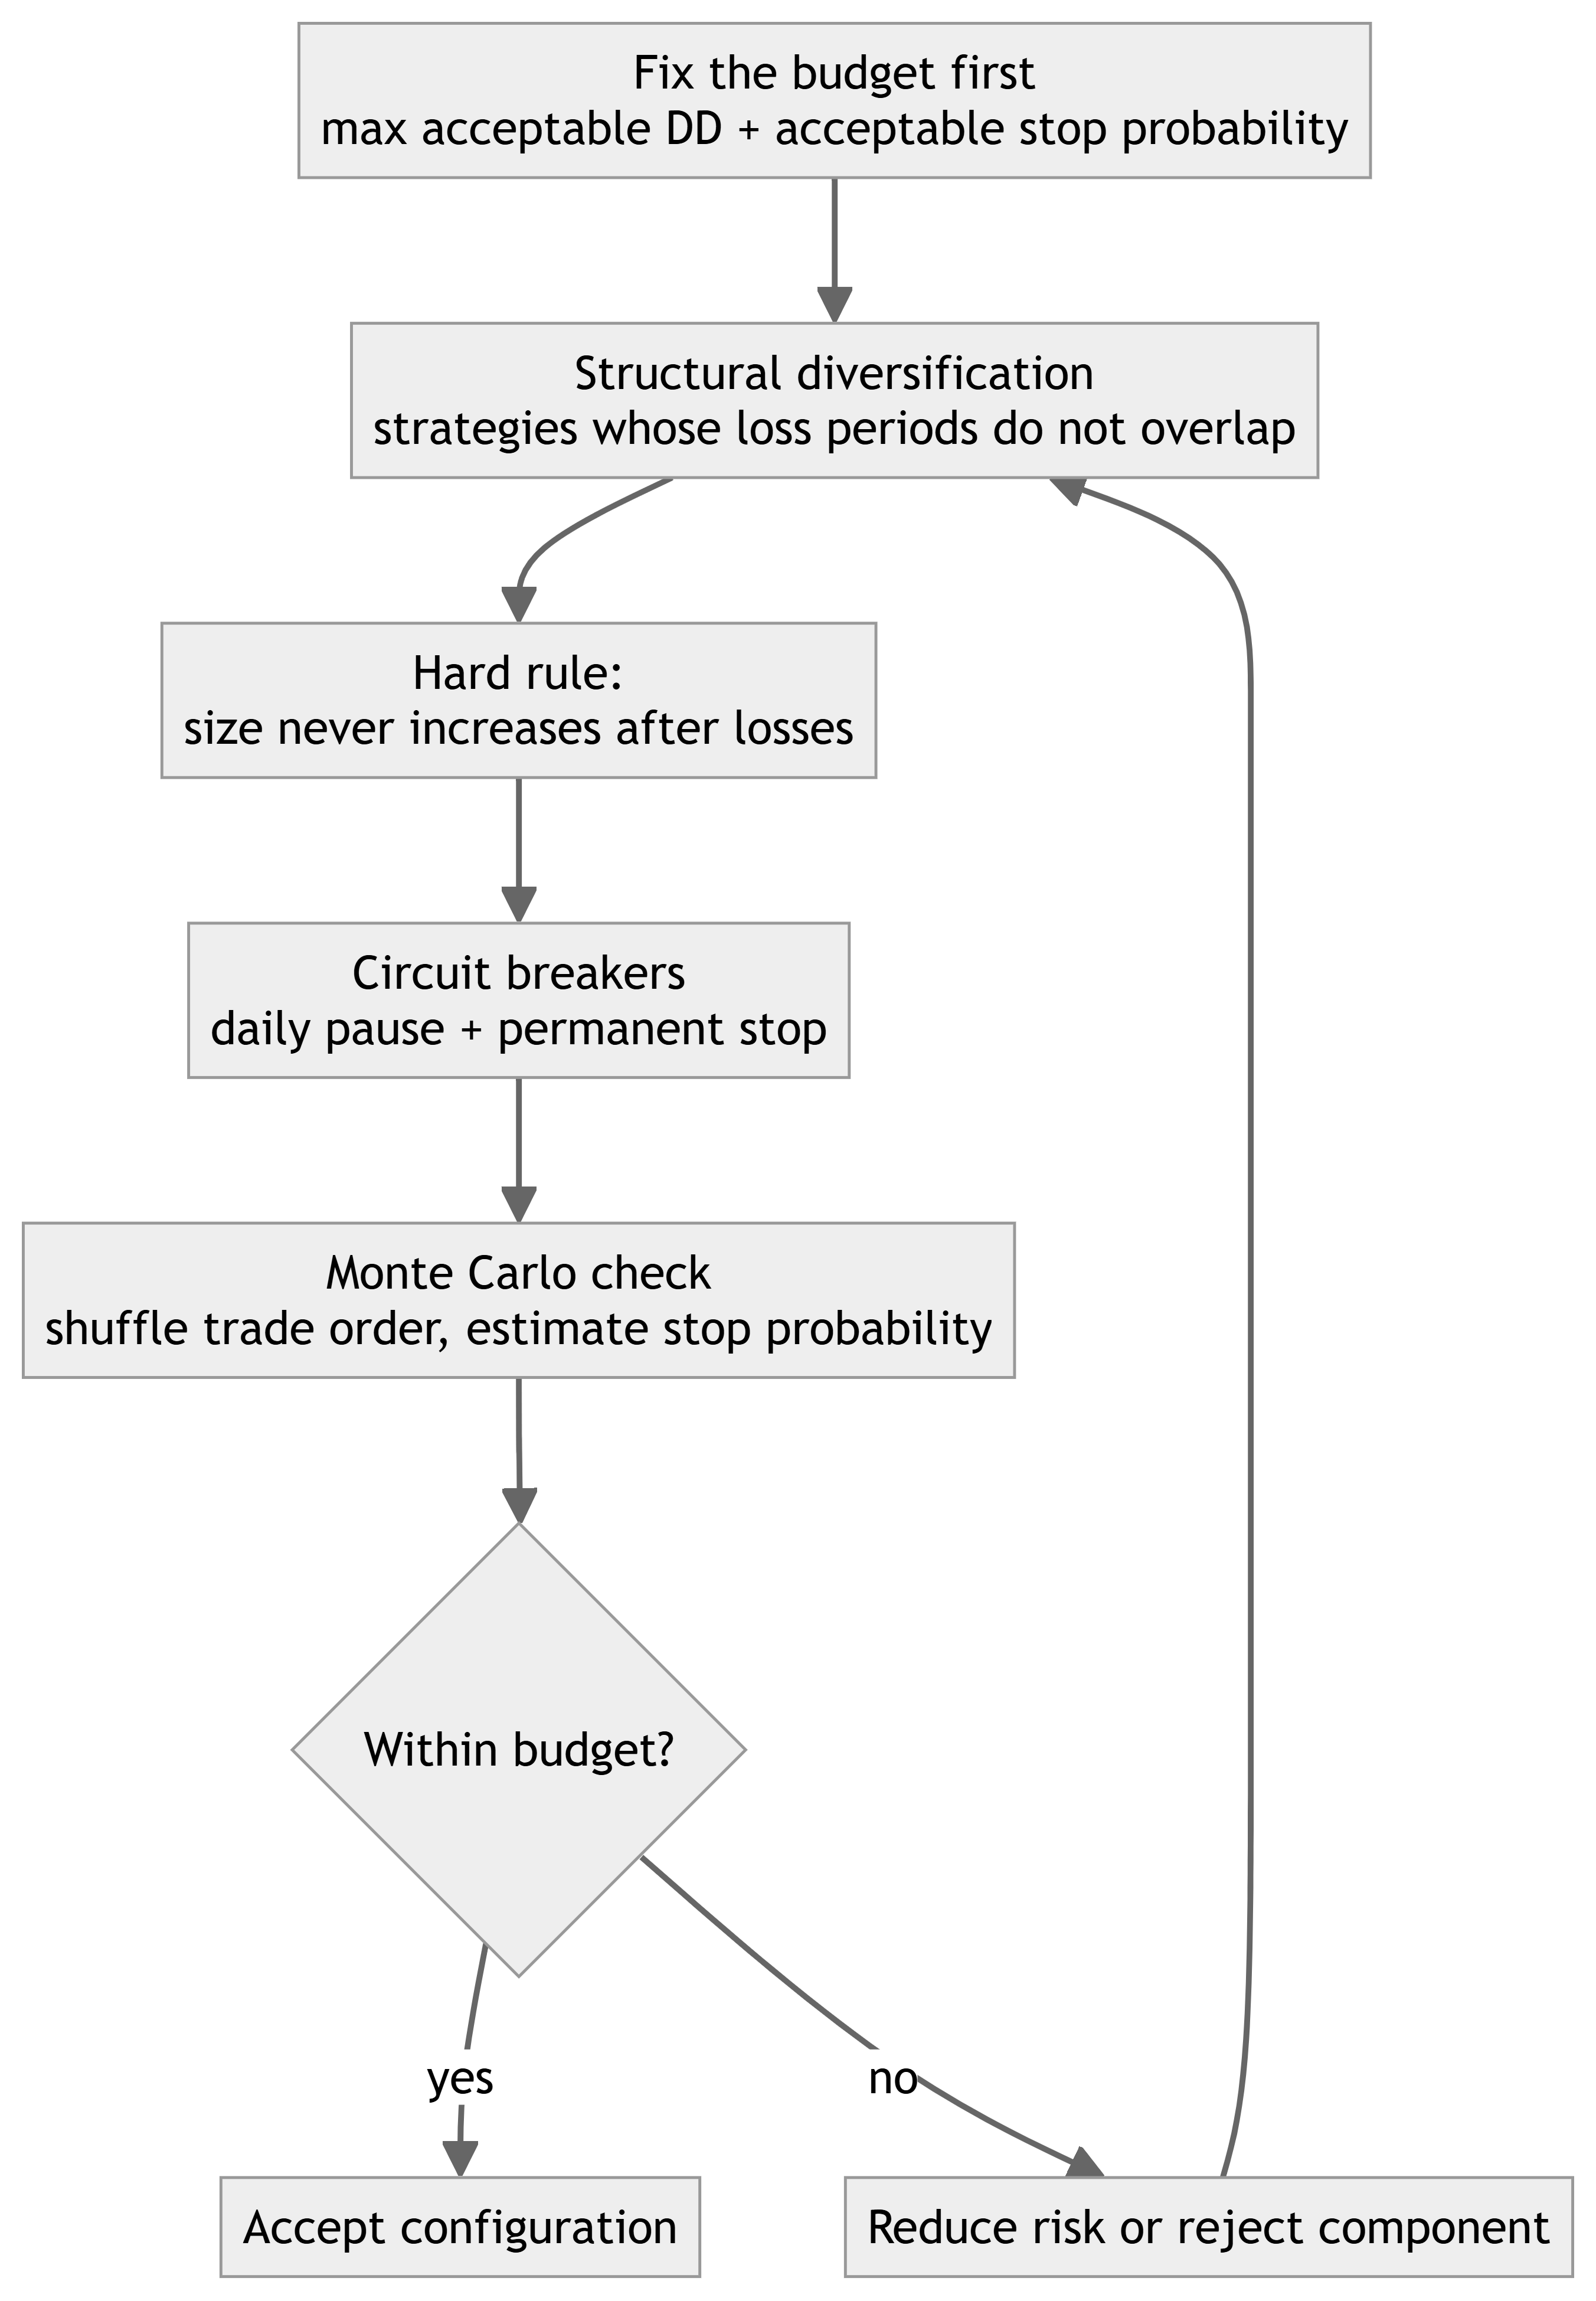
We build in the opposite order. Before writing any strategy logic, we decide how much drawdown the system will be allowed to produce, and how much probability of hitting a hard stop we are willing to live with. Those two numbers then work as fixed constraints. Everything that comes later — how many strategies to combine, how positions are sized, when the system has to shut itself down — must fit inside them. When a promising idea cannot live within the drawdown budget, the idea is dropped. The budget stays.
On paper this looks like a small change of emphasis. In practice it touches almost every decision that follows, so the rest of this article walks through the four design levers we actually use, and what each one costs.
Why drawdown comes first
There are two reasons, one mathematical and one human.
The mathematical one is familiar but worth stating precisely. Losses and gains are not symmetric: recovering from a 20% drawdown requires a 25% gain, and recovering from 50% requires 100%. Those percentages are arithmetic, not a test result. Compounding punishes deep holes far more than it rewards tall peaks, which is why a system that avoids deep holes can grow steadily on fairly modest returns.
The human reason receives less attention in quantitative writing, and it probably matters more. A system only compounds if someone keeps running it, and deep drawdowns are exactly where people stop — they abandon the system, override it by hand, or switch it off near the bottom. A strategy that produces 30% drawdowns does not really own its backtested return, because very few operators will sit through the stretch required to collect it. Designing for low drawdown is, in part, designing for the operator's ability to stay in the game.
Lever one: strategies that lose at different times
However carefully a single trading logic is built, there are market conditions it cannot handle. Logic that profits in trending markets tends to give money back in long ranges. Behavior that works during one trading session often fails in another. Parameter tuning does not remove this, because the cause is not a bad setting — one model can only describe one slice of how the market behaves.
The portfolio answer is not simply "run more strategies." It is: run strategies whose bad periods arrive at different times. In our USDJPY research we ended up with four, each tied to a different piece of market behavior — following sustained directional moves, trading the formation and breakdown of the Tokyo session range, fading the flow imbalance that builds around the Tokyo fix, and riding the continuation of New York session breakouts. Trend and mean reversion, different sessions, different holding logic.
For drawdown, the timing is the whole point. When loss periods do not coincide, the worst stretch of the combined system is shallower than the worst stretch of its parts. The equity curve becomes smoother not because any component improved, but because their bad weeks stopped lining up.
Reaching that combination took most of the research effort. We converted 86 candidate hypotheses into mechanical rules and tested them against roughly two decades of USDJPY tick data; about 95% did not meet the predefined selection criteria and were not adopted. Four survived. We mention the ratio because it sets expectations honestly: strategies that are individually valid and also lose at different times are rare, and assembling a low-drawdown portfolio mostly consists of declining candidates.
A side effect worth noticing: a portfolio of session-specific strategies does not trade every day. On Japanese public holidays there is no Tokyo fix flow, so the fix-fade component simply stays out. Accepting a day without trades is itself a drawdown decision. Forcing activity on a day when the reason to trade is absent only adds noise to the curve.
Lever two: position size never responds to losses
The fastest way to turn a small drawdown into a terminal one is to increase size while losing. The idea keeps returning under different names — martingale, averaging down, grid recovery — because on paper it works. Losing streaks appear to end sooner, and the balance curve looks smoother.
Rather than reject it on reputation, we tested it directly: fourteen variants — eight martingale progressions, four averaging-down schemes, two grids — over twelve years of data. None met the criteria we had set in advance.
The classic double-down martingale made the mechanism easy to see. Its total profit quadrupled on paper. Walking the actual historical price path, however, the account was down 18% within the first year of operation, and the maximum position reached 32 times the base size. The additional profit did not come from any improvement in the trades. It came from holding ever-larger positions through losing stretches — remove the size escalation, and the advantage disappears with it.
So the conclusion became a hard rule: nothing in the system may increase lot size after a loss. Position risk is decided before the trade, from pre-defined settings, and a losing streak changes nothing about the next trade's size. That single prohibition removes an entire class of ruin scenarios from the design.
Lever three: circuit breakers, and what they charge
Software engineers assume processes will crash, so they build watchdogs and kill switches. A trading system deserves the same treatment, because sooner or later the market produces conditions its logic was never designed for.
We use two layers. A daily breaker pauses new entries for the rest of the day once the day's loss reaches 6%. Above it sits a permanent stop: if account equity falls 18% from its peak, the system halts and does not restart itself. There is no automatic recovery and deliberately no mode that tries to win the loss back — in testing, mechanisms that traded their way out of that state by raising size only increased the probability of ruin.
It is worth being clear about the price. A permanent stop converts a large open-ended drawdown into a fixed, known loss, and in exchange you give up the scenarios where the market bounces and the account recovers on its own. Some of those abandoned paths would have recovered. We accept losing them, because the paths we remove instead are the unbounded ones. Capping the worst case is the entire purpose of the mechanism.
Lever four: measure the probability of hitting the stop
A hard stop only helps if the system rarely reaches it, and that likelihood has to be measured rather than assumed. A single backtest cannot measure it. One history shows one ordering of trades, and the same trades in a crueler order produce a deeper drawdown.
So we shuffle the order. Randomizing the backtest's trade sequence 20,000 times gives a distribution of drawdown paths, and from that distribution, an estimate of how often the 18% permanent stop would be reached. At our default risk setting the estimate is 1.35%.
This one number keeps the design honest, because it shows what raising risk actually buys. Our published risk table — all backtest figures — makes the trade visible:
| Risk setting | CAGR (19y) | Max drawdown | Probability of reaching the 18% stop |
|---|---|---|---|
| Default | 12.7% | 5.2% | 1.35% |
| Medium | 16.0% | 6.4% | 7.75% |
| High | 2.7% | 19.0% | 17.9% |
The last row deserves a slow read. The High setting was supposed to be the aggressive, high-return configuration, yet its backtested CAGR is 2.7% — the lowest of the three. On the historical path it reached the 18% permanent stop during the 2010 yen surge, and once a system stops permanently, compounding ends with it. Whatever growth the calmer settings went on to earn over the following years simply never happened for this one.
That is the cost of ignoring drawdown design, printed in a table. Return did not scale with risk. Past a threshold, more risk bought a higher chance of not being in the market at all.
What this produced, and what it gave up
Stacking the four levers produced the following results in our backtests over 2007–2026 on real USDJPY tick data, with real-tick modeling and spread and commission included: a maximum drawdown of 5.2% at the default setting, a 12.7% CAGR, and all nineteen full years positive. These are backtest figures, not live results, and we label them that way everywhere they appear.

One measurement detail is worth copying even if you copy nothing else. State the basis of your drawdown number. Ours is measured on balance; an equity-based figure, which includes open floating losses, can read differently on the same test. Neither basis is wrong, but comparing a balance-based number from one system with an equity-based number from another quietly flatters whichever system held its losers open longer. Whenever you evaluate a published drawdown — including ours — the first question is which curve it was measured on.
Notice also what the results table does not contain: spectacular years. A drawdown-first design will underperform aggressive systems during their good stretches, and the table shows we knowingly declined a 16.0% CAGR configuration as the default because it carried nearly six times the stop probability. Whether that trade is right for you depends on an honest answer to the question this article began with — how much drawdown are you actually prepared to live through? Most people, in our view, overestimate that number until they are inside a real one.
Consistency has a quiet advantage of its own. A system that finishes every year positive never needs a heroic recovery year, and its operator never faces the "do I turn it off?" decision at the worst possible moment. Over two decades, staying running is most of the return.
Closing
If you are building or evaluating an EA right now, the four levers translate into four questions worth asking before you look at any return figure. What drawdown budget was fixed before development started, if any? Do losing periods of the components overlap, or interleave? Does anything anywhere in the system increase size after losses? And has anyone estimated the probability of reaching the worst-case level, rather than trusting the single path one backtest happens to show?
Origin-U Project is an independent quantitative foreign exchange research project based in Japan. The concepts discussed in this article are implemented in Bushido, a commercial USDJPY portfolio EA developed by Origin-U Project.
Low drawdown, in the end, is not a lucky property that some backtests happen to have. It is what remains after a series of deliberate refusals — of over-concentrated logic, of loss-scaled position sizing, of unbounded worst cases — each of which charges a visible price in forgone return. Historical results, ours included, describe the past and should not be read as a forecast.
Origin-U Research Notes — Part 9 of 10
← Previous: How We Evaluate Trading Ideas Before Implementation | Next: Lessons Learned from Long-Term USDJPY Research: What 20 Years of Tick Data Taught Us →
日本語版: 低ドローダウンのトレーディングシステム設計 — ドローダウンは「結果」ではなく「入力」である
Full series
- Building a Multi-Strategy Portfolio EA for USDJPY: What 86 Tested Hypotheses Taught Us
- Why Diversification Matters in Algorithmic Trading
- Risk Management Before Profit: Designing the Loss Side of a Trading System First
- Why We Chose Not to Use Martingale or Grid Systems
- Using Monte Carlo Simulation to Evaluate Trading Systems
- What Makes a Robust Forex Strategy: Judging the Process, Not the Chart
- The Difference Between Backtesting and Forward Testing
- How We Evaluate Trading Ideas Before Implementation
- Designing Low Drawdown Trading Systems: Drawdown as an Input, Not an Outcome
- Lessons Learned from Long-Term USDJPY Research: What 20 Years of Tick Data Taught Us




