
Every algorithmic trader eventually runs into the same uncomfortable fact: the best strategy you have will, at some point, stop making money for months.
Usually nothing is broken. The market condition that feeds the strategy has simply gone away for a while. A breakout system needs breakouts, and a mean-reversion system needs prices that stretch too far and snap back. When the market stops supplying that raw material, the strategy waits — or worse, keeps trading and gives profits back.
You cannot optimize this away, because the cause is the market rather than the code. From a research perspective, the practical question is not "how do I build a strategy that always works?" — that strategy does not exist, and chasing it usually produces an overfitted one. The better question is what to do about the months when your strategy has nothing to work with.
Diversification is the standard answer. The word gets used loosely, though, so it is worth being precise about which kind of diversification actually helps.
More symbols is not the same as more diversification
The most common form of diversification is adding instruments: run the same EA on EURUSD, GBPUSD and USDJPY, and the portfolio looks diversified.
Often it is not. Major currency pairs share macro drivers — US interest rate expectations, risk sentiment, dollar flows. When a shock hits, correlations rise, and three "diversified" positions behave like one large position with extra spread costs. Running more symbols also multiplies the practical workload: more data to validate, more execution behavior to monitor, more broker-specific quirks to handle.
There is a second axis that gets less attention. You can hold the instrument fixed and diversify the reason for trading it. Two strategies on the same pair can be less correlated than one strategy on two pairs, provided they exploit genuinely different market mechanics.
That is the approach we took in our own USDJPY research, and it shaped everything that followed.
Why one trading logic cannot cover every market phase
To see why this works, look at why a single logic fails.
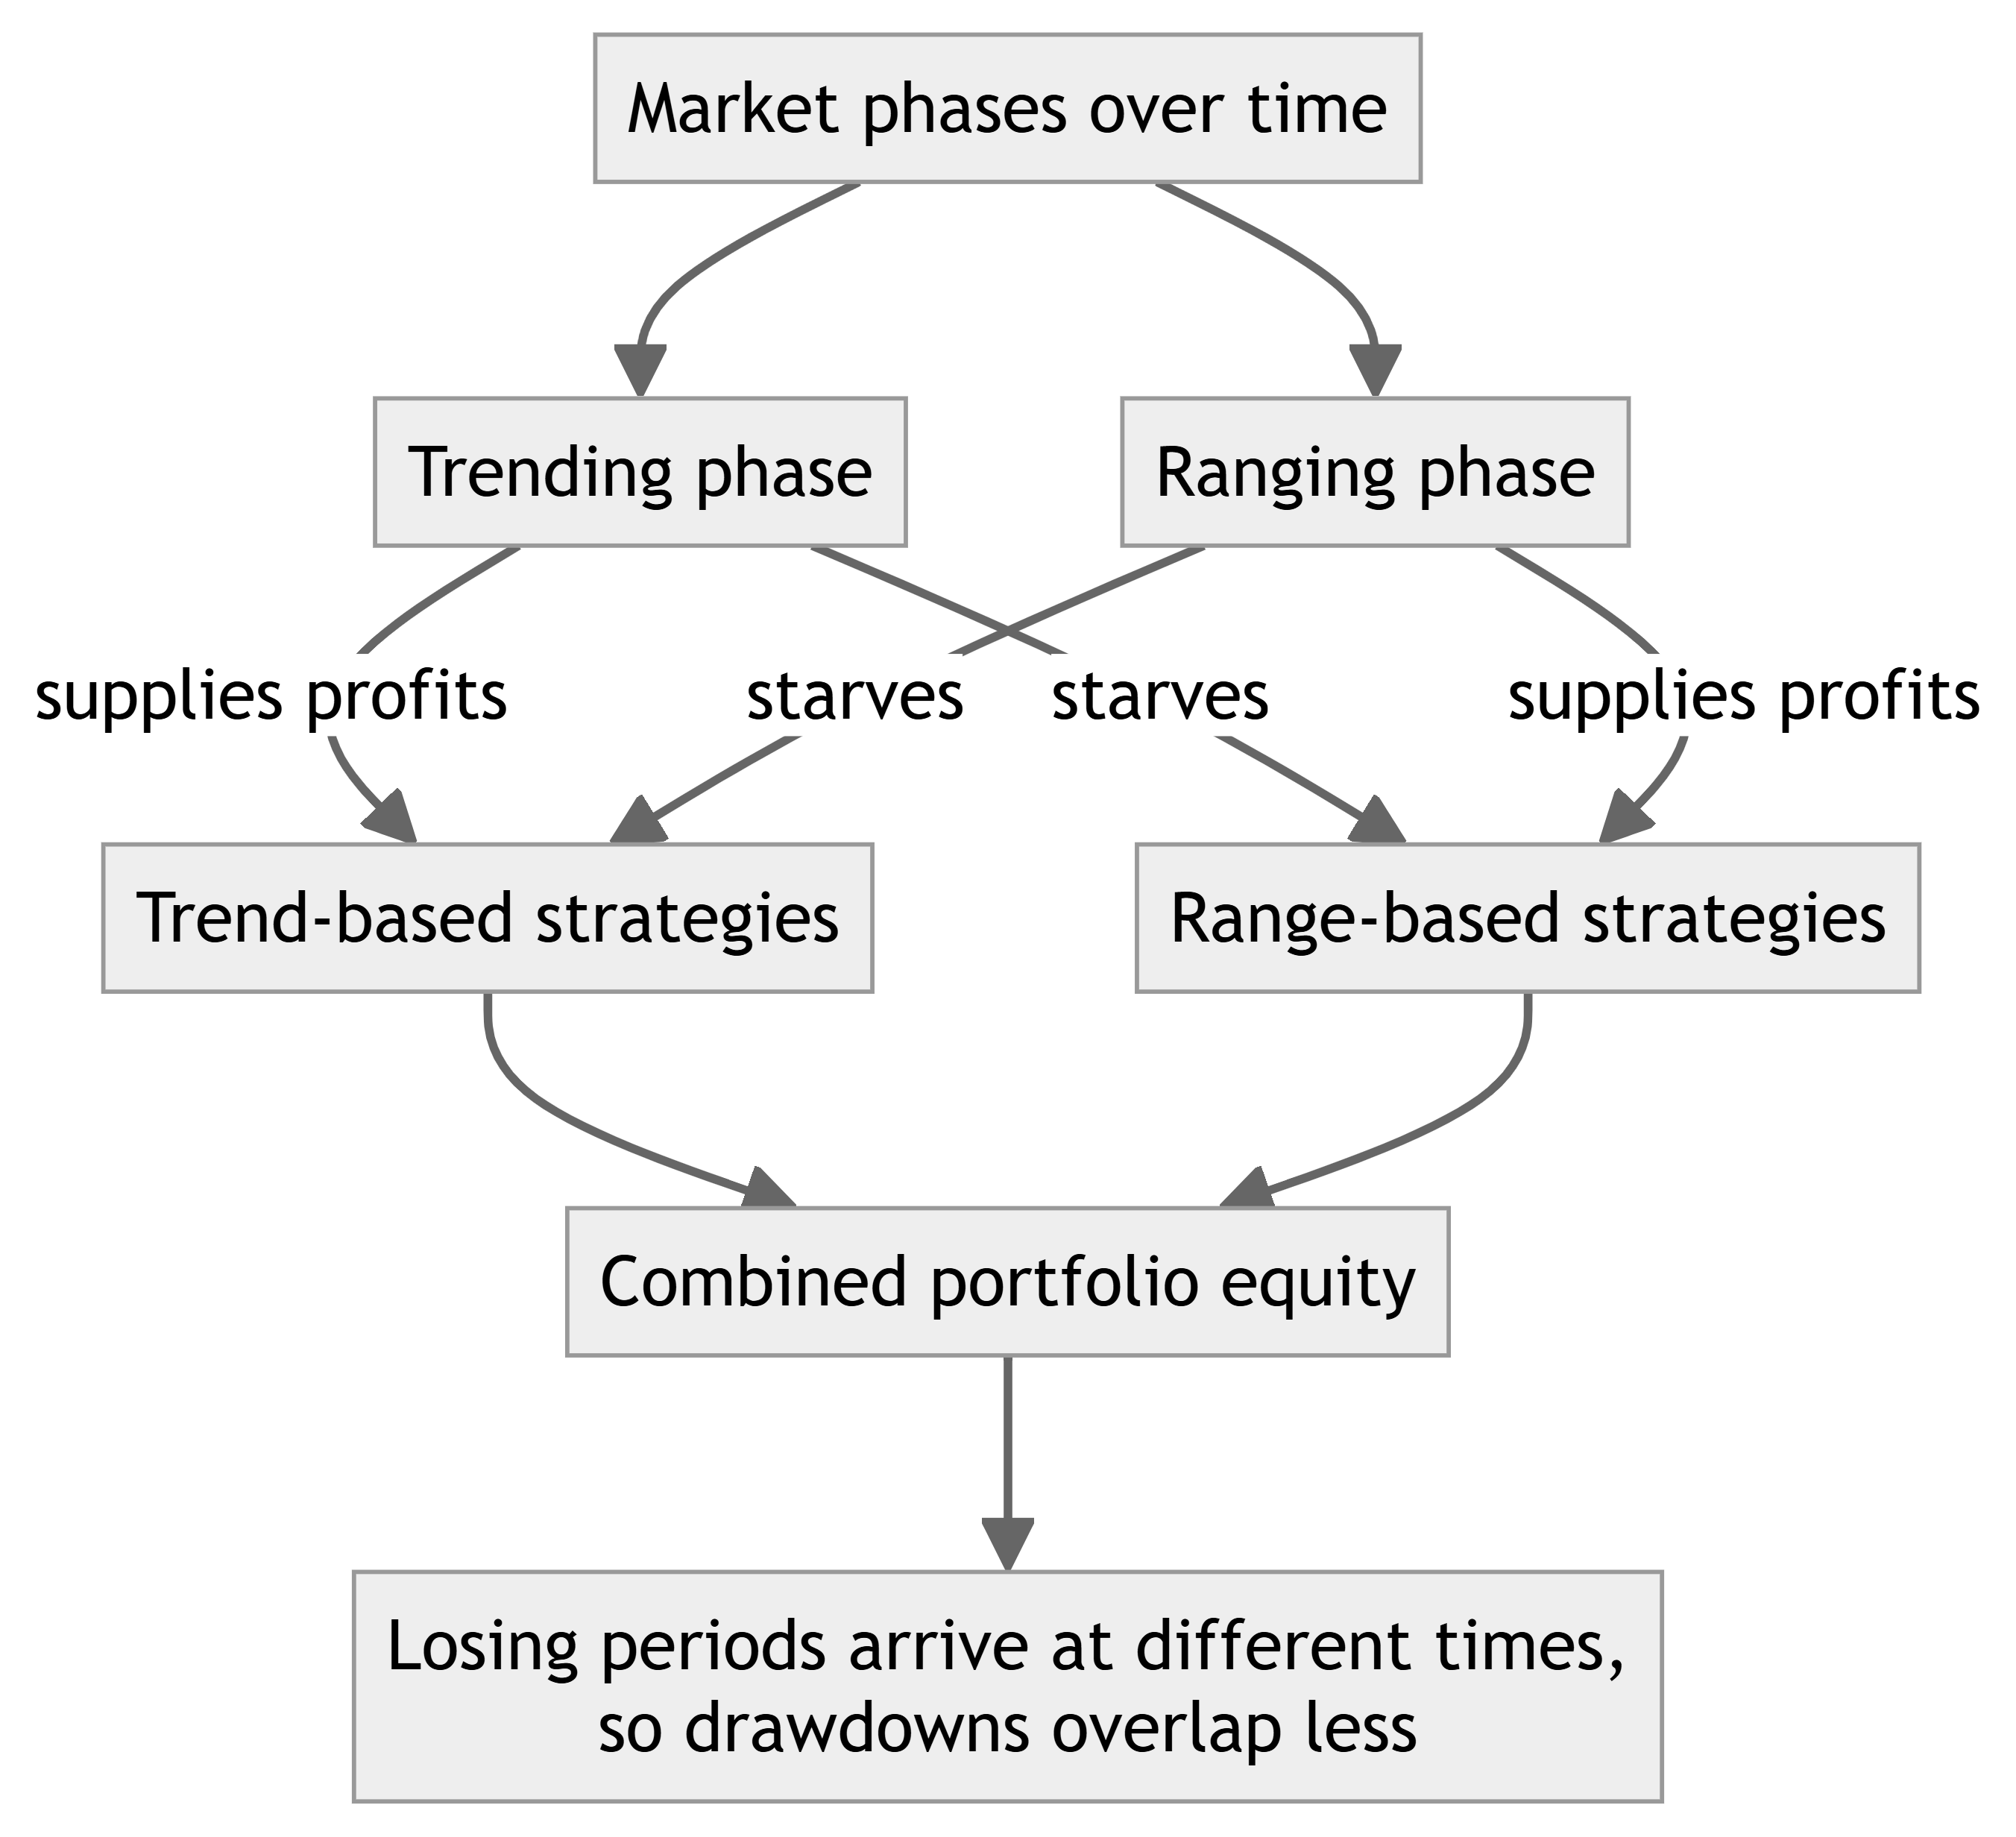
A trend-following system makes money when a directional move continues. Its losing environment is just as specific: a range, where every breakout attempt reverses and the system repeatedly buys strength that fades. The equity curve bleeds in small, steady cuts even though nothing is malfunctioning. Invert the picture and the same applies to range-based logic, which suffers when a real trend arrives and keeps fading a move that refuses to stop.
Trading sessions add another layer. The foreign exchange day is not one homogeneous market: Tokyo, London and New York have different participants, different liquidity, and different typical behavior. USDJPY makes this unusually concrete. Japanese institutional flows concentrate in Tokyo hours, and the daily fix creates short-lived supply and demand imbalances that simply do not exist at 3 p.m. in New York. A rule that captures Tokyo behavior is not a general law of the market, and assuming it transfers to another session means trading a pattern that is not there.
This phase-dependence is exactly what makes diversification within one instrument possible. Different market phases punish different logic, so their losing periods land at different times.
What we actually selected for
During our long-term USDJPY research we mechanized and tested 86 trading hypotheses drawn from books and common trading lore, running more than 200,000 simulations against roughly 20 years of real tick data. About 95% were rejected. Four strategies survived.
The survivors were not the four with the prettiest equity curves. Our adoption condition was stricter: each strategy had to have an edge we could explain through market structure. A profitable backtest with no explanation behind it is just a pattern that happened to repeat in the past, and patterns without reasons tend to vanish out of sample.
The four that passed rely on deliberately different mechanics:
- Trend Following — participation in directional moves that persist
- Tokyo Range Break — the formation and breakdown of the Tokyo-session range
- Tokyo Fix Fade — the reversal of flow imbalances around the Tokyo fix
- NY Break Continuation — follow-through of New York session breakouts
Notice what the list is claiming. Each strategy needs a different market condition to exist: one needs persistence, one needs a session range and its failure, one needs a recurring institutional flow event, one needs New York momentum. They are four separate answers to the question "why should this trade make money?"
That distinction — a different reason, not just different parameters — is, in our experience, the single most useful test when deciding whether adding a strategy actually diversifies anything. Ten moving-average crossovers with different periods are one strategy wearing ten hats, and they will all drown in the same range.
What combining does to drawdown
The benefit shows up less in returns and more in the shape of the equity curve.
The mechanical logic is simple. Every strategy has losing periods. If your strategies lose at different times — because their losing environments are different — then at most moments some part of the portfolio is flat or profitable while another part struggles. Drawdowns become shallower than the sum of the parts would suggest, because the losses rarely stack on the same dates.
The effect is easiest to see in long tests. In our backtest of the combined four-strategy portfolio — 19 full years of USDJPY, 2007 through 2026, on real tick data with realistic trading costs included — every one of the 19 years closed positive, with an average annual return of 12.7% (19-year CAGR) against a maximum drawdown of 5.2% at the default risk setting. Those are backtest figures, measured on historical data, not a promise about the future. But the ratio is the part worth studying: the drawdown stayed small relative to the return, and no single year needed a heroic recovery. That shape is what uncorrelated losing periods buy.
A single-logic system with the same average return would almost certainly have carried deeper drawdowns through its starving phases. Deep drawdowns are not just uncomfortable. They invite intervention, parameter tinkering after losses, and the quiet abandonment of a system at exactly the wrong moment.
One more observation from the same research corrects a common misunderstanding: diversification does not remove the risk-return tradeoff, it only gives you a better starting point. In the same 19-year backtest, raising the portfolio's risk setting one step lifted the average annual return from 12.7% to 16.0%, and the maximum drawdown moved from 5.2% to 6.4% in the same direction. The portfolio structure stayed identical; only the risk dial moved. Combining strategies with unrelated losing periods improves the shape of the curve, but once that shape is fixed, more return still costs more drawdown. Anyone claiming that diversification alone can raise returns while shrinking risk without limit is describing arithmetic that does not exist.
Where diversification stops helping
It is worth stating plainly what diversification does not do.
It thins losses; it does not erase them. There are stress periods when normally unrelated mechanics get hit together — a sharp volatility shock can hurt a trend system and a fade system in the same week. Correlations between strategies are not constants. They are usually low and occasionally, briefly, not.
A diversified portfolio can also still have losing stretches. Diversification reduces the chance that several strategies fail for the same reason at the same time, but it cannot eliminate losing periods — and historical backtest results, however long the test, should not be treated as a forecast.
And sometimes real diversification means not trading. If a strategy exists to exploit a specific flow, then on days when that flow is absent, the honest action is to stand aside. In our portfolio, the fix-related strategy pauses automatically on Japanese public holidays, because the institutional flow it trades does not occur on those days. A portfolio that must trade every day, on every strategy, has already given up the logic that justified diversification in the first place.
Two questions that audit any portfolio
If you run more than one strategy, or you are evaluating a multi-strategy EA, two questions expose most of the truth.
Can you state, in one sentence per strategy, the reason it makes money? Not "it uses RSI and a trend filter" — that is implementation. Something closer to "it profits when session-open imbalances revert." If the sentence does not mention a market mechanism, the strategy is a pattern, not an edge.
Do the losing periods overlap? Take each strategy's historical results and look at when the bad months happen. If they cluster on the same dates, you own one risk in several wrappers. If they interleave, the combination is doing real work. This check needs no advanced statistics — a calendar and honesty are enough.
A practical note on running the second check: use monthly or yearly return tables, not equity-curve screenshots. A smooth combined curve can hide the fact that one strategy carried three quiet years while the others idled. Tables put the same dates side by side and make clustering obvious. If a vendor or a backtest report only shows the blended curve and never the parts, you cannot perform this audit at all — which is itself information.
Hypothetically, if you ran this audit and found that your five systems all lose in ranging markets, the fix is not a sixth trend system with different settings. It is one strategy — any strategy — whose reason to exist lives in a different part of the market's behavior.
Closing
On a single instrument, diversification is not a portfolio-theory formality. It is a deliberate collection of strategies that need different market conditions, chosen so that no single phase of the market can starve the whole system at once. Most candidates fail that selection — in our research, roughly 95% of them — which is inconvenient, and also the point.
The concepts discussed in this article are implemented in Bushido, a commercial USDJPY portfolio EA developed by Origin-U Project, an independent quantitative foreign exchange research project based in Japan.
Origin-U Research Notes — Part 2 of 10
← Previous: Building a Multi-Strategy Portfolio EA for USDJPY: What 86 Tested Hypotheses Taught Us | Next: Risk Management Before Profit: Designing the Loss Side of a Trading System First →
日本語版: アルゴリズムトレードで分散が重要になる本当の理由
Full series
- Building a Multi-Strategy Portfolio EA for USDJPY: What 86 Tested Hypotheses Taught Us
- Why Diversification Matters in Algorithmic Trading
- Risk Management Before Profit: Designing the Loss Side of a Trading System First
- Why We Chose Not to Use Martingale or Grid Systems
- Using Monte Carlo Simulation to Evaluate Trading Systems
- What Makes a Robust Forex Strategy: Judging the Process, Not the Chart
- The Difference Between Backtesting and Forward Testing
- How We Evaluate Trading Ideas Before Implementation
- Designing Low Drawdown Trading Systems: Drawdown as an Input, Not an Outcome
- Lessons Learned from Long-Term USDJPY Research: What 20 Years of Tick Data Taught Us




