Lessons Learned from Long-Term USDJPY Research: What 20 Years of Tick Data Taught Us

This is the last article in this series, so it seems like the right place to step back from individual techniques and ask a broader question: what does long-horizon research teach you that short projects cannot?
Our research project tested USDJPY trading ideas against roughly 20 years of tick data, across a backtest window covering 2007 through 2026 — 19 full calendar years. Along the way we mechanized 86 distinct trading hypotheses and ran more than 200,000 simulations. Most of what we learned did not come from the strategies that worked. It came from the testing itself.
The five lessons below are the ones we keep coming back to. None of them are secrets, but each one cost us real time to learn, and each one changed how we work. If you are building or evaluating a Forex EA, reading them should be cheaper than rediscovering them.
Lesson 1: Data quality decides everything downstream
Nothing in a backtest means anything until you trust the data underneath it.
This sounds obvious. In practice it is the step most people skip, because the default path is so convenient: open the strategy tester, use whatever history the broker ships, and start optimizing. The problem is that broker-supplied history typically contains only a few years of genuine tick data. Everything older is reconstructed from one-minute bars, which changes how entries, exits, and stops behave in simulation.
Before we drew any conclusions from our own testing, we had to build and verify the dataset itself: about 20 years of real USDJPY ticks from a Dukascopy-sourced export, imported into MetaTrader 5 as a custom symbol, tested with real-tick modeling at 98% history quality, with a total trading cost assumption of about 0.7 pips built into every run.
The least glamorous part turned out to matter most: the server timezone. Our dataset runs on GMT+2/+3 with US daylight-saving adjustment — the common "New York close" convention. A strategy that reasons about trading sessions will silently test something entirely different if the data uses another timezone. Same code, same parameters, different system. And the strategy tester will not warn you about any of this.
The practical takeaway is to budget real time for data verification before strategy work, and to treat it as part of the research rather than setup friction. If you cannot say what timezone your history uses, you do not yet know what your backtest measured.
Lesson 2: Most ideas do not survive contact with a rule
Roughly 95% of those 86 hypotheses were rejected. The number surprises people, so it is worth explaining where the hypotheses came from and what "rejected" means.
Most of them were not our inventions. They were methods described in trading books and trading communities — approaches with names, followings, and long histories. We translated each one into fixed mechanical rules and ran it against the full dataset. The rejection rate among well-known methods was not much better than among our own ideas.
This needs careful phrasing, because the point is not that those methods are worthless or that their advocates are wrong. A discretionary trader applying judgment is doing something a fixed rule cannot fully capture. What we can say is narrower and more useful: when converted to mechanical rules and tested over two decades of tick data, most of these methods showed no measurable edge. Whatever value they hold seems to live in the judgment layer, not in the rule layer — and an EA can only trade the rule layer.
There is a second, quieter reason so many ideas fail: vague descriptions hide hindsight. A phrase like "enter on a clear breakout" works beautifully in a book because "clear" gets defined after the fact, chart by chart. The moment you commit to a definition precise enough for code, the ambiguity that made the method look reliable disappears.
If only a few percent of candidate ideas survive honest testing, then a high rejection rate is not a sign your process is broken — it is a sign your process is working. We came to treat our archive of rejected hypotheses as a real asset. It tells us where not to dig again.
Lesson 3: An edge you cannot explain is an edge you cannot trust
As the rejections accumulated, we adopted a rule that now filters everything: a strategy is only adopted if its edge can be explained by market structure. A good backtest alone is not enough.
The reasoning is statistical as much as philosophical. Test enough ideas against the same dataset and some will look profitable purely by chance, and the more you search, the more impressive the best random result becomes. An identifiable reason why money should flow in your favor at that time, in that situation, is the strongest defense against being fooled this way.
A concrete example from our own work: one of the strategy families we eventually adopted trades around the Tokyo fix, where dealer flows cluster at a known time of day for reasons that have nothing to do with chart patterns. That explanation has a visible consequence in the system's behavior. On Japanese public holidays, when the fix-related flow simply does not occur, the strategy stays flat — not because a filter detected unfavorable conditions, but because the phenomenon it trades does not exist that day.
There is a real trade-off here, and it deserves to be stated plainly. This rule forces you to discard systems that look profitable but resist explanation, and some of those discarded systems might have been genuinely good. We accepted that cost. Over a long horizon, we would rather run fewer strategies we understand than more strategies we hope about.
The same question travels well beyond our project. Before trusting any system — including one you are thinking of buying — ask what its edge is structurally, and what conditions would make that edge disappear. If no answer exists, the backtest is carrying the entire burden of proof, and backtests are weak witnesses.
Lesson 4: Losing periods are normal, even for consistent systems
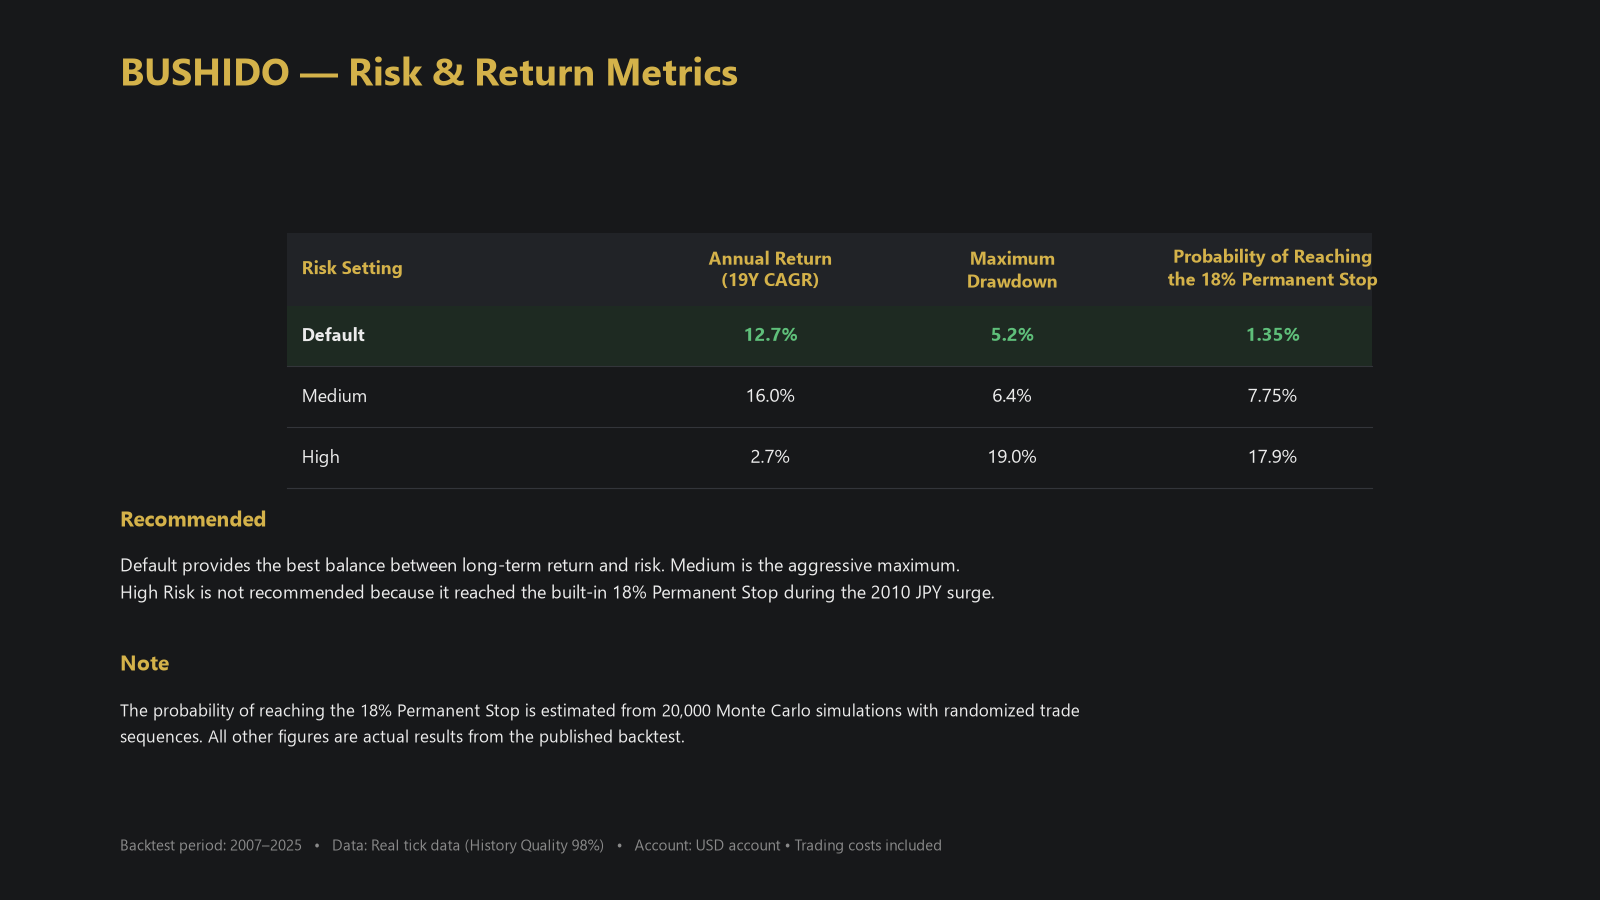
The headline numbers from our long-term test look calm. Over 2007–2026, every one of the 19 full backtest years closed positive, with an average annual return of 12.7% and a maximum drawdown of 5.2% at the default risk setting — balance basis, backtest figures.
It would be easy to read that record as describing a system that does not lose, and that reading is wrong. A calendar year is an accounting interval, not a property of the market. A system can close 19 consecutive years positive and still spend months underwater inside those years. Inside our own test, drawdowns arrived regularly; the system recovered not because losses were rare, but because they stayed inside their designed limits while the edge kept operating. And nineteen data points describe a tendency, not a law — no backtest length converts "no losing year in the sample" into "no losing year possible." Historical results, however consistent, are not a forecast.
That reframes what evaluation should ask. The useful question about any trading system is not "does it lose?" — everything loses. The question is whether losses stay within the boundaries the designer claimed, and what happens when they threaten not to. This is why our own design includes hard answers to that second question: a halt on new entries for the rest of the day once the daily loss reaches 6%, and a permanent stop if equity falls 18% from its peak, with no recovery mode behind it. A system's character shows in how it loses, not in how it wins.
Lesson 5: Research discipline compounds like interest
The lessons above share a failure mode: they are easy to agree with and easy to abandon, one exception at a time. You relax the data check once, peek at the holdout period once, keep one unexplainable strategy because its curve is beautiful. Each exception feels small. Over years, they compound into a research process that mostly manufactures self-deception.
What kept us honest was moving the discipline out of our heads and into procedure. Three habits carried most of the weight.
First, hypotheses and their pass/fail thresholds are registered before testing, so the criteria cannot quietly drift after the results are visible. Second, out-of-sample validation is chronological — later years are held out untouched, never shuffled — because shuffled or hand-picked validation windows leak information and flatter almost any strategy. Third, we estimate ruin probability directly instead of admiring the equity curve: by reshuffling trade order across 20,000 Monte Carlo runs, we estimate the chance of hitting our 18% permanent stop at about 1.35% under the default risk setting.
That third habit produced the single most instructive result of the entire project. When we tested the same strategies at a more aggressive risk setting, the backtest hit the 18% permanent stop during the 2010 yen surge — and the long-run compounded return collapsed to 2.7% per year, far below the 12.7% of the default setting. More risk produced less return, permanently, because one bad stretch crossed the ruin threshold and ended the compounding. Ruin risk does not scale linearly with position size, and no amount of average-case thinking reveals that. You have to test for it.
None of these procedures require institutional resources. They require deciding, in advance, that you are not allowed to negotiate with your own results.
Closing thoughts: research first, product second
Looking back across the series, the common thread is a reversal of the usual order. The typical path builds a promising EA and then gathers evidence for it. Two decades of data taught us to work the other way: run the research honestly, let it reject most of what you try, and let whatever survives become the product. The product is the residue of rejection.
That approach is slower, and it produces less exciting numbers than a curve-fitted demo. What it buys is knowing, with stated limits, why the system does what it does.
Origin-U Project is an independent quantitative foreign exchange research project based in Japan. The concepts discussed in this article are implemented in Bushido, a commercial USDJPY portfolio EA developed by Origin-U Project. All performance figures cited in this article are backtest results and do not guarantee future performance.
Origin-U Research Notes — Part 10 of 10
← Previous: Designing Low Drawdown Trading Systems: Drawdown as an Input, Not an Outcome
日本語版: 長期USDJPYリサーチから学んだこと — 20年分のティックデータが教えてくれたもの
Full series
- Building a Multi-Strategy Portfolio EA for USDJPY: What 86 Tested Hypotheses Taught Us
- Why Diversification Matters in Algorithmic Trading
- Risk Management Before Profit: Designing the Loss Side of a Trading System First
- Why We Chose Not to Use Martingale or Grid Systems
- Using Monte Carlo Simulation to Evaluate Trading Systems
- What Makes a Robust Forex Strategy: Judging the Process, Not the Chart
- The Difference Between Backtesting and Forward Testing
- How We Evaluate Trading Ideas Before Implementation
- Designing Low Drawdown Trading Systems: Drawdown as an Input, Not an Outcome
- Lessons Learned from Long-Term USDJPY Research: What 20 Years of Tick Data Taught Us




