
Every trade you take has a price you see - the entry, the exit, the result - and a price you rarely see: how well your broker filled it. A few cents of slippage here, a slow fill there. Trade by trade it looks like nothing. Over a year of trading it can be the difference between a strategy that works and one that doesn't.
The good news: you don't need to guess. Your own trade history already contains most of the evidence. This post explains how professional trading desks measure execution quality, and how you can apply the same logic to your own MT5 account.
Where execution cost hides
When an order has a requested price - a stop-loss, a take-profit, a pending order - the platform records both the price you asked for and the price you got. The gap between them is slippage. Some is normal: markets move while an order travels. What matters is how much, how often, and in which direction.
Institutional desks call this transaction cost analysis (TCA). European regulation (MiFID II) asks brokers to judge their own execution on a similar list of factors: price, costs, speed, likelihood of execution and size. The same questions work perfectly well for a retail account.
The four things worth measuring
1. How much slippage costs you - both ways. Exits against your stop and target levels, and entries on your pending orders, added together. To compare gold with an index or a currency pair fairly, the cost is measured in spreads per fill: how many of the instrument's own spreads each fill lost on average. Half a spread is ordinary. Two or three is expensive. Slippage in your favour is not a cost and is not counted against the broker.
2. Whether it is fair. A fair venue fills you better than requested about as often as worse. So the question is: for every unit of money slippage gave you, how much did it take? Around 1 : 1 is fair. 3 : 1 against you is not. Looking at it both by money and by count shows whether the imbalance comes from many small fills or a few large ones.
3. How fast. The time from the order reaching the server to the fill. The median tells you the typical case; the 95th percentile tells you about the slow tail, which is where fast markets hurt most. Both matter, so both are used.
4. Whether orders fill in one go. An order filled in several pieces often fills at several prices. Most venues fill retail orders whole, so this matters mainly when it goes wrong.
One weak link is enough
An average can hide a problem: excellent speed does not make up for expensive slippage. That is why a sound score is capped by its weakest part. A broker should not look "good" overall while one of the things you care about is clearly bad.
It also pays to look per symbol. The same account can be filled well on EURUSD and poorly on gold. One overall figure, dominated by your most traded instrument, would never show you that.
What your history cannot tell you
Honesty matters here, because it decides how far you can trust the result:
- Market orders are sent without a requested price, so their slippage cannot be measured from the history. Only orders with a stated price can be.
- Rejections and requotes are not stored in the MT5 history at all.
- Your own strategy shapes your fills. A breakout that enters on a stop order pays slippage at any broker. The numbers describe your fills on your account - not a rating of the company.
- Small samples are noise. A handful of fills proves nothing. A grade needs a few dozen measured fills to mean anything.
How to use it
- Compare your accounts. If you trade the same systems at two brokers, the difference in spreads per fill is real money.
- Watch for change. Compare the last month with the last year. A venue that quietly got worse shows up here first.
- Pick your battles. If one symbol is filled badly, that is a reason to trade it differently, with limit orders, or elsewhere.
- Price it into your backtests. If your real fills cost more than the tester assumed, your live results will trail the backtest by exactly that much.
How Strategy Ledger Pro does it
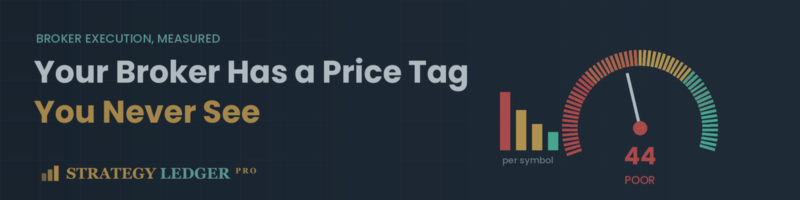
Strategy Ledger Pro applies this method to your own account automatically. Click the broker's name in the panel's header to open the execution report: a score out of 100 built from the four parts above (40 points for slippage, 25 for fairness, 25 for speed, 10 for whole fills), capped by the weakest part, plus a grade for every symbol you trade. The ? in the report explains how your score was built, part by part, and a second page sets the method against transaction cost analysis practice - including exactly what it cannot measure. Everything runs locally, on your data, and the panel never touches your trades.




