Twice the Backtest Profit. A Better EA—or Just a Bigger Position?

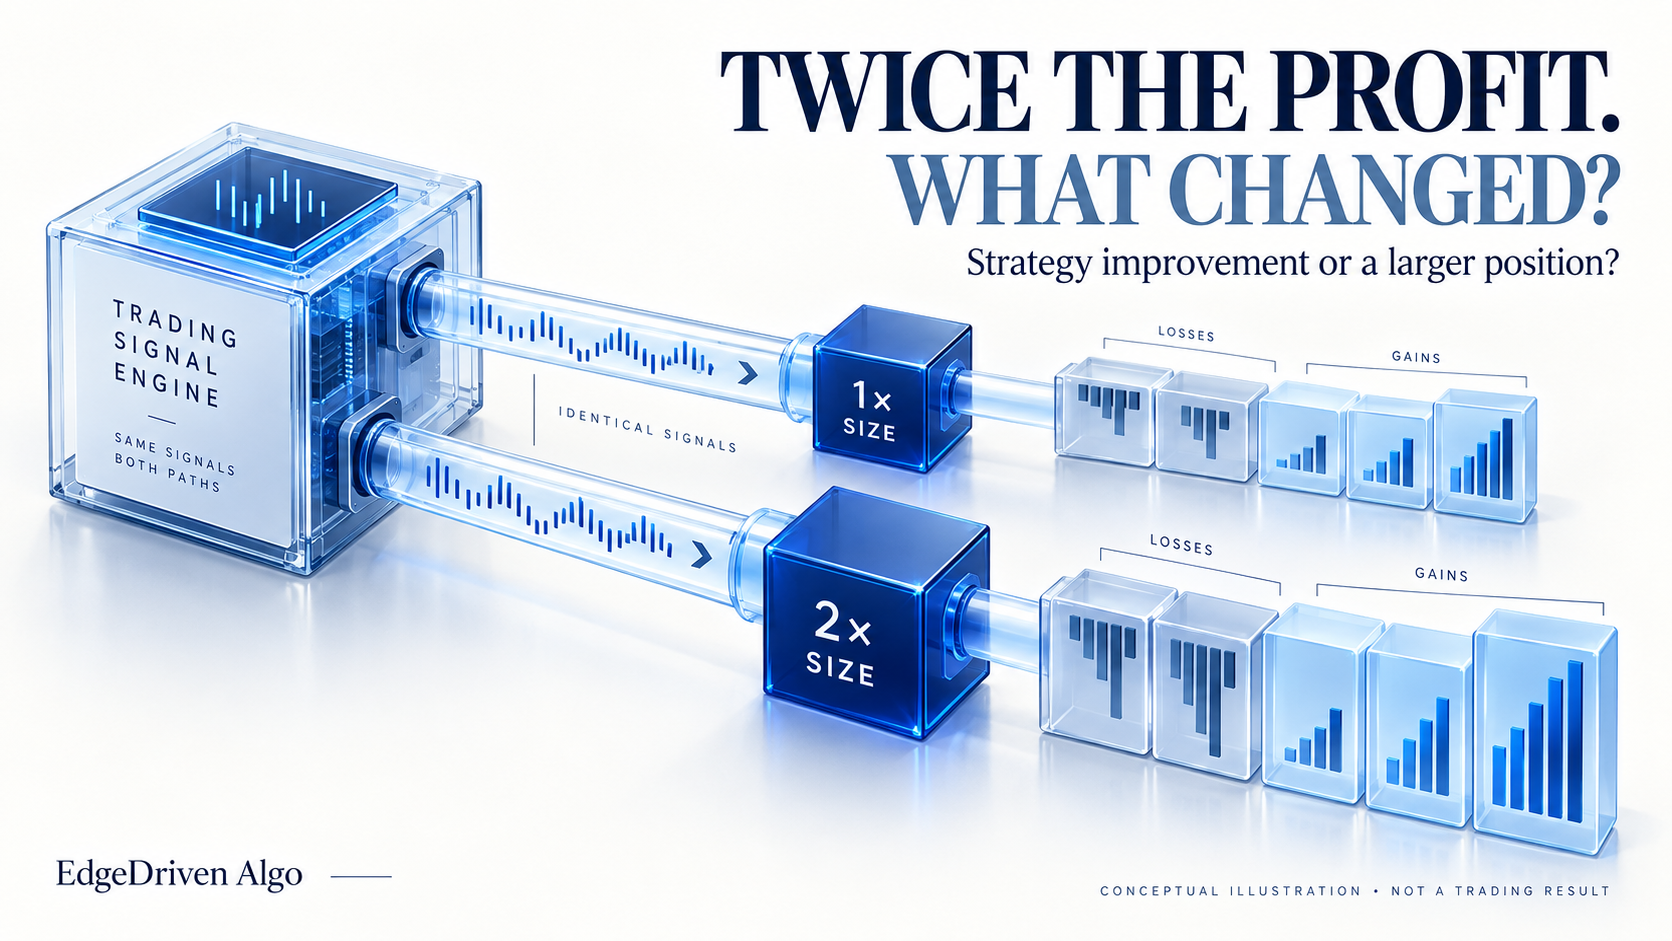 Conceptual illustration; not a trading result.
 The first report makes $1,000. The second makes $2,000. Which EA would you keep?
Before choosing, I would look at one setting that rarely makes it into a screenshot: position size.
If the second test took the same trades at twice the size, the extra profit did not come from finding better entries. We simply put more money behind the same decisions. That can be a reasonable sizing choice, but it tells us something different about the strategy.
The bigger number needs a second number beside it
Here is a small, deliberately invented example. It is not a product backtest.
| Test A | Test B | |
|---|---|---|
| Position size | 1× | 2× |
| Net profit | $1,000 | $2,000 |
| Maximum equity drawdown | $400 | $800 |
| Profit / maximum equity drawdown | 2.5 | 2.5 |
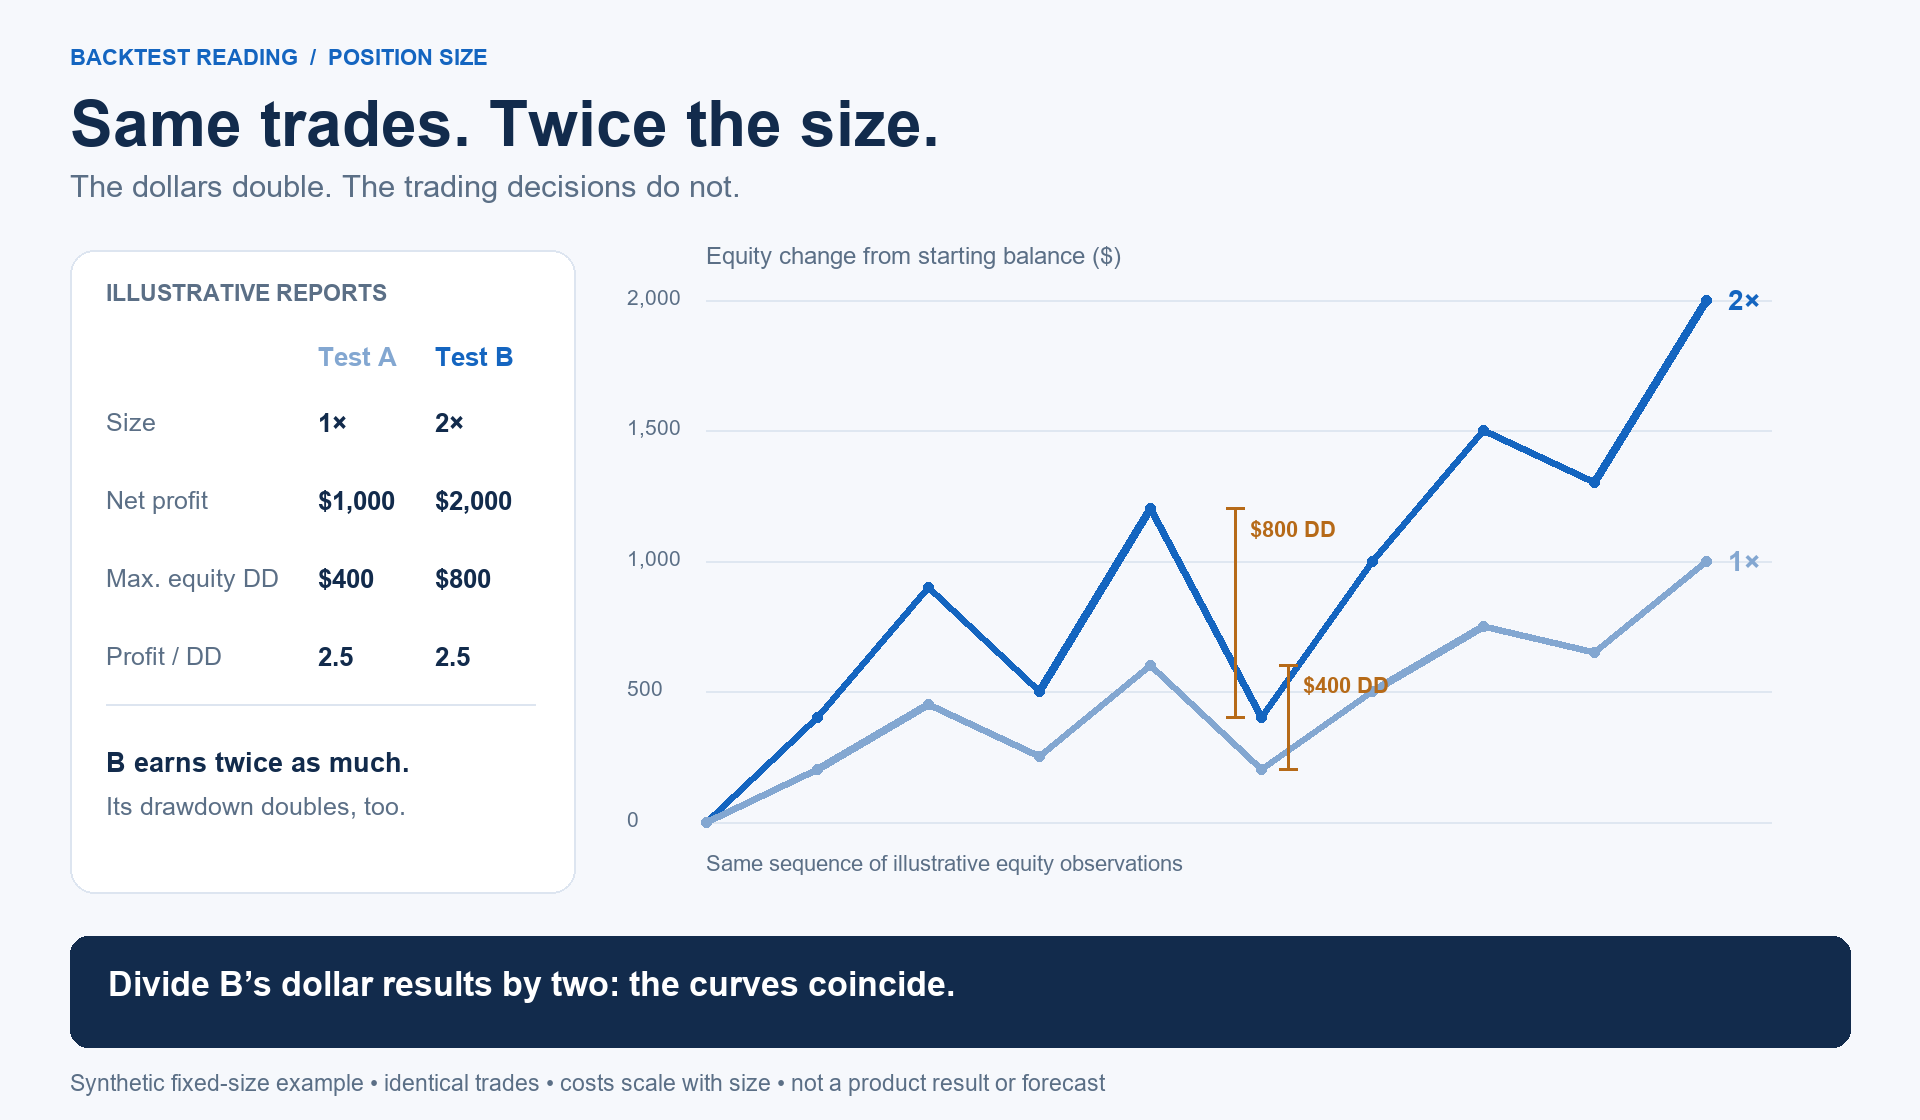 Illustrative equity observations. Both curves use the same dollar scale.
 The entry and exit decisions are identical. For this example, gains, losses and trading costs scale exactly with position size.
B earns more dollars, and its largest decline from an equity peak is also twice as large. Divide its dollar results by two and the two curves sit on top of each other. There is no new trading edge hidden in the taller curve.
This is why I like seeing profit and drawdown on the same page, with the starting balance and sizing rule close by. A profit figure becomes much more useful when I can see what produced it.
Then I open the trade list
Actual backtests are not always neat copies at different sizes. Lot steps can round an order up or down. Margin limits can prevent a position from opening. Compounding changes the size of later trades as the account balance changes.
So I would not take an old report, multiply its profit by two and call that a new test. I would rerun it and compare the trades.
Did both tests start with the same balance? Are the entries and exits the same? Did one miss orders that the other could take? If the trade count changed, I want to know why before giving the extra profit to the strategy.
Often that short inspection is more useful than another hour spent admiring the equity curve.
A fairer comparison still needs judgment
When two genuinely different strategies use different sizing rules, I may compare them near a common historical drawdown level. That makes the return comparison easier to read. It does not make their future risks identical.
One might lose in short, sharp bursts. Another might spend months below its previous peak. A maximum-drawdown number does not tell me which experience I am signing up for, or whether both systems tend to struggle together.
I also want the sizing decision made before evaluating it on separate data. Keep changing the size after seeing that evaluation, and the evaluation has become another part of the fitting process.
Give the right change the credit
There are several good reasons for a report to improve: better entry and exit rules, a useful combination of strategies, or a sizing choice that suits the account better.
I want to know which one I am looking at. If the improvement came from a new rule, I can investigate that rule. If it came from the combination, I can look at how the strategies behave together. If it came from larger positions, the next question is how much exposure I actually want.
That is the question I would ask before keeping the EA with the bigger profit figure.
The figures and curves are illustrative, not live trading results. Historical drawdown is an observation, not a future loss limit.




