Risk Management Before Profit: Designing the Loss Side of a Trading System First

Most conversations about Expert Advisors start in the same place: the entry. Which indicator, which pattern, which session, which timeframe. Risk management, if it appears at all, comes last — a stop-loss bolted on at the end, a lot size chosen by feel.
We build in the opposite order. Before asking how a system wins, we ask how it loses, how much it is allowed to lose, and what should happen after it does. This article explains that reasoning, using the two protection layers we ship in our own USDJPY portfolio EA and some published numbers that show what happens when the risk side is wrong. None of it requires advanced math.
Why the loss side comes first
There is a practical reason to design the loss side before the profit side: the two sides fail differently.
A mediocre entry idea reveals itself in testing. You adjust the design, test again, and the cost of the weak idea is time. A wrong risk design reveals itself in a drawdown, and by then the damage is real capital. An entry rule can be revised after failure; an account cannot. So the part of the system you must get right on the first attempt is not the part that makes money — it is the part that decides how much you can lose while you find out whether the rest works.
Arithmetic makes the same argument more bluntly. A 20% loss needs a 25% gain to recover, and a 50% loss needs 100%. The asymmetry gets worse the deeper you fall, which is why a system that avoids deep holes needs far less brilliance on the way up.
A quieter reason matters too, and in the long run it may matter more. On its own, a profit figure means nothing: an average annual return of 12% can describe a calm system or a terrifying one, and the drawdown behind it decides which. Until the loss side is fixed and measured, the return side is not even interpretable.
Layer one: a daily circuit breaker
The first protection layer works at the scale of a single day. When the day's loss reaches 6% of the account, the EA stops opening new positions until the next trading day.
The idea borrows from exchanges, which have used circuit breakers for decades. Bad days in foreign exchange rarely arrive as isolated accidents; they cluster around news shocks, regime breaks, and conditions the strategy was never designed for. Once a day has already gone badly wrong, the odds that the market is in a state your logic does not understand have gone up, and the cheapest insurance available is to stop adding risk until the calendar turns over.
It is worth being precise about what this layer does not do. It does not close existing positions, does not reverse anything, and does not try to judge why the day went wrong. We prefer this kind of dumb, mechanical protection over clever adaptive logic. A protection layer you cannot predict is a protection layer you cannot trust, and the breaker — one input, one threshold, one effect — can be reasoned about completely.
Layer two: a permanent stop
The second layer works at the scale of the system's whole life. If account equity falls 18% below its historical peak, the EA stops trading permanently. It does not restart on its own, and there is no mode that trades harder to climb back.
A full automatic stop sounds drastic, so the reasoning deserves a careful statement. A system 18% below its peak is telling you one of two things: either the market has changed in a way the strategy does not handle, or the edge was weaker than the research suggested. Both are serious hypotheses about the system itself, and neither can be evaluated by the system itself. That judgment belongs to a human with capital still in hand, and the stop's job is to make sure the human gets the chance.
"No automatic restart" has a practical meaning for whoever runs the system. If the stop ever fires, the decision to start again is made by you, after a review — not by a timer, and not by a hidden reset. A sensible review asks whether the conditions that produced the drawdown were inside or outside what the historical test contained, and whether live behavior matched tested behavior up to that point. Sometimes the honest answer is to retire the system. An automatic restart quietly removes that conversation, and with it most of the value of having stopped.
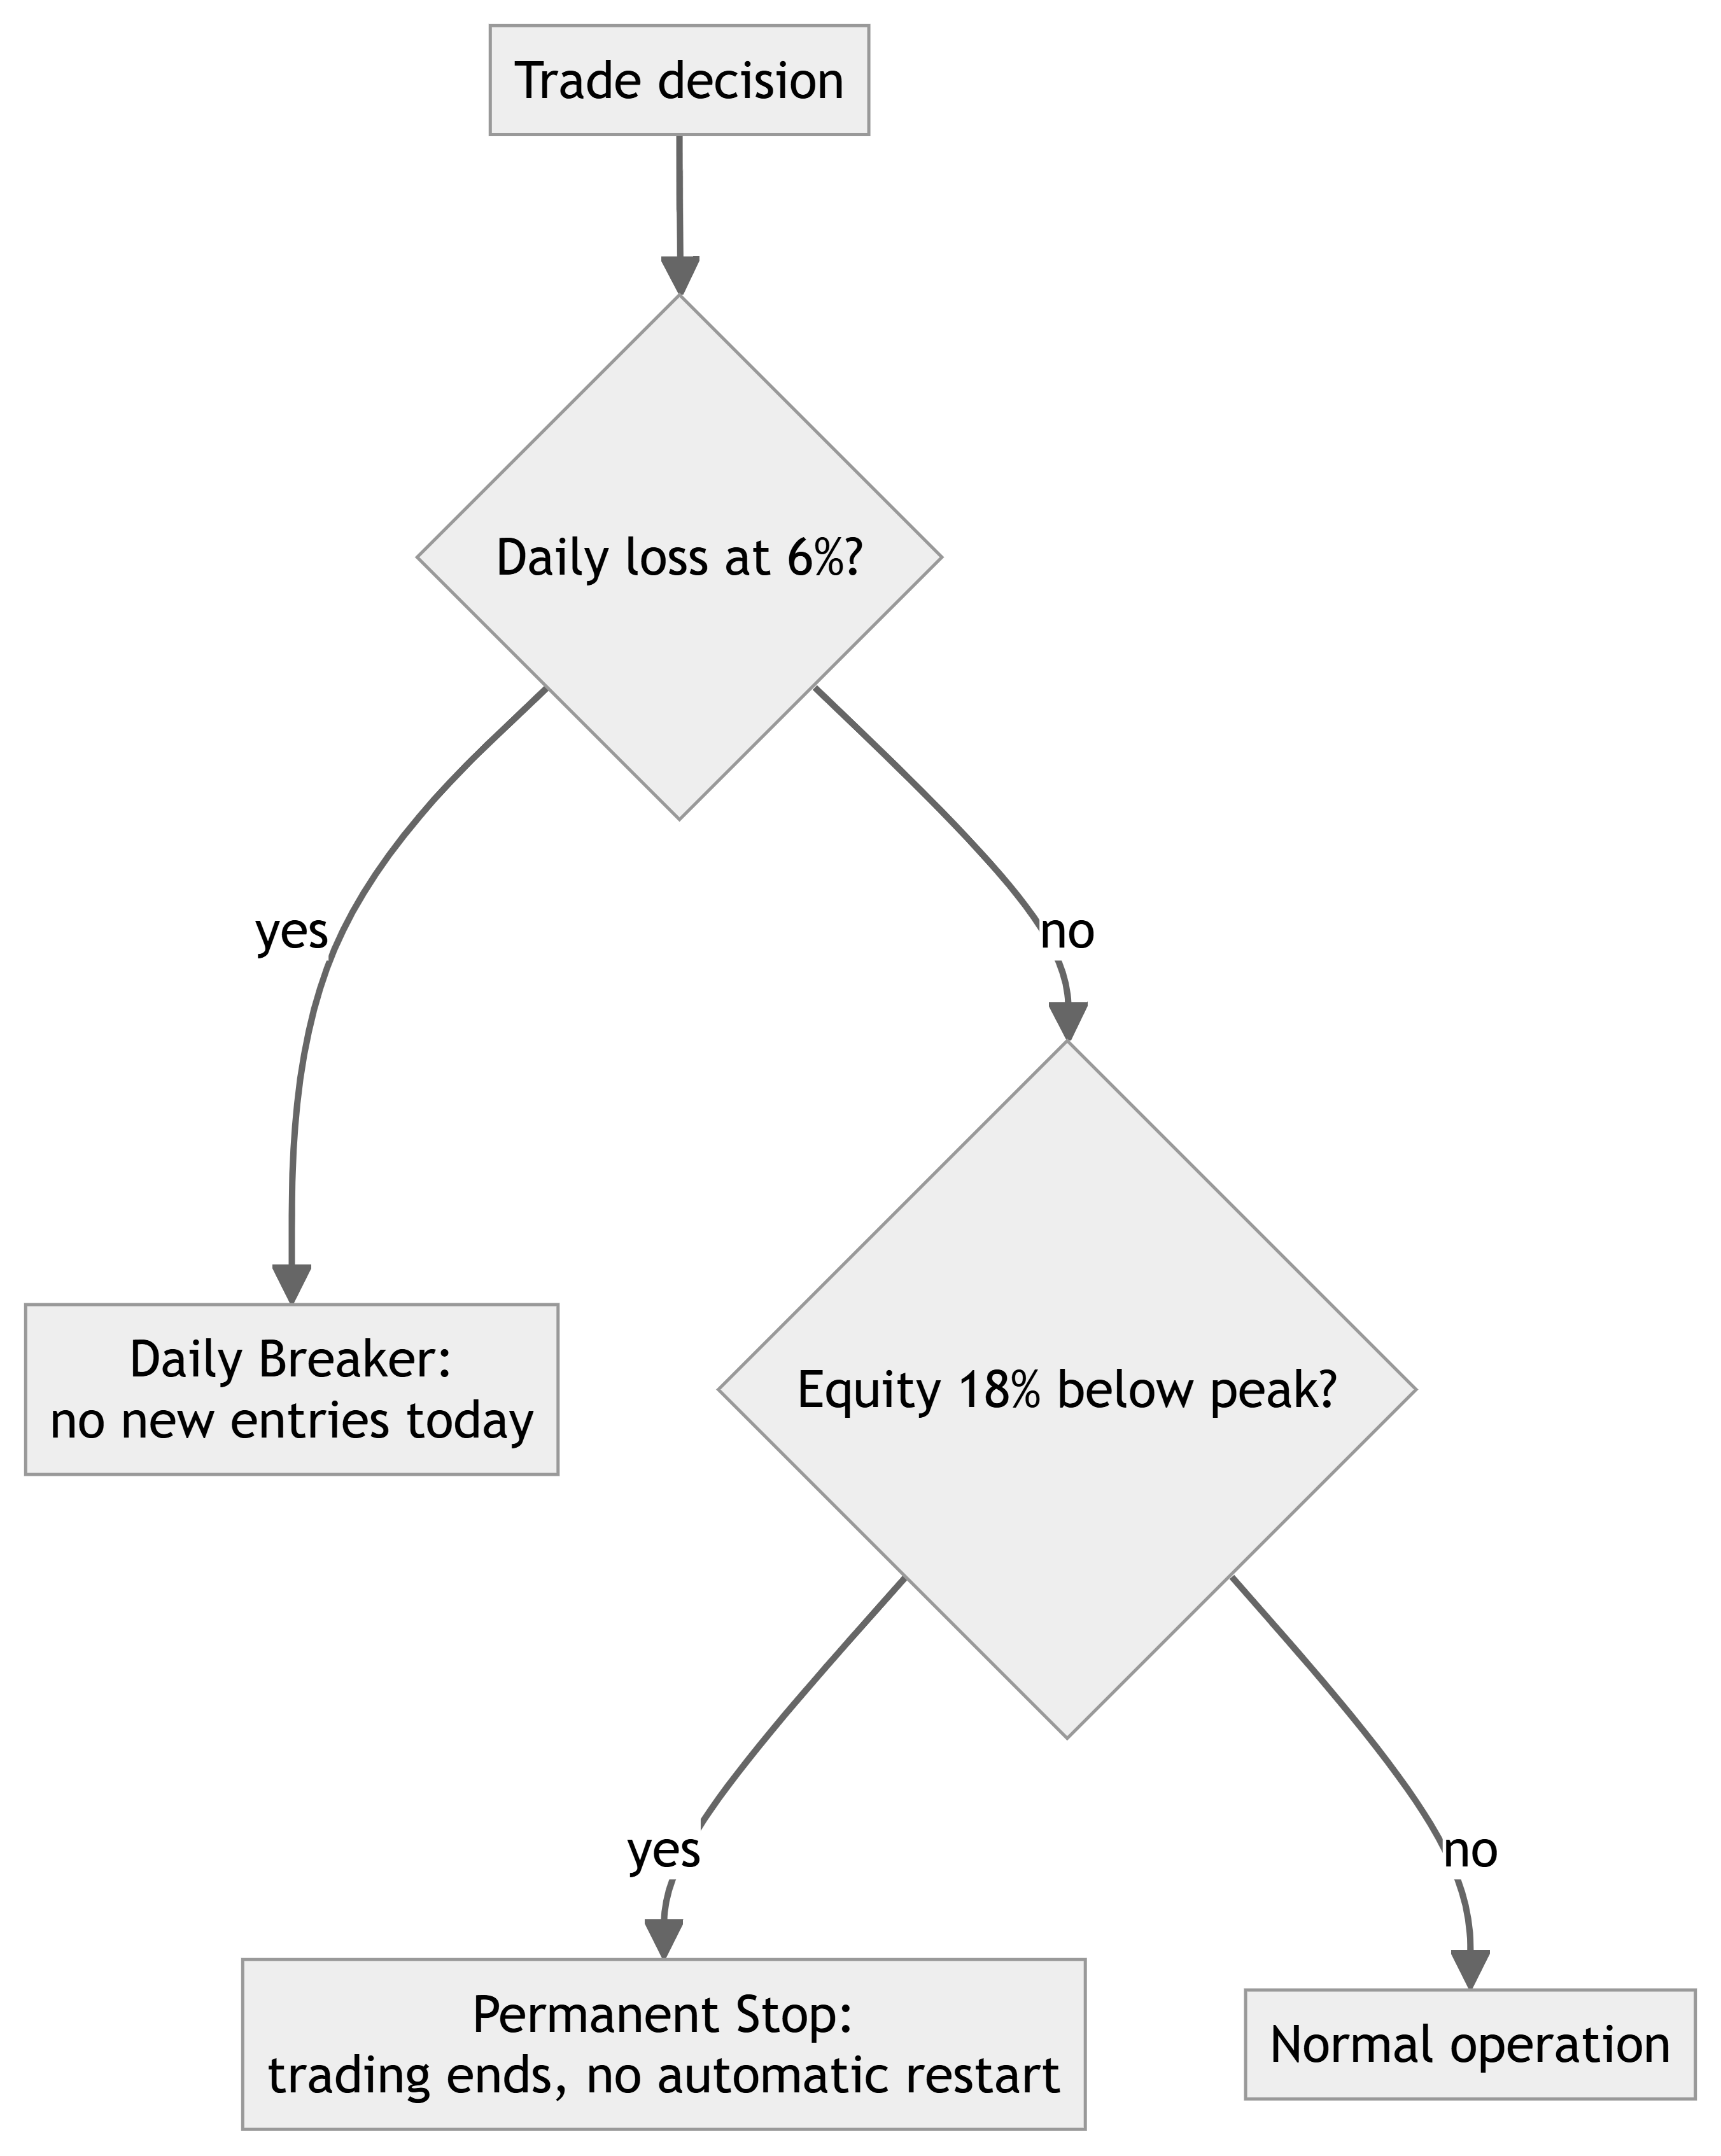
Choosing the thresholds involves a real trade-off. Set a stop too tight and it will halt a healthy strategy on ordinary statistical noise — every strategy has losing streaks, and a limit inside the range of normal variation turns a safety device into a random kill switch. Set it too loose and it protects nothing. The threshold has to sit outside the drawdown range the long-term test actually produced, yet well inside the territory where recovery arithmetic becomes brutal. In our backtest, the recommended configuration reached a maximum drawdown of 5.2% over 19 years; the permanent stop sits at 18%, more than three times deeper. Reaching it would mean the live system is behaving in a way two decades of historical data never did.
The feature we deliberately left out
Everything described so far removes risk after losses. The most common request goes the other way: after a loss, trade bigger and win it back.
Rather than dismissing the idea on principle, we tested it — 14 variants of loss-recovery sizing across the martingale, averaging-down and grid families, on 12 years of tick data. None survived. The classic double-after-loss version was the instructive one. On paper it multiplied total profit by four, which is exactly why these systems keep getting rebuilt. On the historical path, it reached −18% of equity within the first year and needed a maximum lot 32 times the base size to do it. The added profit was not a better edge; it was the same edge held with more borrowed nerve, and the first sustained losing streak collected the bill.
That is why our system contains no mechanism of any kind that increases lot size after a loss, and why the permanent stop has no recovery mode attached. In testing, recovery-seeking mechanisms did one thing reliably: they raised the probability of ruin.
What getting it wrong costs: one published row
Our EA exposes a single risk input with three settings. The published figures for each, from the same 19-year backtest (2007–2026, real tick data, trading costs included), look like this. The right-hand column is estimated from 20,000 Monte Carlo simulations that shuffle the order of trades; the rest are backtest measurements.
| Risk setting | Average annual return (19-year CAGR) | Maximum drawdown | Probability of reaching the 18% permanent stop |
|---|---|---|---|
| Default (recommended) | 12.7% | 5.2% | 1.35% |
| Medium | 16.0% | 6.4% | 7.75% |
| High | 2.7% | 19.0% | 17.9% |
Read the last row slowly. Intuition says more risk buys more return, and moving from Default to Medium looks like exactly that trade: higher CAGR, deeper drawdown, a stop probability that is no longer negligible. The High setting breaks the pattern completely. The most aggressive configuration produced the worst long-term return of the three — 2.7% per year.
The mechanism is not subtle. On the historical path, the high-risk configuration hit the 18% permanent stop during the 2010 yen surge. The system did what it was designed to do and stopped, and from that point on its compounding was over. The years of growth that the calmer settings went on to earn simply never happened for it. Past a threshold, risk did not scale the return curve up; it converted future returns into a ruin event.
We publish that row on the product page, unflattering as it is, because no other number we have makes the point as clearly. Position sizing is not a dial that trades comfort for profit. Beyond a certain point it trades profit for termination.
How to read risk claims when evaluating an EA
If you take one habit from this article, make it this: when you evaluate a trading system, read the risk section first, and treat the marketing numbers as uninterpretable until a few questions have answers.
Ask what the maximum drawdown actually is — measured on balance or on equity, over how many years, on what quality of data. A drawdown figure from a three-year test tells you very little.
It also helps to distinguish drawdown as a measurement from drawdown as a design constraint. In most published EAs, maximum drawdown is simply what happened to happen on one historical path; run the same strategy through a slightly different decade and the number moves. When a system carries a hard stop, the figure gains a second, firmer meaning — a level beyond which losses cannot compound, whatever the future path looks like. Both numbers are useful, and confusing one for the other is how buyers end up surprised.
Ask whether the figures are backtest or live results. Both are legitimate, but they are different claims, and an honest vendor labels them. Ask what happens after losses: does lot size stay constant, or does some recovery logic grow it? Ask whether there is any condition under which the system stops itself, and whether that stop is permanent or quietly restarts.
Finally, ask whether the vendor ever shows a losing period. Every real system has them; losing stretches inside a positive long-term record are normal statistics, not scandal. A track record with no visible losing period anywhere has usually been edited — and the editing is the finding.
Conclusion
The order of operations is the whole message. Fix the maximum drawdown you can genuinely tolerate before you look at a single return figure. Settle what the system may do after losses — and if the answer includes "trade bigger," test that assumption on long historical data before trusting it with money. Know the conditions under which the machine must hand control back to you. Returns only become meaningful once those three answers exist.
Origin-U Project is an independent quantitative foreign exchange research project based in Japan. The concepts discussed in this article are implemented in Bushido, a commercial USDJPY portfolio EA developed by Origin-U Project.
All performance figures in this article are backtest or Monte Carlo simulation results based on historical data. Past results do not guarantee future performance.
Origin-U Research Notes — Part 3 of 10
← Previous: Why Diversification Matters in Algorithmic Trading | Next: Why We Chose Not to Use Martingale or Grid Systems →
日本語版: 利益よりも先にリスク管理 — トレーディングシステムは「負ける側」から設計する
Full series
- Building a Multi-Strategy Portfolio EA for USDJPY: What 86 Tested Hypotheses Taught Us
- Why Diversification Matters in Algorithmic Trading
- Risk Management Before Profit: Designing the Loss Side of a Trading System First
- Why We Chose Not to Use Martingale or Grid Systems
- Using Monte Carlo Simulation to Evaluate Trading Systems
- What Makes a Robust Forex Strategy: Judging the Process, Not the Chart
- The Difference Between Backtesting and Forward Testing
- How We Evaluate Trading Ideas Before Implementation
- Designing Low Drawdown Trading Systems: Drawdown as an Input, Not an Outcome
- Lessons Learned from Long-Term USDJPY Research: What 20 Years of Tick Data Taught Us




