Building a Multi-Strategy Portfolio EA for USDJPY: What 86 Tested Hypotheses Taught Us

Introduction
Most Expert Advisors start life the same way. Someone notices a promising setup, turns it into code, optimizes the parameters until the equity curve looks clean, and considers the work done. The weakness of this approach usually stays hidden during development, because the backtest itself still looks convincing. It tends to appear later, when the market stops behaving like the sample the system was tuned on.
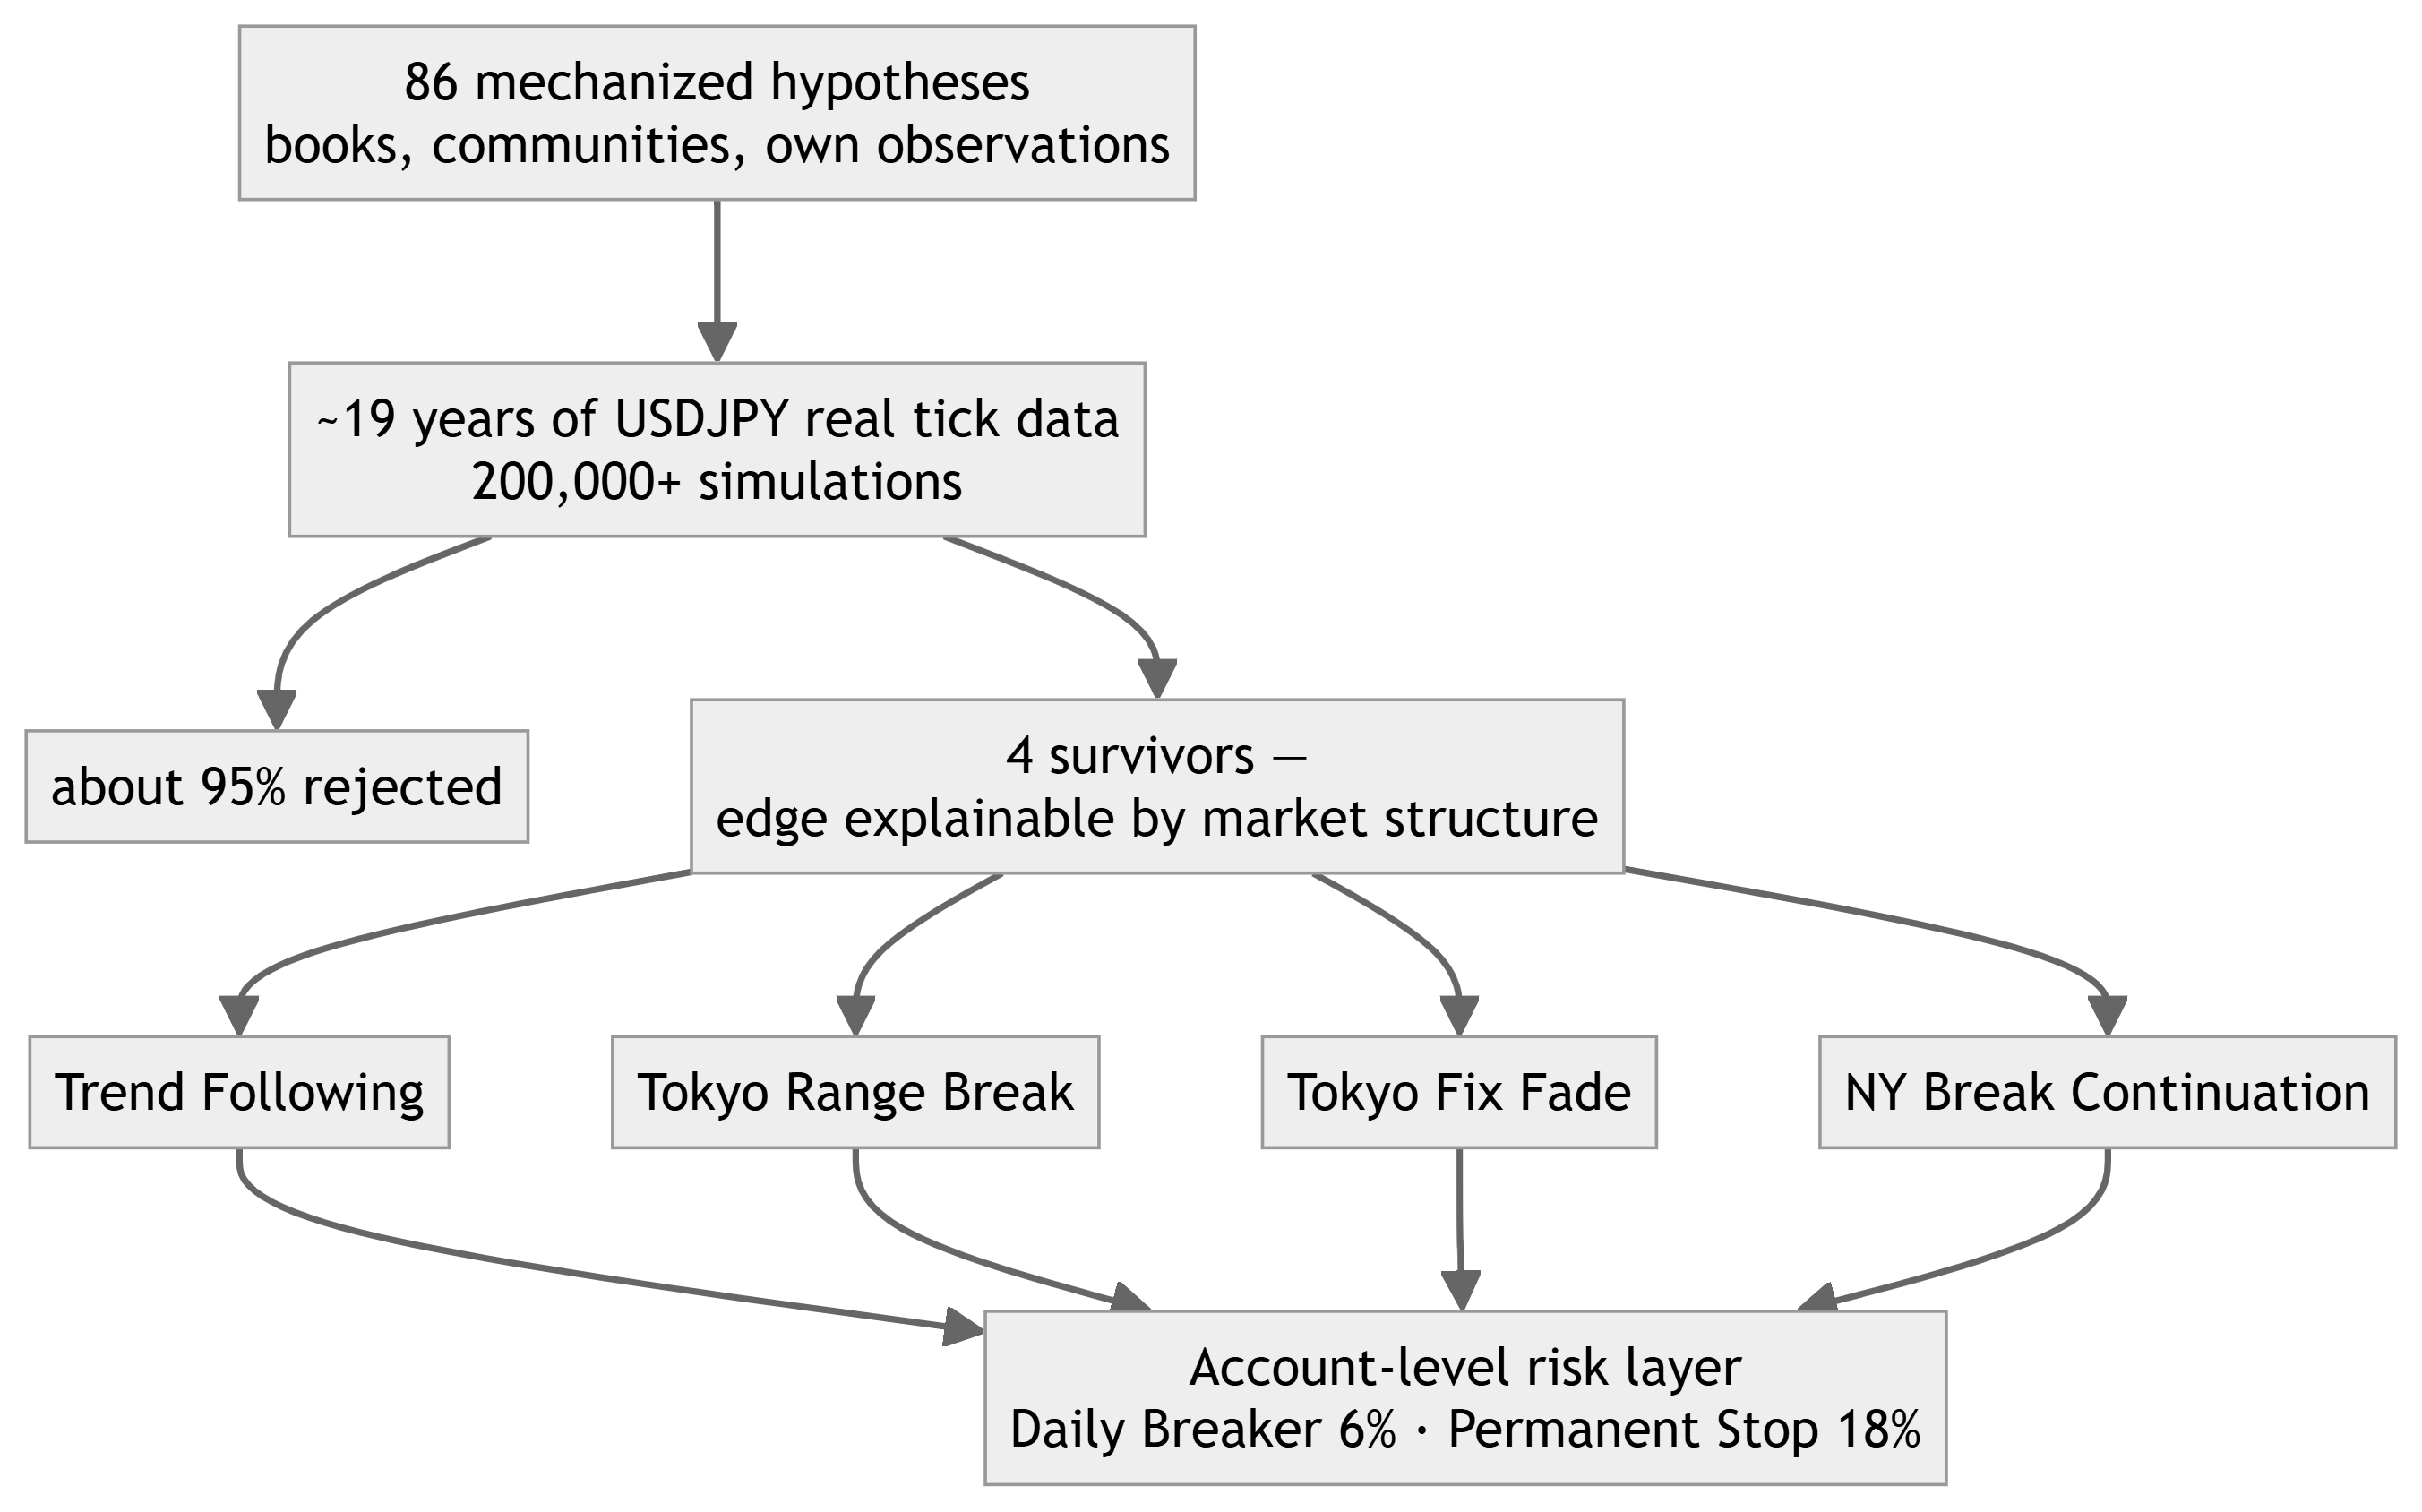
Our research project approached USDJPY from a different starting question. Instead of asking which single trading logic is best, we asked which combination of independent reasons to trade could survive roughly two decades of tick data. The answer turned out to be a portfolio EA built from four strategies, plus a rejection pile containing about 95% of everything we tested.
This article explains why we gave up on finding one winning logic, how the testing worked, why the finished system deliberately skips certain trading days, and what running several strategies inside one EA costs in engineering terms. Entry rules and parameters stay private, but the process itself applies to any instrument, not only USDJPY.
The problem with one perfect logic
A single-logic EA is an implicit bet that one market condition will keep repeating.
Consider a simple trend-following rule — an illustrative example, not a description of our system. In a directional market it accumulates profit. When price enters a long range, the same rule buys tops, sells bottoms, and hands the profit back. Nothing about the logic broke; the market simply stopped presenting the condition the logic needs.
Optimization makes this failure mode harder to see, not easier. If the historical sample happens to favor the regime your logic prefers, the optimizer will tune the system ever more tightly to that dominant condition, and the result tests well while aging badly.
USDJPY adds a second layer: session structure. The Tokyo session has flow patterns of its own, including the daily Tokyo fix. New York trades on different participants, different news, and different liquidity. A rule built around Tokyo-morning behavior has no particular reason to keep working twelve hours later. During long-term testing we learned to treat "when does this edge exist?" as seriously as "does this edge exist?" — the two questions often had different answers.
Testing 86 ideas against 19 years of ticks
Our test window covers 2007 through 2026 — 19 full calendar years of USDJPY real tick data, imported into MetaTrader 5 as a custom symbol and run with real-tick modeling, with a total trading cost of about 0.7 pips built into every simulation. Against that data we tested 86 separate hypotheses: trading methods collected from books, trader communities, and our own observations, each translated into fixed mechanical rules before testing.
The translation step matters more than it sounds. A method described in a book usually leaves room for judgment — where exactly the level sits, which touches count, when a setup is "clean enough". Mechanizing removes every one of those escape hatches. The method becomes falsifiable, and most methods do not enjoy becoming falsifiable.
Across more than 200,000 simulations, about 95% of the hypotheses failed our criteria and were rejected. The survivors then had to clear one more bar, and it was the strictest: we had to be able to explain the edge in terms of market structure. A hypothesis that made money in testing but could not answer "why does this win?" was not adopted, because profit without an explanation is indistinguishable from curve fitting — and curve fitting is the default outcome of any search across many candidates.
Four hypotheses survived.
Four different reasons to trade
At the concept level, the final portfolio combines:
- Trend Following — participation in sustained directional movement
- Tokyo Range Break — range formation during the Tokyo session and its breakdown
- Tokyo Fix Fade — the reversal of flow imbalances that build up around the Tokyo fix
- NY Break Continuation — follow-through after breakouts in the New York session
The specific rules are proprietary, so I will not describe them here. The main idea is clear without them: each strategy answers "why should this win?" with a different piece of market behavior. One lives on persistence, one on the collapse of a balanced range, one on a scheduled flow event, one on session momentum.
That difference is the whole argument for a portfolio. When the reasons to win differ, the conditions that cause losses tend to differ as well. A ranging month that starves the trend module does not remove the Tokyo fix from the calendar. Diversification here is not about trading more instruments — it is about holding several independent explanations of the market at the same time.
Days when the EA does nothing
The clearest example of this way of thinking is the trading calendar. On Japanese public holidays there is no Tokyo fix flow, so the Fix Fade strategy stands down automatically. The EA simply has days when a module rests, because the thing it trades does not exist that day.
Trading every day is not a goal. A strategy's job is to be present when its market condition appears and absent when it does not; frequency is a byproduct.
This suggests a useful check for any strategy you operate. Can you name the market condition that must be present before it trades? If the honest answer is "it trades whenever the indicator crosses," the strategy has a trigger, but not yet a reason.
What multi-strategy design costs
Combining four strategies in one EA sounds like four times the edge. In practice it is closer to four times the responsibility, and the costs show up in specific places.
Risk must be owned at the account level. Four modules with four private risk budgets will eventually draw down together, and no single module can see that happening. In our design, strategies generate and manage trades while account-level protections sit above all of them: a daily breaker that halts new entries after a 6% daily loss, and a permanent stop that shuts the system down if equity falls 18% from its peak — with no automatic restart and no recovery mode. Testing convinced us that recovery mechanisms which raise position size after losses only increase the probability of ruin, so the system is allowed to stop, and stopping is final.
Attribution matters more than it does in a single-strategy EA. When the account has a bad week, "the EA lost" is not an actionable statement. You need to know which module traded, why, and what it contributed — which means per-module logging has to be designed in from the first day of testing rather than bolted on after the first problem.
And complexity grows faster than module count. Every additional strategy multiplies code paths, interaction cases, and the amount of retesting needed after any change. The evidence bar for adding a fifth module therefore has to be exactly as high as the bar the first four cleared. In a portfolio, complexity is a price you pay for independence between return sources, never a feature in itself.
What the backtest produced
All figures below are backtest results on the data described above — historical measurements, not a forecast.
Over the 2007–2026 window, every one of the 19 full calendar years closed positive. The average annual return was 12.7% (19-year CAGR at the default risk setting), with a maximum drawdown of 5.2% on a balance basis. Whether 12.7% sounds high or low depends on your reference point. What mattered to us was the pairing: a double-digit average return produced while the deepest drawdown stayed near 5%. That pairing, not the raw return, is what a portfolio of independent edges is supposed to buy.

One caution belongs next to those numbers. A portfolio reduces how often the failure conditions of its parts line up; it does not abolish losing periods, and no research process can. Historical backtest results, however long the window, should not be treated as a forecast.
A quick test for your own portfolio
Before adding a second strategy to your EA, write one sentence: "This strategy wins because ___." Then write the same sentence for the strategy you already run.
If the two sentences say the same thing, you do not have two strategies. You have one strategy with two parameter sets, and your risk is more concentrated than your code structure suggests. The test costs nothing, and in our experience it filters candidates more honestly than another month of optimization.
Closing notes
Origin-U Project is an independent quantitative foreign exchange research project based in Japan. The concepts discussed in this article are implemented in Bushido, a commercial USDJPY portfolio EA developed by Origin-U Project.
All performance figures referenced in this article are backtest measurements and do not guarantee future results.
Origin-U Research Notes — Part 1 of 10
Next: Why Diversification Matters in Algorithmic Trading →
日本語版: USDJPY向けマルチストラテジー・ポートフォリオEAの作り方 — 86本の仮説検証が教えてくれたこと
Full series
- Building a Multi-Strategy Portfolio EA for USDJPY: What 86 Tested Hypotheses Taught Us
- Why Diversification Matters in Algorithmic Trading
- Risk Management Before Profit: Designing the Loss Side of a Trading System First
- Why We Chose Not to Use Martingale or Grid Systems
- Using Monte Carlo Simulation to Evaluate Trading Systems
- What Makes a Robust Forex Strategy: Judging the Process, Not the Chart
- The Difference Between Backtesting and Forward Testing
- How We Evaluate Trading Ideas Before Implementation
- Designing Low Drawdown Trading Systems: Drawdown as an Input, Not an Outcome
- Lessons Learned from Long-Term USDJPY Research: What 20 Years of Tick Data Taught Us




