
Sooner or later, everyone who runs an Expert Advisor asks the same question. The Strategy Tester shows one set of numbers, and the live account — or even a demo — shows another. Same program, same settings, same symbol. Why are the results different?
The short answer is that a backtest and a live account are not running in the same world. The EA is identical, but everything around it — the prices, the costs, the clock — can differ in ways that are easy to miss. Once you know where those differences come from, the gap stops being mysterious and becomes something you can measure and reduce.
This article walks through the four gap sources we document for our own users, then looks at what forward testing adds, what it cannot tell you, and how to compare the two fairly.
What a backtest really is
A backtest is a replay. The Strategy Tester takes stored price history, feeds it to your EA one tick at a time, and simulates what the broker would have done with each order. The output looks precise — a balance curve, a profit factor, a trade list with exact prices — and that precision is exactly what makes backtests easy to over-trust.
Every number in the report depends on three inputs: the stored prices, the simulated fills, and the assumed costs. Change any of them and the report changes, sometimes a little, sometimes completely. None of this makes backtesting useless. A multi-year simulation is still the only way to see how a strategy handles market conditions that no forward test will reproduce on demand. It does mean, however, that the report is only as honest as the data behind it.
In practice, when a backtest of the same EA looks worse than a published one, the cause is rarely the EA itself. It is usually one of the four gaps below. We consider them likely enough that we document all four for our own users in advance.
Gap one: how deep is your price history?
The history that comes with a standard broker installation usually contains only a few years of real tick data. Before that point, the tester still produces bars and fills, but they are built from increasingly coarse data, and the report will not stop to warn you where the good data ends.
That has a subtle consequence. If real ticks cover, say, the last three years, then a "20-year backtest" on that feed is really a three-year backtest with a 17-year approximation attached. Long-term statistics — worst drawdown, losing streaks, behavior in old crisis periods — quietly lose their meaning.
This is the first thing to control. Our own published tests use roughly 20 years of USDJPY tick data imported into MetaTrader 5 as a custom symbol, precisely because the default history could not support conclusions about long-term behavior. Whatever data source you choose, find out where your real ticks begin. That single fact decides how much of your report you can take seriously.
Gap two: where do the ticks come from?
Even inside the covered period, not all ticks are equal. When real tick data is missing, the tester generates artificial ticks from one-minute bars. The generated sequence visits plausible prices, but it is not the sequence the market actually traded.
For a strategy that holds positions for days, this matters less. For anything that reacts to intrabar movement — breakouts, tight stops, short-term exits — the difference between real and generated ticks shows up directly in the fills. An order that was touched by a real spike may never trigger on generated data, and the other way around.
The tester reports a "history quality" percentage, and it deserves more attention than it usually gets. Our published tests run in "every tick based on real ticks" mode with 98% history quality, and we state that number openly because fills are only as trustworthy as the ticks that produced them. If your own test shows a much lower quality figure, the trade list is telling you a story about interpolation, not about the market.
Gap three: what does a trade cost in your simulation?
Costs are the least glamorous input and one of the most common reasons a live account underperforms a simulation. A backtest run at raw spread with no commission is a best-case scenario. Real accounts pay the spread that existed at the moment of the trade, plus commission, plus occasional slippage.
The fix is not complicated: build a realistic total cost into the test and say what it is. In our published USDJPY results we assume about 0.7 pips of total trading cost, spread plus commission. The exact number for your broker will differ. What matters is that the assumption exists, is stated, and roughly matches the account you actually intend to trade.
One habit worth keeping: when you compare two backtests, compare their cost assumptions before you compare their profits. A strategy that survives honest costs is rarer, and more interesting, than one that wins by a spread it will never receive.
Gap four: the timezone trap
This one catches experienced users too. Any EA whose logic depends on sessions — the Tokyo morning, the London open, the New York close — interprets time through the broker's server clock. Price history carries its own timezone, and different data sources stamp their bars differently.
If the EA expects one server timezone and the data uses another, every session window shifts. The logic still runs, orders still fire, and the report looks normal. Nothing crashes. The strategy is simply trading the wrong hours for the entire length of the test.
There is a second layer to this trap. An EA can read the broker's clock in live trading and warn when the timezone does not match its assumptions — ours does exactly that. In the Strategy Tester, no such warning appears, because the tester itself sets the clock. We point this out explicitly in our documentation: the check protects the live account, and the backtest remains your own responsibility.
A quick sanity check requires no tools at all. Open the daily chart of the data you are testing on. A New-York-close style feed shows five daily bars per week. Six bars, or a Monday bar that opens at an odd hour, means the timezone is not what a session-based EA expects.
Where the gaps enter the pipeline
The diagram below shows the two paths side by side. Each gap source sits at a specific point — which is good news, because it means each one can be checked on its own.
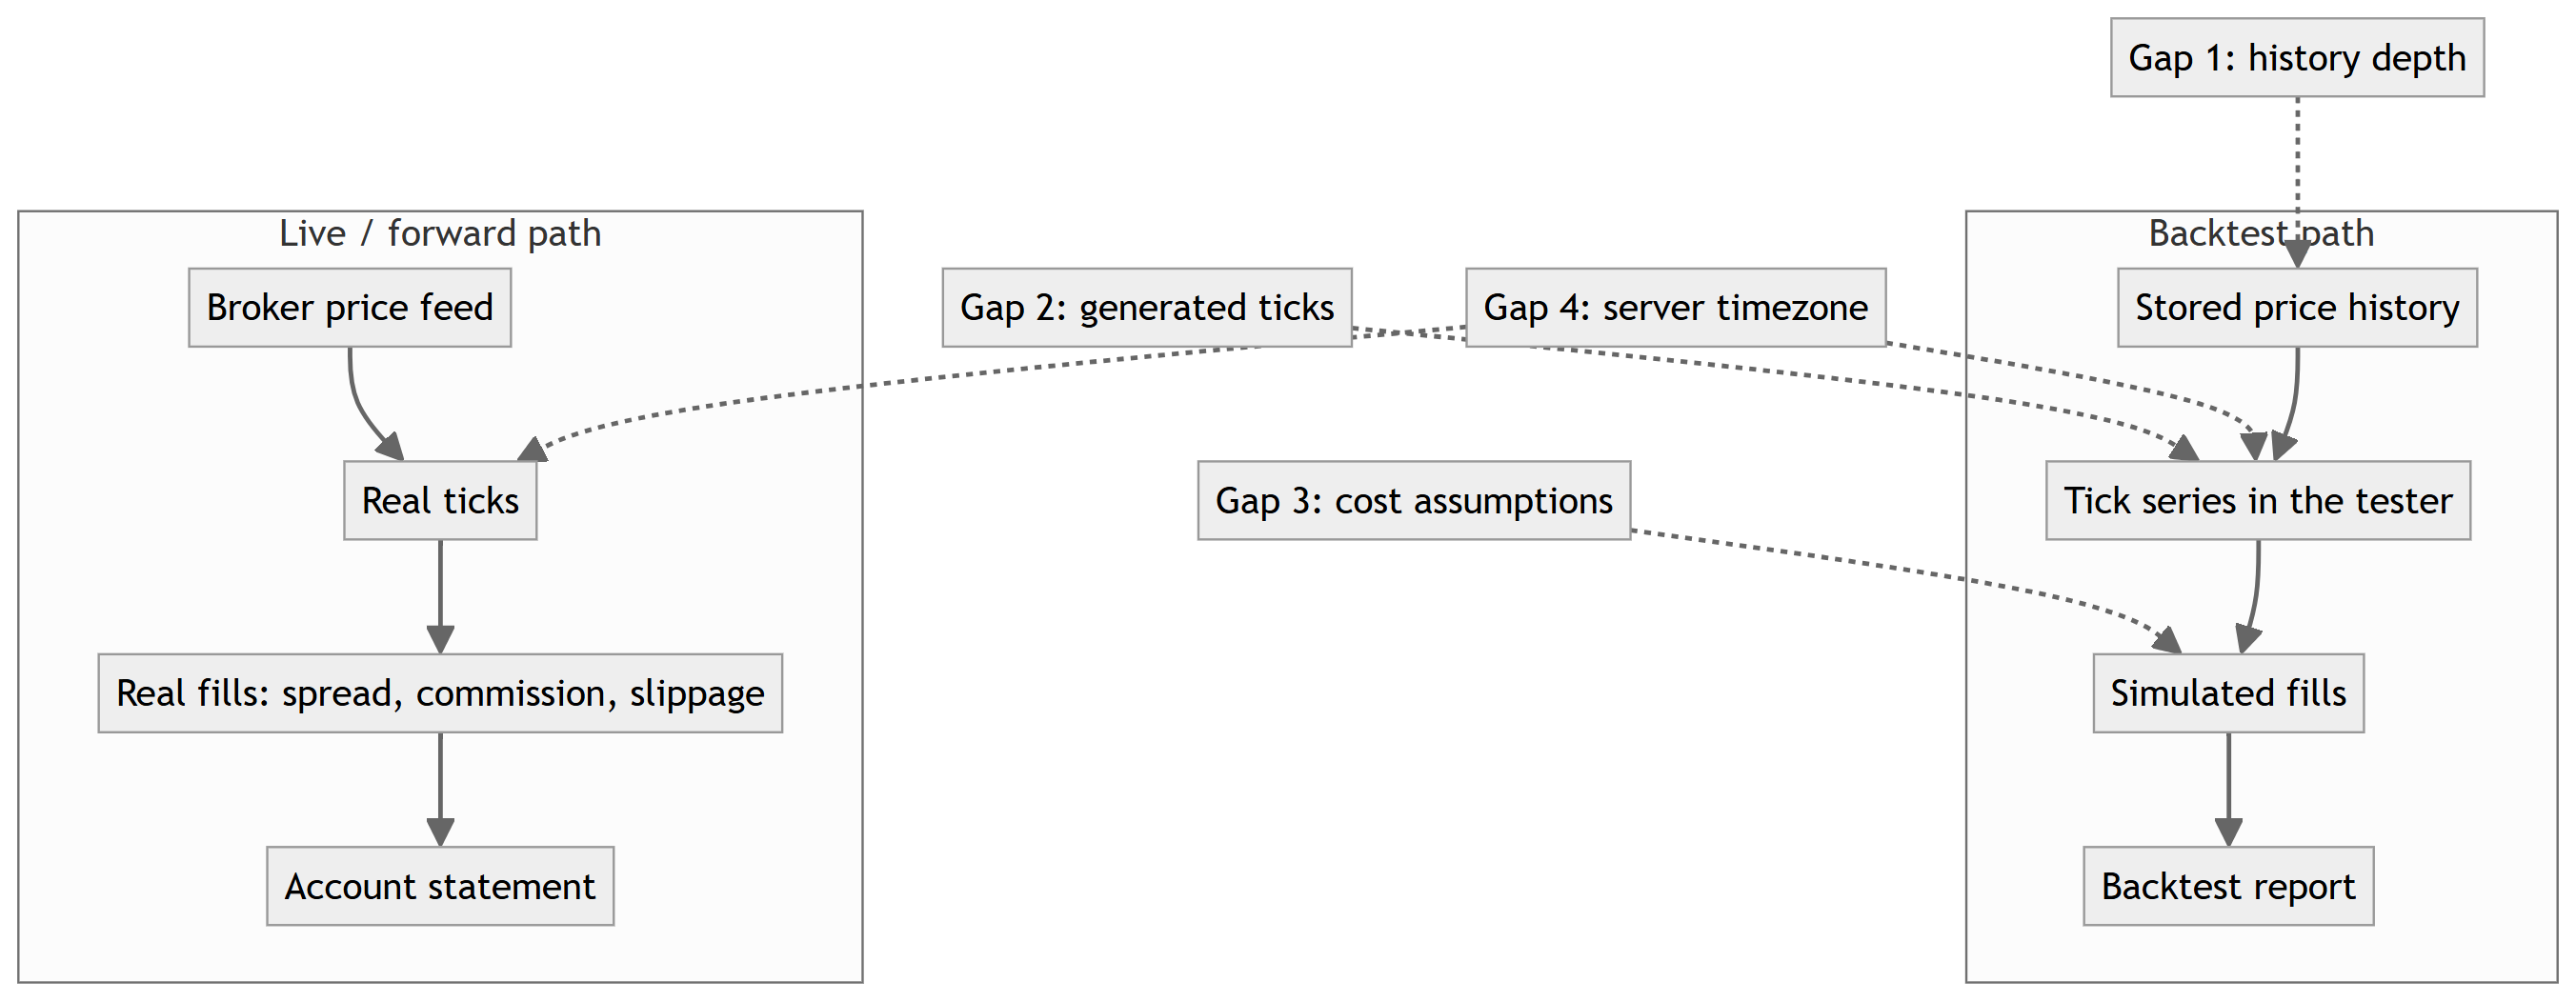
Read the report on the left with the right-hand path in mind. Every arrow on the right that has no equivalent on the left is a place where live results can drift away from the simulation.
What forward testing actually measures
Forward testing — running the EA on a demo or small live account in real time — is often described as the "real" test. That is only half true. What a forward test genuinely measures is execution: the part of trading that no simulation can fully reproduce.
Execution quality is concrete and measurable. When we moved our own system to forward testing, we logged each market order and compared the requested price with the filled price. Across the first 8 market orders, the worst slippage against us was 0.1 pips, and the average fill was actually on the favorable side. Eight orders is a small sample — we say that plainly, and we would not build any statistical claim on it. But even a small sample answers a question the tester cannot: does this broker, at this time of day, fill this strategy near the prices it expects?
The time-of-day detail matters more than it may seem. Those measurements come from the Tokyo session, where USDJPY liquidity is deep and spreads are stable. A strategy that trades quiet hours inherits good execution as a side effect, and a strategy that trades news spikes inherits the opposite. Forward testing is how you find out which side you are on.
A forward test also catches the unglamorous failures a simulation never shows: rejected orders, requotes, connection drops, a VPS restart at the wrong moment. None of these appear in a tester report, and any of them can dominate a live month.
What forward testing cannot tell you
Here is the uncomfortable symmetry: the forward test fixes the backtest's weaknesses and inherits none of its strengths.
A backtest covering two decades contains financial crises, interest-rate cycles, panic moves, and long boring ranges. A forward test covers exactly the weeks you have been running it. If those weeks are calm, you learn nothing about storms. And if the strategy trades a few times per week, months can pass before the trade count supports any conclusion at all.
This is why "the forward test is profitable" and "the forward test is short" are usually both true, and why neither settles the question alone. In our own material we describe the current stage of our system as what it is: two decades of simulation, execution measurements from live conditions, and a live track record that is still being built. Pretending a few weeks of forward results outweigh 19 years of simulated history would be as misleading as the reverse.
The two tests answer different questions. The backtest asks: did this logic have an edge across many years of market conditions? The forward test asks: does the real world execute this logic the way the simulation assumed? A strategy needs a yes to both.
Comparing the two fairly
If you want to validate an EA — your own, or one you are evaluating — the comparison only means something when the environments match. In practice that comes down to a short routine.
Start with the data: find out how many years of real ticks your test actually contains, and check the tester's history quality figure after the run. Then match the costs — a spread and commission that resemble the account you intend to use, not the best number you have ever seen. Check the clock next: five daily bars per week on the chart, and session times landing where the EA's documentation says they should. Only then run the forward comparison, and compare behavior rather than profit. The question in the first weeks is not "did it make money?" but "are the entries, exits, and fill prices close to what the simulation predicted for the same days?"
When a trade-by-trade comparison lines up, the remaining difference is usually execution, and you can measure it directly, the same way we did with our slippage log. When it does not line up, one of the four gaps is almost always the reason — and now you know where to look.
Closing thoughts
A backtest and a forward test are not competing verdicts. One sees years of market conditions through imperfect data; the other sees real execution through a short window of time. The four gaps — history depth, tick quality, costs, and the server clock — explain most of the difference between a tester report and an account statement, and each of them can be checked on its own before you trust a number.
Origin-U Project is an independent quantitative foreign exchange research project based in Japan. The concepts discussed in this article are implemented in Bushido, a commercial USDJPY portfolio EA developed by Origin-U Project — including the live timezone check and the execution measurements described above.
Origin-U Research Notes — Part 7 of 10
← Previous: What Makes a Robust Forex Strategy: Judging the Process, Not the Chart | Next: How We Evaluate Trading Ideas Before Implementation →
日本語版: バックテストとフォワードテストの違い — 同じEAで数字が変わる4つの理由
Full series
- Building a Multi-Strategy Portfolio EA for USDJPY: What 86 Tested Hypotheses Taught Us
- Why Diversification Matters in Algorithmic Trading
- Risk Management Before Profit: Designing the Loss Side of a Trading System First
- Why We Chose Not to Use Martingale or Grid Systems
- Using Monte Carlo Simulation to Evaluate Trading Systems
- What Makes a Robust Forex Strategy: Judging the Process, Not the Chart
- The Difference Between Backtesting and Forward Testing
- How We Evaluate Trading Ideas Before Implementation
- Designing Low Drawdown Trading Systems: Drawdown as an Input, Not an Outcome
- Lessons Learned from Long-Term USDJPY Research: What 20 Years of Tick Data Taught Us




