
Over the course of our USDJPY research we tested 86 trading hypotheses against roughly 20 years of tick data. About 95 percent of them were rejected. Four eventually reached a production system.
A rejection rate like that is sometimes read as a confession. We read it the other way around: the rejection rate is what the pipeline is for. An evaluation process that approves most of what enters it is not really evaluating anything.
This article describes what happens before any idea becomes code we would trust with real orders. None of it requires special infrastructure. Most of it is discipline — written down early enough that it cannot be negotiated with later.
Ideas arrive in language, not in rules
Trading books and community posts describe methods in words that feel precise until you try to compute them. "Enter when the trend is clearly established." Established on which timeframe? Measured how? Since when?
Consider a hypothetical but typical case: a breakout method that tells you to enter "after a period of consolidation". To test that statement, consolidation needs a machine-checkable definition — a range width, a duration, a reference window. The moment you pick those values, you discover the method was never one idea. It was a family of hundreds of variants, and the author had been choosing among them by eye, trade by trade.
Mechanical translation forces this into the open. Every condition must be computable from data that existed at that moment, with no human in the loop. Two things tend to happen. Some ideas turn out to be untranslatable: whatever worked, if anything did, lived in the author's discretion and dies when the discretion is removed. Others translate cleanly, run on twenty years of ticks, and show nothing.
Both outcomes are useful. When we mechanized our 86 hypotheses — drawn from books, community lore, and our own observations — most of them, including several famous published methods, could not demonstrate a measurable edge once tested this way. That changed how we read trading literature. The question is never "does this sound reasonable?" It is "what exactly would this be, as a rule, and does that rule survive data it has not seen?"
The rest of the pipeline exists to keep that question honest. In outline:
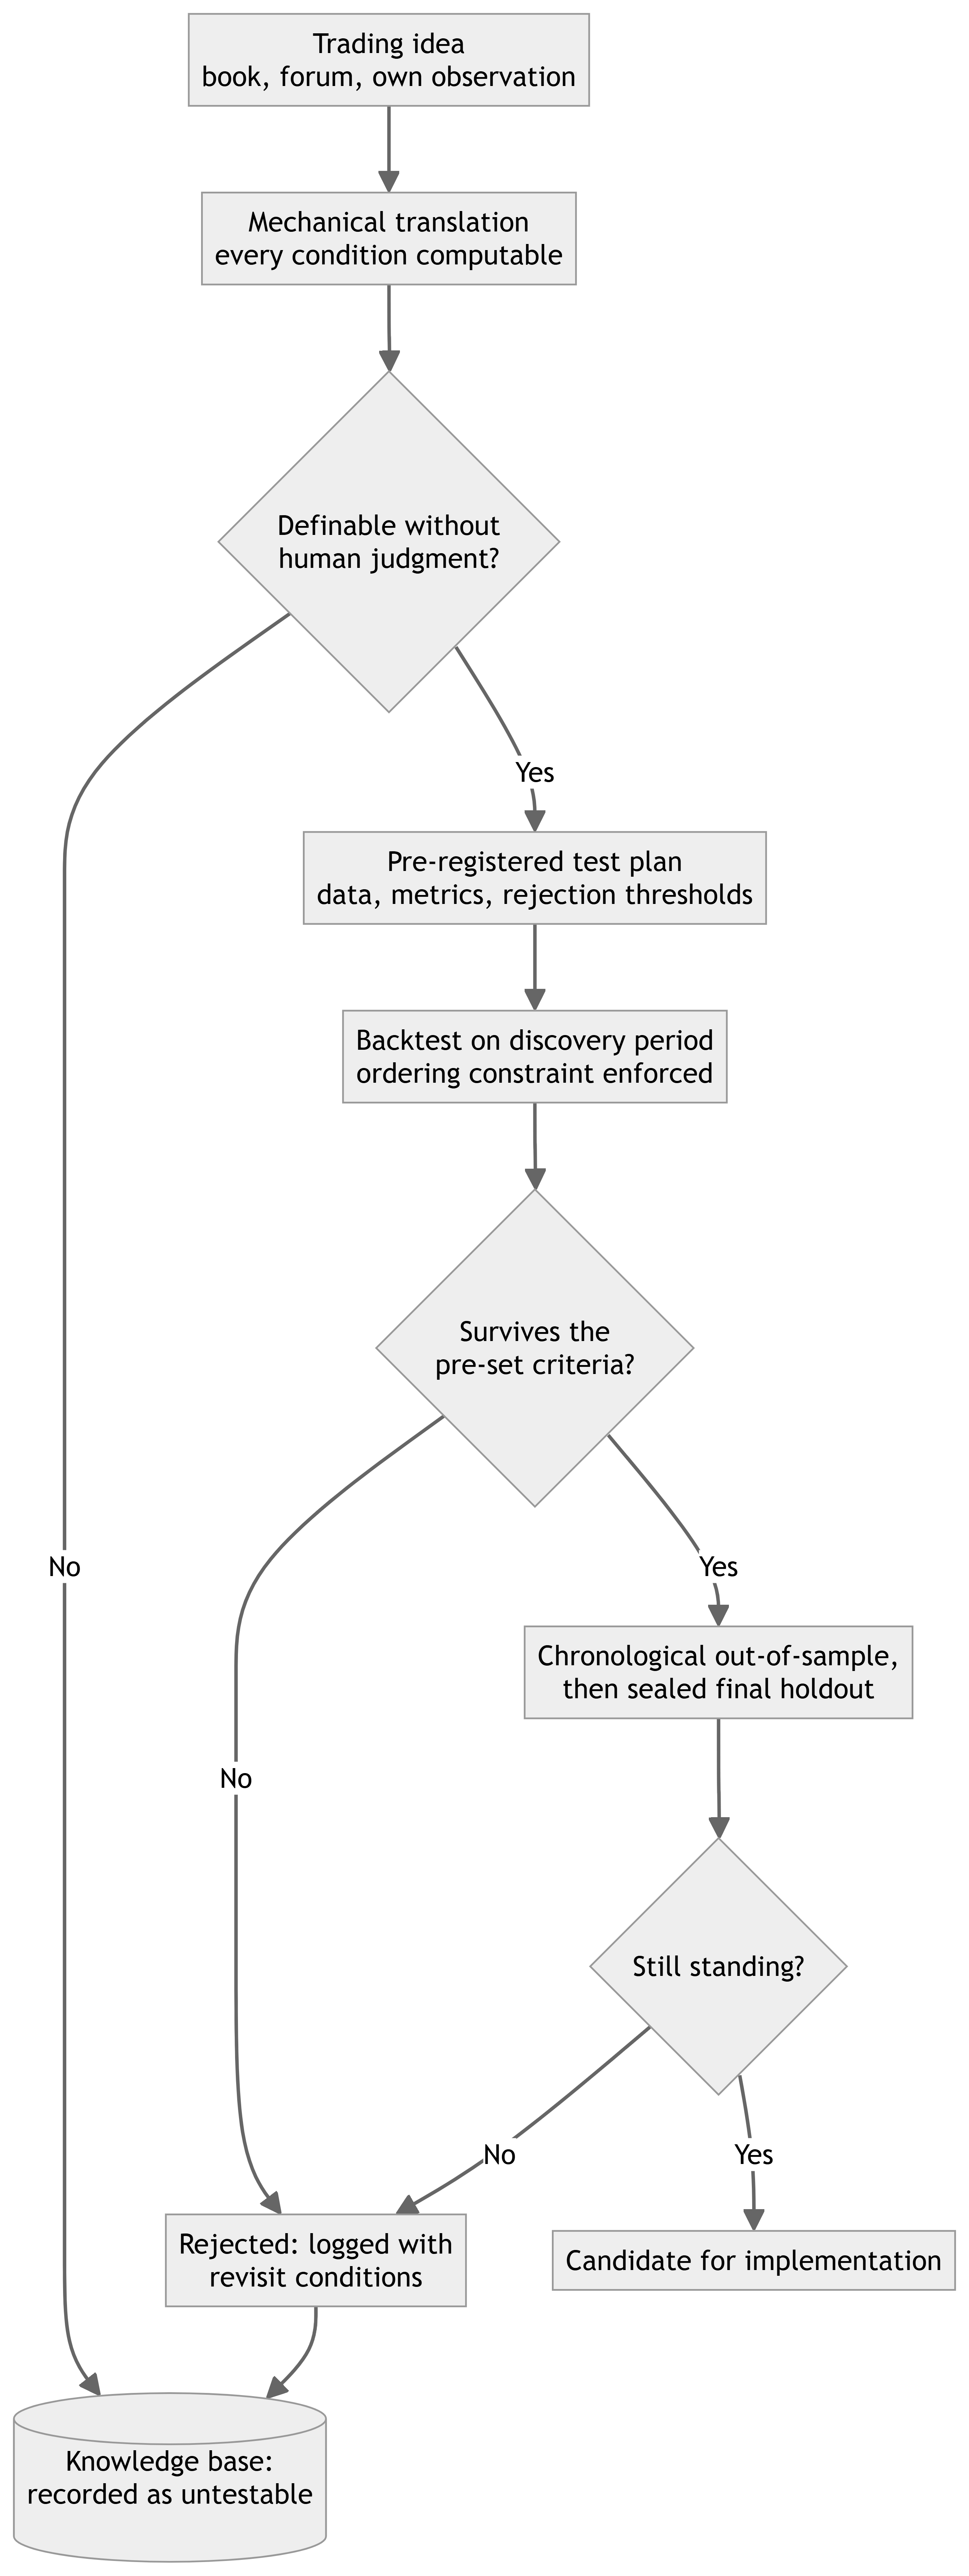
Decide what rejection looks like before the first run
The most dangerous moment in backtesting is not the first test run. It is the second one — the one you design after seeing the first result.
Once a result is on screen, humans negotiate. The losing year gets explained away as an anomaly. The evaluation metric drifts from expectancy to win rate, because win rate happens to look better this time. A date range shifts by six months. None of these feel like cheating while they happen, and together they guarantee that every idea eventually passes.
Our answer is pre-registration. Before the first run, we write down the hypothesis, the data and period, the evaluation metrics, and the exact thresholds that mean rejection. The document gets a date. When results arrive, they are judged against that file — not against how the equity curve makes us feel.
Pre-registration also forces an honest answer to a question most backtesters skip: how many things did you try? If you search 200 parameter combinations, a few will look attractive by pure chance, so a survival bar set for a single test is far too low for a 200-cell search. The acceptance criteria have to reflect the size of the space you explored.
One consequence took us a while to accept. "No edge was found in this search space" is a legitimate final result. The space was defined, examined under fixed conditions, and closed. Recorded properly, that sentence has lasting value, because it tells future research where not to dig.
The ordering rule that catches look-ahead bias
A single constraint eliminates an entire class of silent errors: a feature must be fully observable before the signal that uses it, and the signal must come before the fill.
Feature time ≤ signal time ≤ fill time.
Stated in words, the rule sounds too obvious to write down. In code, it is violated constantly, and almost never on purpose. The classic patterns — hypothetical here, but familiar to anyone who has audited a strategy tester setup — include using the current bar's close inside a rule that is evaluated while that bar is still forming, deriving a daily level from a session that has not ended yet, and indicators that recalculate their own history so that the past looks cleaner than it was when it was the present.
What makes look-ahead bias dangerous is that it produces results that are not just wrong but attractive. A strategy that accidentally sees five minutes into the future has a beautiful equity curve, and nothing about the output warns you.
The fix is procedural rather than heroic: make the ordering constraint an explicit check in your testing process instead of something you trust yourself to remember. Every hypothesis we test must satisfy it before results count.
A cheap diagnostic helps here. If a result looks unusually clean, delay every signal by one bar and rerun the test. A real edge degrades somewhat, because entries are now slightly late. An edge built on information leakage tends to collapse outright — the strategy was never predicting anything, only reading answers it should not have had. The delay test costs a few minutes, and it is worth running before serious time goes into any result that looks too good.
Split by time, and leave one period sealed
Random train/test splits are standard in machine learning tutorials and a poor fit for trading research. Markets have regimes. Volatility clusters. Shuffling bars into random buckets leaks the character of every era into every other era, and the out-of-sample result stops meaning anything.
We split chronologically, and only chronologically. Older data is for discovery, a later block is for validation, and the most recent block is a final holdout that stays sealed until the last promotion decision. The holdout is opened once.
The discipline has an expensive edge case. If a period was viewed during exploration — even casually, even in a chart window — it no longer qualifies as a holdout. The honest response is to reassign an unseen period, which costs data and is genuinely annoying. We accepted that cost because the alternative is worse: an out-of-sample label on a period the researcher has already internalized is self-deception, whatever the folder is named.
Count events, not rows
A three-week trend can fill a thousand M5 bars. It is still one event.
Rows derived from the same market episode are not independent evidence, and counting them as if they were shrinks confidence intervals until everything looks certain. This is one of the quieter ways a backtest lies. The trade count says two thousand; the number of genuinely independent situations behind it may be a few hundred.
So we count sample size in events, and when we estimate confidence intervals we resample by event rather than by row. The immediate effect is discouraging — honest datasets are smaller than they appear, and conclusions get wider error bars. The long-term effect is the point. Decisions rest on evidence that does not evaporate when the market changes tempo.
Rejected hypotheses are the most reusable output
Of our 86 hypotheses, more than 80 were rejected. Deleting them would have been a mistake.
Each rejection is recorded with the same care as an adoption: what was tested, under which conditions, what the result was, why it was rejected, and — the part that pays for itself — what would have to change for the idea to deserve another look. Those revisit conditions live in a registry we check when new information arrives.
There are two practical reasons for the bookkeeping. Rejected ideas come back; a year later the same mechanism reappears wearing different vocabulary, and without a record you pay for the same lesson twice. And the map of where edge is not narrows every future search. Knowing that a whole family of approaches showed nothing on twenty years of data is coverage, not a sad story.
A minimal version you can run in MetaTrader 5
Nothing above requires proprietary tooling. A workable version of this pipeline, using standard MetaTrader 5 components, looks like this:
- Build a long real-tick dataset as a custom symbol, and record its source, period, and quality. Fix your cost assumptions and write them down. (For our published USDJPY results: real-tick modeling, 98 percent history quality, and a total trading cost assumption of about 0.7 pips.)
- Before the first Strategy Tester run of a new idea, create a dated text file stating the hypothesis, the metrics, and the rejection thresholds. Treat that file as read-only once testing starts.
- Keep test conditions identical across every variant you compare. A comparison across different spreads or date ranges is not a comparison.
- Split your history chronologically, and pick a final period you commit to not opening until the end.
- Keep every tester report — the rejected ones most of all.
The file-before-first-run habit is the one we would defend hardest. It converts backtesting from an argument you have with yourself into a measurement.
What survived
Across this research program, the simulation count passed 200,000 runs. The four hypotheses that survived the full pipeline shared one property that became an adoption requirement in its own right: the edge could be explained by market structure — by who is doing what in the market, and when — rather than by the backtest curve alone. A result we could not explain was treated as a result we did not have.
Origin-U Project is an independent quantitative foreign exchange research project based in Japan. The concepts discussed in this article are implemented in Bushido, a commercial USDJPY portfolio EA developed by Origin-U Project.
If you keep a single habit from this article, keep this one: before your next backtest, write down what rejection looks like — and date the file.
Origin-U Research Notes — Part 8 of 10
← Previous: The Difference Between Backtesting and Forward Testing | Next: Designing Low Drawdown Trading Systems: Drawdown as an Input, Not an Outcome →
日本語版: トレードのアイデアを実装前にどう評価するか — 86本の仮説を検証した手順
Full series
- Building a Multi-Strategy Portfolio EA for USDJPY: What 86 Tested Hypotheses Taught Us
- Why Diversification Matters in Algorithmic Trading
- Risk Management Before Profit: Designing the Loss Side of a Trading System First
- Why We Chose Not to Use Martingale or Grid Systems
- Using Monte Carlo Simulation to Evaluate Trading Systems
- What Makes a Robust Forex Strategy: Judging the Process, Not the Chart
- The Difference Between Backtesting and Forward Testing
- How We Evaluate Trading Ideas Before Implementation
- Designing Low Drawdown Trading Systems: Drawdown as an Input, Not an Outcome
- Lessons Learned from Long-Term USDJPY Research: What 20 Years of Tick Data Taught Us




