Community MQL5 Channel
More Information About Product
The Problem With Trading Technicals📉
Let’s be honest. Trading Gold (XAUUSD) using only technical charts is a great way to trade, but its not enough.
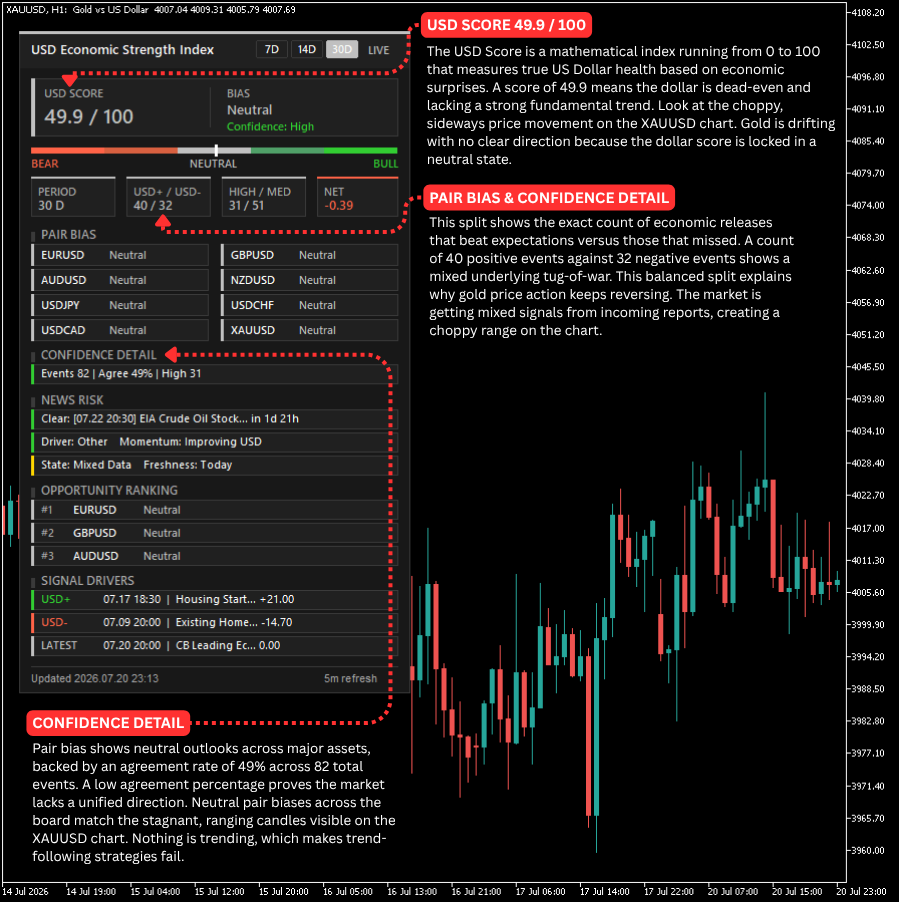
If you look at the chart above, price action is choppy, messy, and stuck in a tight range. You see green and red candles bouncing back and forth with zero real direction. Every time you think a breakout is happening, price reverses right back into the middle.
Why does this happen? Because technical charts do not show you what the US Dollar is actually doing behind the scenes.
That is why I built the USD Economic Strength Index. Here is how it reads the market and keeps me out of bad trades.
1. Reading the True Market State
The USD Score measures real US Dollar health from 0 to 100 using live economic data. A score of 49.9 means the dollar is completely dead-even. When the dollar has zero momentum, Gold has no clear reason to trend. This score tells me immediately to stop chasing breakouts and trade the range.
2. Cutting Out Over-Analysis
The bias reading tells me the immediate market mood derived from the score. A neutral bias matches the tight ranges on my XAUUSD chart. I use this to stay out of trouble. When the bias is neutral, I target range boundaries instead of betting on a fake trend.
3. Uncovering the Real Data Split
This row counts how many economic reports beat expectations versus how many missed. A 40 to 32 split shows a real tug-of-war going on in the background. This mixed data explains why Gold keeps stalling and reversing on the chart .
4. Backed by Heavy Research Depth
This metric counts the high and medium-impact news events factored into the index. Tracking 31 high-impact and 51 medium-impact events proves my market view relies on deep macroeconomic research. It tells me the chop on my chart is real institutional consolidation, not random market noise.
5. Measuring the Net Surprise
The net value combines all economic surprises into a single bottom-line figure. A score of -0.39 shows economic data is slightly underperforming. This minor negative value is why Gold cannot sustain any major downside momentum.
6. Knowing When Consensus Breaks Down
Pair bias shows neutral outlooks across major assets, backed by a 49% agreement rate across 82 total events. A low agreement percentage proves the broader market lacks a unified direction. This indicator tells me precisely when market consensus breaks down so I can adjust my strategy.
7. Spotting Real-Time News Catalysts
Signal drivers isolate the exact economic catalysts moving the market right now. The latest CB Leading Economic Index release sits flat at 0.00, matching the exact lack of movement on my gold chart. I use this to verify news releases before they surprise my account.
Trade Smarter, Not Harder 🚀
Stop guessing what Gold is going to do next. Let real fundamental data guide your entries.
Check out our community updates on the USD Strength Index MQL5 Channel.
Grab the tool for yourself and get an edge today at the USD Strength Index MQL5 Market Page.