
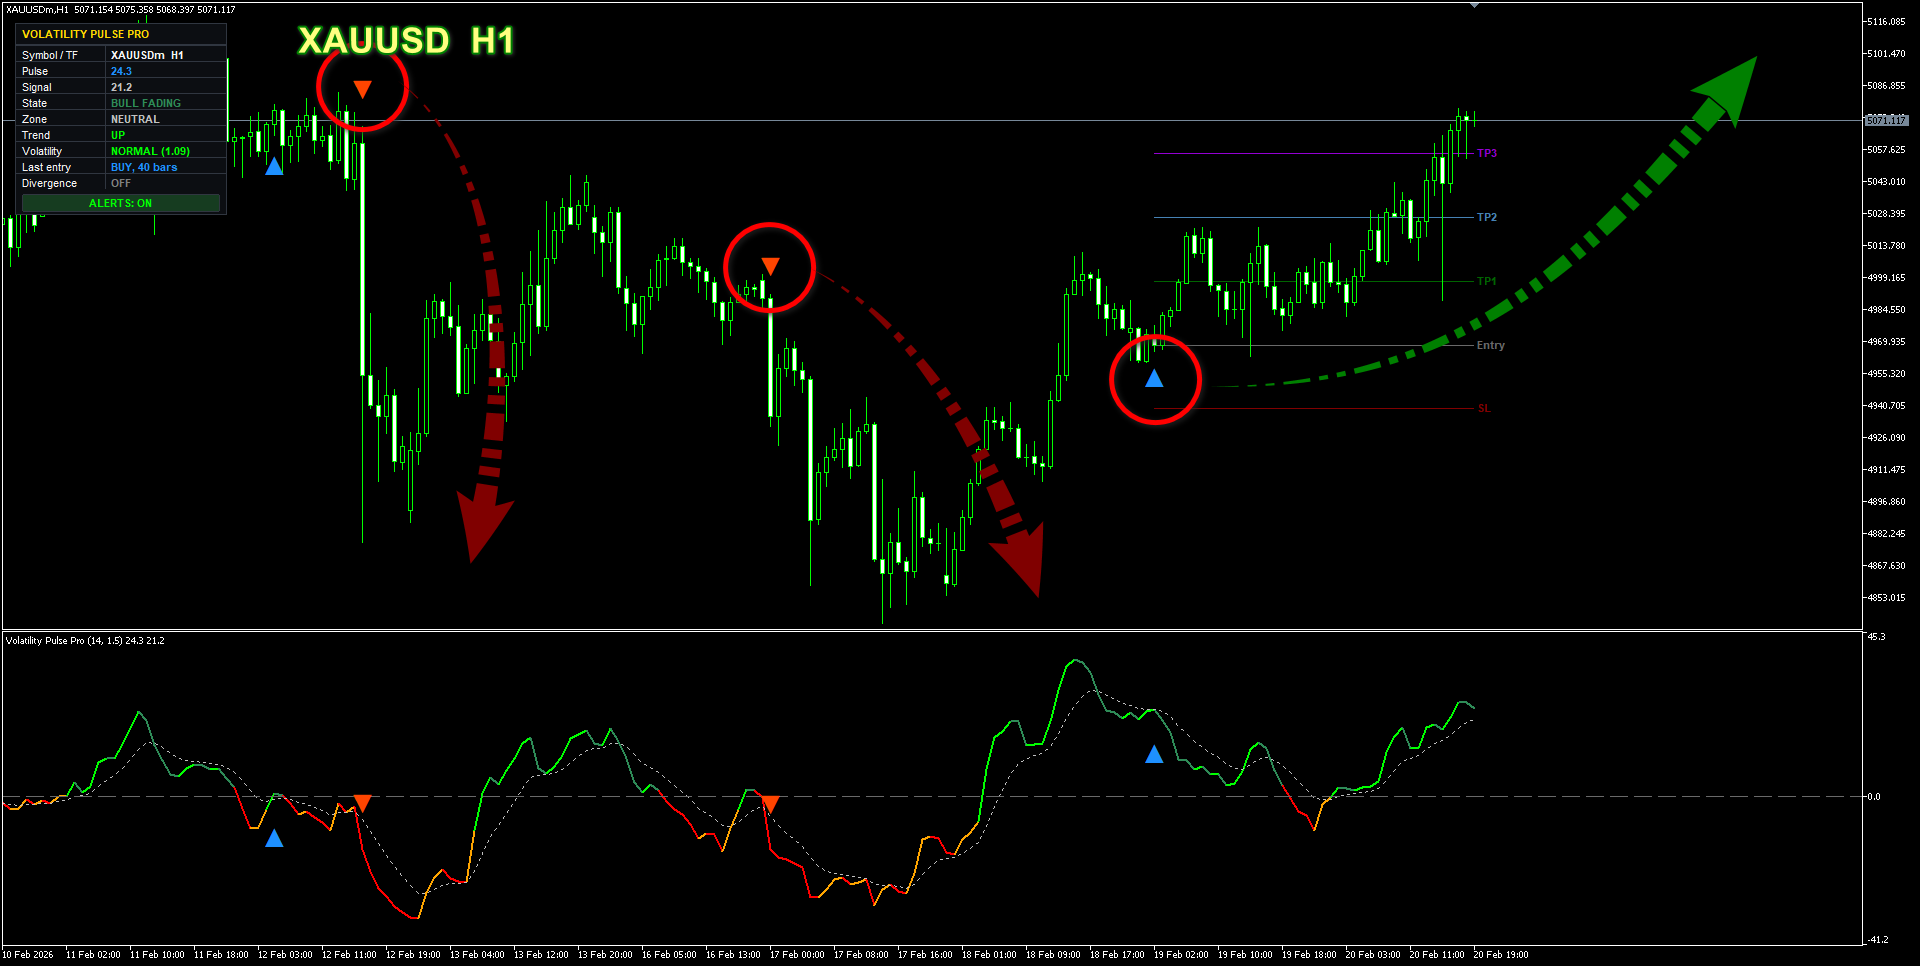
You have seen that screenshot. Blue arrow at the bottom. Orange arrow at the top. Price doing exactly what it was told.
So you buy the indicator, load it on your chart — and somehow your arrows never look like the ones in the picture.
Here is what actually happened. You were shown twelve arrows out of two hundred. The other one hundred and eighty-eight were cropped out.
This post is not going to show you a screenshot. It is going to show you how to check one.
First: why your settings keep breaking
Thirty pips on EURCHF is a serious move. Thirty pips on Gold is noise. Thirty pips on EURUSD at 3am is a big deal — at the London open it is nothing.
Now think about what that does to every indicator you own.
RSI 70 on Gold and RSI 70 on EURCHF are not the same event. Your "overbought" line is quietly measuring a different thing on every chart you open. Your 20-pip stop is generous on one pair and suicidal on another.
That is why you keep re-tuning settings and never land on the right ones.
There are no right numbers when the ruler keeps changing length.
Most traders spend years fighting this without ever naming it.
The fix: stop counting pips
Ask a better question.
Not "how many pips did it move?"
But "how big was that move compared to how much this market normally moves right now?"
One question. One answer. And it means the same thing on every symbol, in every session, on every timeframe.
That is the entire idea behind Volatility Pulse Pro. It measures each move against that market's own current speed. A reading of +40 means the same thing on EURUSD, on Gold, on an index, at 3am or at the London open.
You learn to read one scale. It works everywhere.
A framework to start from
Not a holy grail. A starting point:
- Only trade when the market is going somewhere. Turn the regime filter on. Ranges will eat you alive with a momentum tool — it will buy the top of the range and sell the bottom, every time.
- Only trade with the trend. The panel tells you which way it points. Do not argue with it.
- Skip sleepy markets. When the panel says volatility is low, close the laptop.
- Enter on the arrow, at the candle close. Never chase.
- Stop where the indicator puts it — sized to how much the market is actually moving, not to how much you feel like losing.
- Take a third off at the first target, move your stop to break-even, let the rest run. Now the trade cannot hurt you, and it still might pay.
Rule 6 is where most traders leak. They cut winners at target and let losers run to the stop. The whole point of three targets is to do the opposite.
Now the part nobody does
Here is the habit that separates traders who survive from traders who donate.
Do not trade those rules yet.
Switch on the statistics panel. Volatility Pulse Pro goes back through every past arrow, checks what price actually did next on your broker's data, on your pair, with your spread — and tells you how they really turned out. Win rate. Average win. Average loss. Expectancy.
Then change one rule. Watch the number move. Change it back.
Twenty minutes of that teaches you more than six months of screenshots.
And the panel is built to count against itself, on purpose:
- If one candle hits both your stop and your target, it counts a loss.
- Break-even does not count as a win.
- Trades still running are not counted at all.
So the number you are looking at is a floor, not a sales pitch.
You might not like what you find
Run it and you may discover the default settings do nothing on your pair.
Good. That is the tool working.
Every indicator you have ever bought had that number. Yours just refuses to hide it.
Because there are only two ways to learn that a setup does not work: a panel that tells you in twenty minutes, or an account statement that tells you in six months.
One of those is a lot cheaper.
Try it
Volatility Pulse Pro — one scale for every market, arrows that never repaint, and a statistics engine that will happily tell you when it is wrong.
👉 https://www.mql5.com/en/market/product/185861
Load it. Turn on the statistics. Find out what is actually true on your own charts.
Volatility Pulse Pro is an analysis tool, not a robot. It does not trade for you and it promises no results. The statistics panel is there so you never have to take anyone's word for it — including ours.
(Cover photo > Forex Trading Stock photos by Vecteezy)


