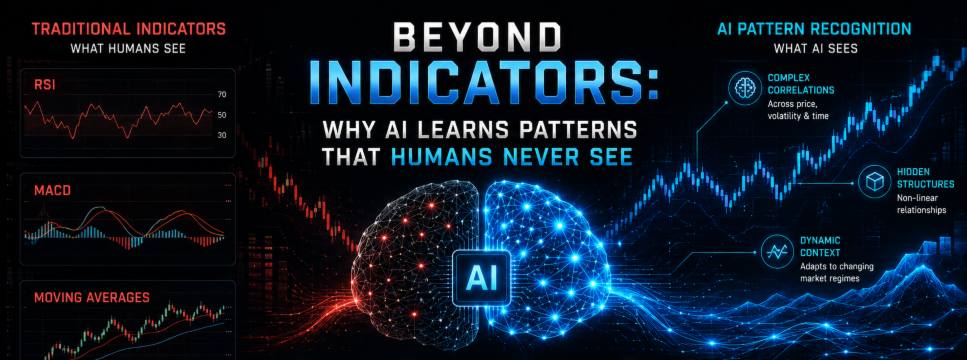

Beyond Indicators: Why AI Learns Patterns That Humans Never See
RSI, MACD and moving averages have anchored retail trading for decades, and for understandable reasons, they are simple, visual, and easy to explain. That simplicity is also precisely their limitation. Each of these tools was built to answer one narrow, fixed question about price, and each carries a specific, inherited blindness by construction, not by accident. Understanding those specific limitations precisely, rather than vaguely dismissing indicators as outdated, is what actually explains why genuine deep learning approaches represent a categorically different tool rather than simply a fancier version of the same idea.
Part One: The Specific Limits of RSI, MACD and Moving Averages
RSI measures the ratio of average gains to average losses over a fixed lookback window, and this fixed window is the source of its central weakness. During a genuinely strong, sustained trend, RSI can remain in overbought or oversold territory for extended periods while price simply keeps moving, producing a reading that technically signals reversal while the market does the opposite. RSI also carries no built in awareness of volatility context, the same numeric reading means something entirely different during a calm period than during a violently volatile one, yet the indicator reports it identically either way.
MACD is constructed from a pair of moving averages compared against each other, and because moving averages are inherently lagging by mathematical construction, MACD inherits that lag directly into its crossover signals. The crossover, by definition, occurs after the underlying price relationship it is measuring has already shifted, meaning the signal consistently arrives after the actual inflection point rather than at it. Like RSI, it carries no native volatility normalization, a crossover on a calm day and an identical crossover during a volatility spike are treated as equivalent signals despite representing very different real conditions.
Moving averages themselves are the most fundamental case, a fixed linear smoothing window applied to price. This construction is structurally blind to nonlinear relationships between variables, and it cannot meaningfully distinguish between a slow, steady grinding trend and a violently trending market, both can produce a similar moving average slope despite representing genuinely different underlying conditions that a trader would want to treat very differently.
None of this makes these tools worthless. It makes them exactly what they were designed to be, simple, fixed lens calculations answering one specific question, with no mechanism to adapt that question or incorporate context beyond their own narrow calculation.
Part Two: How Deep Learning Reads Price, Volatility and Time as One Connected System
The genuine advance in modern architecture is not a better single indicator. It is treating price, volatility and time as one interacting system rather than three separate, independently measured quantities. How volatility behaves at different points within a trend's actual lifecycle carries information a static volatility reading alone cannot capture. The temporal spacing and sequence of price moves, not merely their raw magnitude, can carry genuine signal about what happens next, information a snapshot calculation like RSI or MACD structurally discards the moment it computes its single output value.
Architectures built specifically to capture this connected structure exist in real, working systems. Reservoir computing, such as the Liquid State Machine inside ICONIC KYBERNETIC AI+, is built specifically to grant a system genuine memory of how price action has unfolded across a sequence of time, treating temporal structure as a first class input rather than an afterthought. Grünwald Letnikov fractional calculus, used inside ICONIC BTC AI+ and ICONIC GOLD AI+, is a mathematical method specifically designed to measure momentum with long memory, capturing how past price behavior continues to influence the present in a way a fixed lookback indicator cannot. ICONIC TITAN AI reads the time axis at multiple resolutions simultaneously, scanning seven timeframes in parallel rather than committing to a single fixed window the way a classical indicator must.
Part Three: Why Modern Trading AI Is Not Simply a Vote Across Several Indicators
A common and genuinely important point of confusion deserves direct clarification. Some products marketed as AI are, underneath the label, little more than several classical indicators combined through a weighted vote or a simple scoring system. This is worth understanding clearly because it is not the same thing as genuine representation learning, and the difference matters enormously for what you should actually expect from the result.
Combining several blind measurements does not cure any individual measurement's blindness, it simply averages several blind opinions together. If RSI is blind to volatility context and MACD is blind to it as well, voting between the two does not somehow restore that missing context, both inputs remain equally blind to the exact same thing, and the vote inherits that shared blindness regardless of how the weighting is tuned.
Genuine deep learning based pattern recognition works differently at a structural level. Rather than combining the pre computed outputs of several fixed indicators, a properly trained network works from richer underlying features and discovers genuinely new interactions among them during training, relationships no individual indicator was ever built to detect and no simple vote among existing indicators could ever surface, because the interaction itself was never present in any of the individual inputs being combined. ICONIC TITAN AI illustrates this distinction concretely, its ensemble processes twenty two distinct features through trained neural networks producing genuine joint probability estimates, a fundamentally different computational process from tallying votes across a handful of classical indicator readings.
Part Four: The Genuine Opportunities and the Honest Risks
The real opportunity in this approach is direct, the ability to discover genuinely multivariate, temporal patterns that are structurally invisible to any fixed, single dimension indicator, patterns hiding specifically in the interaction between price, volatility and time rather than in any one of those dimensions viewed in isolation.
The honest risk deserves equal weight rather than being glossed over. A network with enough flexibility can also learn spurious patterns that appear statistically real within historical data but reflect noise rather than genuine, repeatable structure, the well known overfitting problem that affects sophisticated architectures just as much as simple ones if validation discipline is not applied rigorously. Guarding against this requires genuine out of sample testing and requiring accumulated evidence before trusting a learned pattern, disciplines that separate genuinely robust pattern recognition from an impressive looking backtest built on memorized noise.
Frequently Asked Questions
What is the fundamental limitation shared by RSI, MACD and moving averages? Each applies one fixed, predetermined calculation to price with a static lookback window and no built in volatility context, meaning each answers only the single narrow question it was originally designed to answer, regardless of whether that question remains relevant to current conditions.
Is combining several indicators the same as using AI? No. Combining the outputs of several fixed indicators through a vote or weighted score inherits the shared blindness of those individual indicators. Genuine deep learning works from richer underlying features and discovers new interactions during training, rather than averaging pre computed indicator outputs.
How does deep learning treat time differently than classical indicators? Classical indicators typically use a single fixed lookback window. Architectures such as reservoir computing and long memory momentum measurements treat the sequence and spacing of price action as genuine, ongoing information rather than compressing it into one static snapshot value.
What is the biggest risk of pattern recognition based trading systems? Overfitting, a sufficiently flexible model can learn patterns that appear statistically real in historical data but reflect noise rather than genuine structure, making rigorous out of sample validation essential regardless of how sophisticated the underlying architecture is.
Seeing What a Fixed Lens Cannot
Classical indicators will always have a place, they are simple, transparent, and easy to reason about. But every one of them was built to answer a single, fixed question, and no amount of combining several fixed questions together produces the kind of genuine, multivariate, temporal pattern recognition that properly engineered deep learning architectures are specifically built to discover.
Explore systems built to genuinely see beyond a single fixed indicator, from the parallel, multi feature scanning of ICONIC TITAN AI, through the long memory momentum architecture of ICONIC BTC AI+ and ICONIC GOLD AI+, to the reservoir based temporal intelligence of the flagship ICONIC KYBERNETIC AI+, at iconicfx.tech.
Risk Disclaimer. Trading foreign exchange, cryptocurrencies, commodities and other leveraged financial instruments carries a high level of risk and may not be suitable for all investors. The high degree of leverage can work against you as well as for you. Past performance is not indicative of future results. Automated trading systems, indicators and Expert Advisors do not guarantee profits and can produce losses. ICONIC.FX provides software tools only and does not provide investment advice, portfolio management or financial recommendations. You are solely responsible for your own trading decisions. Seek advice from an independent licensed financial advisor if you have any doubts.


![[EURUSD]: Weekly Liquidity Activation Points (LAP), October 12-16, 2026](https://c.mql5.com/6/1035/splash-preview-777305.png "[EURUSD]: Weekly Liquidity Activation Points (LAP), October 12-16, 2026")
![[XAUUSD]: Weekly Liquidity Activation Points (LAP), October 12-16, 2026](https://c.mql5.com/6/1035/splash-preview-777299.png "[XAUUSD]: Weekly Liquidity Activation Points (LAP), October 12-16, 2026")
![[Nasdaq]: Weekly Liquidity Activation Points (LAP), October 12-16, 2026](https://c.mql5.com/6/1035/splash-preview-777311.png "[Nasdaq]: Weekly Liquidity Activation Points (LAP), October 12-16, 2026")