")
Market Structure Patterns – Complete SMC Indicator Guide (Concepts + Settings)

📘 Market Structure Patterns – Complete SMC Indicator Guide (Concepts + Settings)
This document explains the parameters of the Market Structure Patterns indicator as well as the underlying trading concepts used in its logic.
The indicator is available for both MetaTrader 4 and MetaTrader 5 on the MQL5 Market:
⬇️ Market Structure Patterns (MT5): https://mql5.com/8cicg
⬇️ Market Structure Patterns (MT4): https://mql5.com/8chj4
📖 Contents:
1) General · 2) Trend · 3) Internal Structure · 4) Swing Structure · 5) Internal Order Blocks · 6) Swing Order Blocks · 7) Equal High / Low · 8) Buy/Sell Side Liquidity · 9) Fair Value Gaps · 10) Inverse FVG · 11) Implied FVG · 12) Balanced Price Range · 13) Liquidity Voids · 14) Opening Gaps · 15) Premium / Discount · 16) Multi-Timeframe · 17) Higher Timeframe OHLC · 18) Sessions · 19) Font Size · 20) Alerts
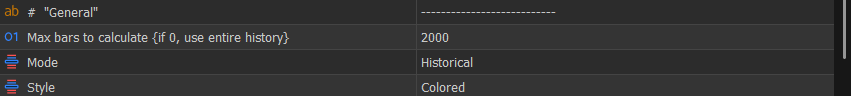
🔧 General
Max bars to calculate – Defines how many historical candles are processed by the indicator; setting this to 0 uses the entire history but may reduce performance, while lower values improve speed at the cost of less historical context.
Mode – Controls whether the indicator displays all historical drawings or only the most recent/active instance of each pattern, where showing only active elements results in a cleaner chart focused on current trading conditions.
Style – Defines the visual style of the indicator without affecting its logic.
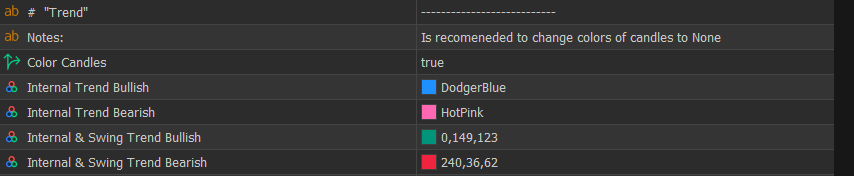
📈 Trend
Color Candles – Enables coloring of candles based on trend direction, helping to visually align trades with market bias.
Internal Trend Bullish – Defines the candle color when the internal (short-term) trend is bullish.
Internal Trend Bearish – Defines the candle color when the internal (short-term) trend is bearish.
Internal & Swing Trend Bullish – Defines the candle color when both internal and swing trends are bullish, indicating stronger directional alignment.
Internal & Swing Trend Bearish – Defines the candle color when both internal and swing trends are bearish.
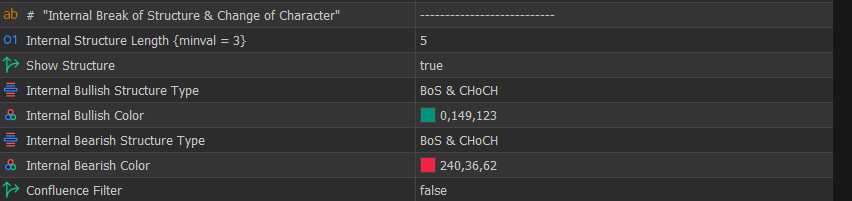
🔄 Internal Structure
Internal Structure Length – Defines how many candles are required to confirm internal highs and lows, where lower values provide faster signals with more noise, while higher values delay confirmation and produce cleaner structure; scalpers typically prefer lower values while swing traders prefer higher values.
Show Structure – Enables or disables internal BOS and CHoCH display.
Internal Bullish Structure Type – Defines which bullish internal structure events are displayed.
Internal Bullish Color – Defines the color used for bullish internal structure.
Internal Bearish Structure Type – Defines which bearish internal structure events are displayed.
Internal Bearish Color – Defines the color used for bearish internal structure.
Confluence Filter – Filters weaker signals to reduce noise and improve overall signal quality.
📌 Concepts – Market Structure (BOS & CHoCH)
A Break of Structure (BOS) occurs when price continues the current trend by breaking a previous high in an uptrend or a previous low in a downtrend, confirming continuation.
A Change of Character (CHoCH) occurs when price breaks structure in the opposite direction of the current trend, signaling a potential shift in market direction.
These concepts define how the indicator interprets market structure.
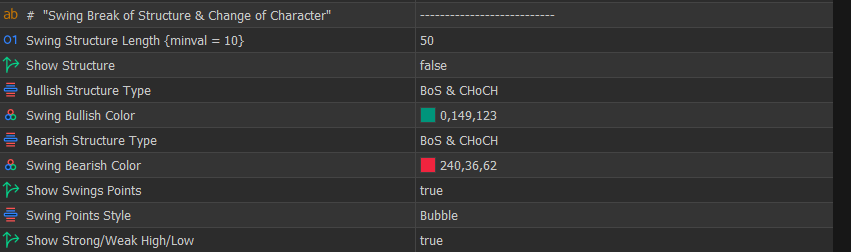
🔁 Swing Structure
Swing Structure Length – Defines how many candles are required to confirm swing highs and lows, where lower values produce faster but noisier signals and higher values produce slower but more reliable structure suitable for higher timeframe bias.
Show Structure – Enables or disables swing BOS and CHoCH.
Bullish Structure Type – Defines which bullish structure events are displayed.
Swing Bullish Color – Defines the color used for bullish swing structures.
Bearish Structure Type – Defines which bearish structure events are displayed.
Swing Bearish Color – Defines the color used for bearish swing structures.
Show Swings Points – Displays HH, HL, LH, and LL points.
Swing Points Style – Defines how swing points are displayed.
Show Strong/Weak High/Low – Highlights strong and weak liquidity levels.
📌 Concepts – Strong vs Weak Highs/Lows
A strong high or low is a swing point that supports continuation of the current trend, meaning it is less likely to be broken.
A weak high or low is a swing point that is likely to be taken by price, as it does not support continuation.
- In an uptrend → lows are strong, highs are weak
- In a downtrend → highs are strong, lows are weak
Weak levels are common liquidity targets, while strong levels tend to hold.
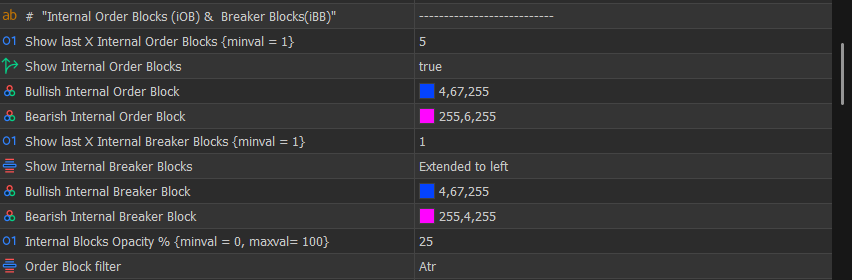
📦 Internal Order Blocks (iOB & iBB)
Show last X Internal Order Blocks – Limits the number of recent internal order blocks displayed to reduce clutter.
Show Internal Order Blocks – Enables or disables internal order blocks.
Bullish Internal Order Block – Defines the color used for bullish internal order blocks.
Bearish Internal Order Block – Defines the color used for bearish internal order blocks.
Show last X Internal Breaker Blocks – Limits the number of internal breaker blocks displayed.
Show Internal Breaker Blocks – Controls how breaker blocks are displayed.
Internal Blocks Opacity % – Controls visibility of blocks relative to chart clarity.
Order Block filter – Specify how to filter out small / bigger order blocks.
📌 Concepts – Order Blocks & Confirmation
An order block represents the price area where a short-term directional shift begins, typically the last candle in the opposite direction before an impulsive move.
In this indicator, order blocks are confirmed using structure:
- A bullish order block is confirmed when price breaks the last confirmed high (BOS)
- A bearish order block is confirmed when price breaks the last confirmed low
This ensures that only order blocks associated with real structural shifts are considered.
📌 Concepts – Breaker Blocks
A breaker block is formed when an order block fails and price breaks through it, causing it to act as a continuation zone in the opposite direction.
📌 Concepts – Mitigation
Mitigation occurs when price returns to an imbalance zone (such as an order block or FVG) to rebalance unfilled orders.
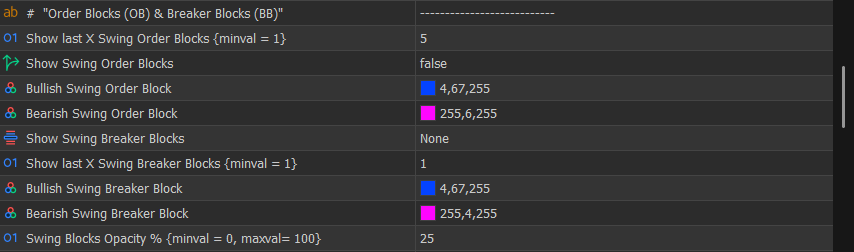
📦 Swing Order Blocks (OB & BB)
Show last X Swing Order Blocks – Limits displayed swing order blocks to maintain chart clarity.
Show Swing Order Blocks – Enables or disables swing order blocks, which represent higher timeframe zones.
Bullish Swing Order Block – Defines the color used for bullish swing order blocks.
Bearish Swing Order Block – Defines the color used for bearish swing order blocks.
Show Swing Breaker Blocks – Enables or disables swing breaker blocks.
Show last X Swing Breaker Blocks – Limits displayed breaker blocks.
Swing Blocks Opacity % – Controls visibility of swing zones.
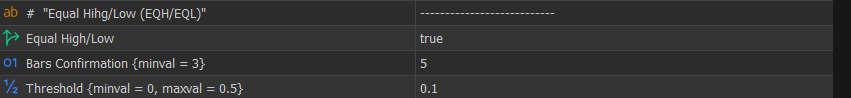
⚖️ Equal High / Low (EQH/EQL)
Equal High/Low – Enables detection of equal highs and lows.
Bars Confirmation – Defines how many candles are required to confirm equal levels, where higher values produce stronger but fewer signals.
Threshold – Defines how close levels must be, where higher values detect more zones but with less precision.
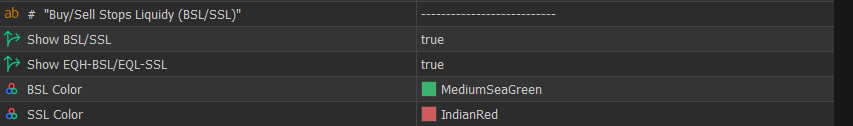
💧 Buy/Sell Side Liquidity (BSL/SSL)
Show BSL/SSL – Enables or disables liquidity levels.
Show EQH-BSL/EQL-SSL – Highlights liquidity associated with equal highs and lows.
BSL Color – Defines the color used for buy-side liquidity.
SSL Color – Defines the color used for sell-side liquidity.
📌 Concepts – Liquidity (BSL / SSL)
Liquidity represents areas where stop orders are concentrated, typically above highs and below lows.
Buy-Side Liquidity (BSL) forms above highs- Sell-Side Liquidity (SSL) forms below lows
Liquidity commonly forms around:
These levels are targeted because they contain clusters of stop orders.
Internal and swing highs/lows- Equal highs and equal lows
- Previous day, week, or month highs and lows
Order blocks are derived from these same structural highs and lows, so liquidity is inherently tied to structure rather than being a separate concept.
Large participants use these zones to execute positions efficiently, often placing limit orders against triggered stop orders to enter trades.
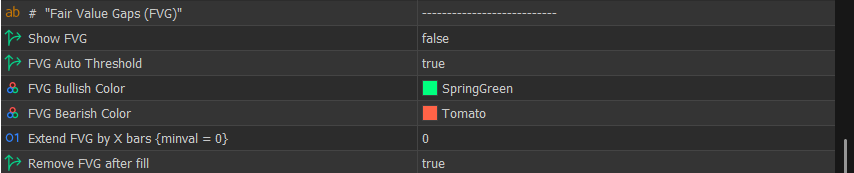
🟩 Fair Value Gaps (FVG)
Show FVG – Enables or disables fair value gaps.
FVG Auto Threshold – Filters weaker gaps automatically, where enabling it produces cleaner charts and disabling it allows detection of all imbalances including minor ones.
Extend FVG by X bars – Extends gaps forward for future interaction.
Remove FVG after fill – Removes gaps after mitigation.
📌 Concepts – Imbalance (Fair Value Gaps)
A Fair Value Gap (FVG) forms when price moves aggressively in one direction, creating a gap between candles where little to no trading activity occurs.
Technically, an FVG is identified using a three-candle pattern:
- In a bullish FVG, the low of the third candle is above the high of the first candle
- In a bearish FVG, the high of the third candle is below the low of the first candle
This creates a visible gap between the first and third candles, representing an area where price moved too quickly and skipped trading at certain levels.
This type of movement is considered inefficient price delivery, meaning that not all orders were properly matched during the move.
As a result, price often returns to these areas to rebalance the inefficiency, which is why FVGs are commonly used as reaction zones.
💡 Practical interpretation:
- Strong impulsive moves are more likely to leave FVGs
- Larger gaps tend to be more significant than smaller ones
- Auto-threshold filtering helps remove minor gaps and focus on meaningful imbalances
- FVGs can act as support in bullish scenarios and resistance in bearish scenarios
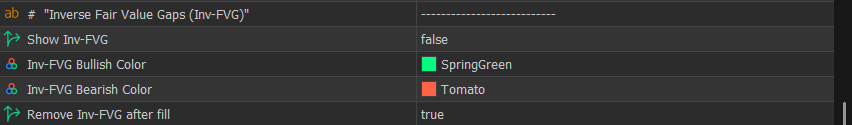
🔁 Inverse Fair Value Gaps (Inv-FVG)
Show Inv-FVG – Enables or disables the display of inverse fair value gaps, which are typically formed when price invalidates a previous imbalance and continues in the opposite direction, often acting as continuation zones.
Inv-FVG Bullish Color – Defines the color used for bullish inverse fair value gaps.
Inv-FVG Bearish Color – Defines the color used for bearish inverse fair value gaps.
Remove Inv-FVG after fill – Removes inverse gaps after they have been mitigated, keeping the chart focused on active zones.
📌 Concepts – Inverse Fair Value Gaps
An Inverse Fair Value Gap (Inv-FVG) forms when a previously identified fair value gap is broken and price moves through it instead of respecting it.
This behavior indicates that the original imbalance has failed and that market pressure is strong in the opposite direction.
As a result:
- The original FVG loses its validity
- The area can act as a continuation zone rather than a reaction zone
💡 Practical interpretation:
- A respected FVG suggests potential reversal or reaction
- A broken FVG (Inv-FVG) suggests continuation and strength in the opposite direction
This makes inverse gaps particularly useful for confirming momentum and avoiding fading strong moves.
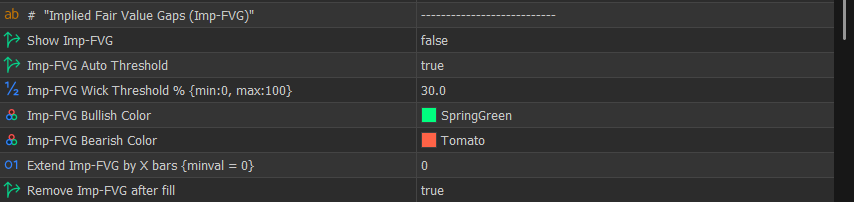
🧠 Implied Fair Value Gaps (Imp-FVG)
Show Imp-FVG – Enables or disables the display of implied fair value gaps, which are derived from wick-based inefficiencies rather than standard candle gaps.
Imp-FVG Auto Threshold – Automatically filters weaker implied gaps, helping to focus on more meaningful price imbalances.
Imp-FVG Wick Threshold % – Defines how large the wick must be relative to the candle, where higher values require stronger rejection and produce fewer but higher-quality signals.
Imp-FVG Bullish Color – Defines the color used for bullish implied fair value gaps.
Imp-FVG Bearish Color – Defines the color used for bearish implied fair value gaps.
Extend Imp-FVG by X bars – Extends implied gaps forward to track future interaction.
Remove Imp-FVG after fill – Removes the gap after it has been mitigated.
📌 Concepts – Implied Fair Value Gaps
An Implied Fair Value Gap (Imp-FVG) represents an imbalance that is not visible as a traditional gap between candles but is instead inferred from strong wick rejection.
These occur when:
- Price rapidly moves in one direction
- A significant wick is left behind, indicating inefficient price delivery
Although no classic gap is present, the wick suggests that part of the price movement was not fully traded.
💡 Practical interpretation:
- Implied gaps are more subtle than standard FVGs
- They often act as precise reaction zones
- Higher wick thresholds help filter weaker signals and highlight stronger rejection
These are especially useful for traders looking for refined entries with tighter zones.
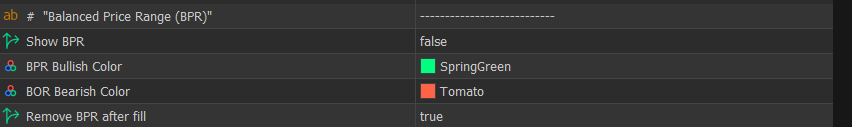
⚖️ Balanced Price Range (BPR)
Show BPR – Enables or disables the display of balanced price ranges, which represent areas where opposing imbalances overlap and price becomes more efficient.
BPR Bullish Color – Defines the color used for bullish balanced price ranges.
BPR Bearish Color – Defines the color used for bearish balanced price ranges.
Remove BPR after fill – Removes the balanced range after price has fully traded through it, keeping the chart focused on active zones.
📌 Concepts – Balanced Price Range (BPR)
A Balanced Price Range (BPR) forms when two opposing imbalances overlap, typically when a bullish and bearish fair value gap intersect.
This overlap indicates that price has partially rebalanced, creating an area where buying and selling pressure are more evenly matched.
In contrast to imbalances (FVG), which represent inefficient price delivery, BPR represents relative equilibrium.
💡 Practical interpretation:
- BPR zones tend to produce more neutral or consolidative behavior
- They can act as reaction areas but are generally less directional than pure imbalances
- Price may pause, consolidate, or transition within these zones before the next move
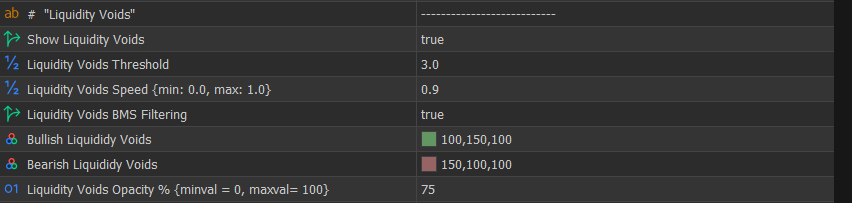
🌊 Liquidity Voids
Show Liquidity Voids – Enables detection of liquidity voids.
Liquidity Voids Threshold – Defines minimum move size.
Liquidity Voids Speed – Defines how impulsive the move must be.
Liquidity Voids BMS Filtering – Displays only voids that lead to BOS or CHoCH, filtering out irrelevant moves.
📌 Concepts – Liquidity Voids
A Liquidity Void forms when price moves extremely quickly in one direction over multiple consecutive candles, leaving very little trading activity within that range.
Unlike a Fair Value Gap (which is based on a specific 3-candle gap), liquidity voids are characterized by:
- Strong, consecutive candles in the same direction
- Large displacement (impulsive movement)
- Minimal pullbacks or overlap between candles
This creates a wide price area where the market traded inefficiently due to lack of opposing orders.
Because of this imbalance in participation, these zones often attract price later as the market seeks to rebalance and fill the inefficiently traded range.
💡 Practical interpretation:
- Liquidity voids typically indicate strong momentum and institutional activity
- Larger and faster moves create more significant voids
- Price may revisit these zones partially or fully before continuing
- When combined with BOS or CHoCH (BMS filtering), voids become more relevant as they are tied to structural shifts rather than random volatility
📌 Difference Between FVG and Liquidity Void
- FVG → precise imbalance based on a 3-candle gap
- Liquidity Void → broader inefficiency caused by sustained impulsive movement
In simple terms:
- FVG = localized imbalance
- Void = extended imbalance
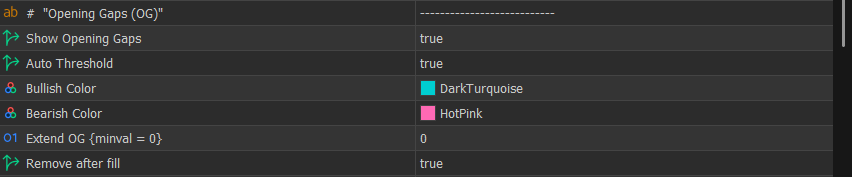
📉 Opening Gaps (OG)
Show Opening Gaps – Enables or disables the display of opening gaps, which occur when price opens significantly above or below the previous close, creating an imbalance between sessions.
Auto Threshold – Automatically filters smaller gaps, keeping only more significant ones, resulting in a cleaner chart, while disabling it allows detection of all gaps including minor ones.
Bullish Color – Defines the color used for bullish opening gaps.
Bearish Color – Defines the color used for bearish opening gaps.
Extend OG – Extends the gap forward, allowing traders to track whether it remains unfilled and acts as a potential reaction zone.
Remove after fill – Removes the gap once price has fully filled it, keeping the chart focused on active imbalances.
📌 Concepts – Opening Gaps
An Opening Gap (OG) occurs when the market opens at a different price from the previous session close, leaving a visible gap between the two prices.
This typically happens due to:
- News releases
- Economic events
- Changes in sentiment during closed market hours
Because no trading occurs within the gap, it creates an inefficient price area, similar to a fair value gap.
📌 Why Opening Gaps Matter
Opening gaps reflect a sudden shift in supply and demand between sessions.
Since price “jumps” from one level to another without trading in between, the gap represents an area where orders were not matched.
As a result, price often revisits these levels to:
- Rebalance the market
- Fill untraded orders
- Confirm or reject the new price level
This behavior is why gaps frequently act as:
- Support (in bullish scenarios)
- Resistance (in bearish scenarios)
📌 Practical Interpretation
- Larger gaps tend to be more significant than smaller ones
- Gaps aligned with trend direction often act as continuation zones
- Gaps against the trend are more likely to be filled quickly
- Combining gaps with structure (BOS/CHoCH) and liquidity improves reliability
📌 Relationship with Other Concepts
- FVG → imbalance within continuous trading
- Opening Gap → imbalance between sessions
- Liquidity Void → extended impulsive imbalance
All represent inefficiencies, but originate from different market conditions.
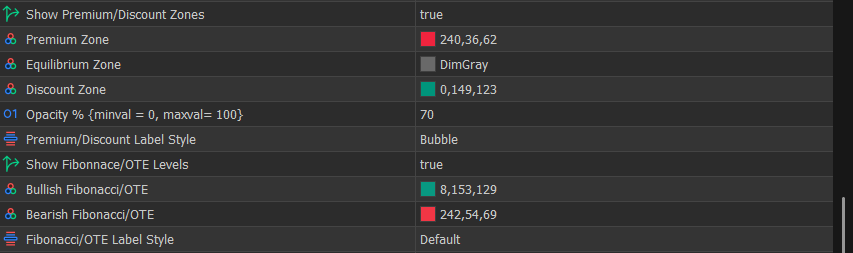
💰 Premium / Discount Zones
Show Premium/Discount Zones – Enables display of premium, equilibrium, and discount zones.
Opacity % – Controls visibility.
Show Fibonacci/OTE Levels – Enables Fibonacci-based entry zones.
📌 Concepts – Premium & Discount
Premium and discount are defined using the range between a swing high and a swing low derived from market structure.
- Above the midpoint (50%) → premium zone
- Below the midpoint (50%) → discount zone
These zones represent relative value within the current price range.
The concept is based on a fundamental market principle:
👉 Buy low and sell high
- The discount zone represents relatively lower prices within the range, where buying opportunities are typically favored
- The premium zone represents relatively higher prices, where selling opportunities are typically favored
This aligns with the idea of trading near support and resistance, but instead of fixed levels, it uses a dynamic range based on current structure.
In this indicator, the range is calculated using swing highs and lows, making premium and discount adaptive to current market conditions rather than static.
📌 Concepts – Optimal Trade Entry (OTE)
The Optimal Trade Entry (OTE) is a refined area within the premium or discount zones, typically defined between the 62% and 79% retracement of the swing range.
- In an uptrend → OTE is located in the discount zone (buy area)
- In a downtrend → OTE is located in the premium zone (sell area)
OTE is considered “optimal” because it offers a more favorable risk-to-reward ratio:
- Entries are taken at deeper retracements
- Stop-loss can be placed beyond the swing point
- Targets remain aligned with trend continuation
This allows traders to:
- Risk less relative to potential reward
- Enter closer to areas where institutions are likely re-engaging
📌 Why OTE Matters
Markets often retrace before continuing a trend, and not all retracements offer the same quality of entry.
OTE focuses on deeper pullbacks where:
- Liquidity has often been taken
- Imbalances (FVG, OB) may be present
- Price is positioned at a more favorable value
This increases the probability of:
- Better entries
- Tighter risk control
- Higher reward potential
📌 Practical Interpretation
- In an uptrend → look for buys in discount, especially within OTE
- In a downtrend → look for sells in premium, especially within OTE
- Combine OTE with structure (BOS/CHoCH), liquidity sweeps, and imbalances for higher-probability setups
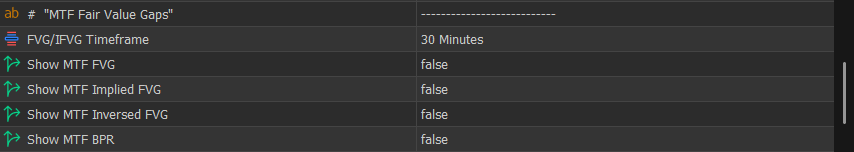
⏱ Multi-Timeframe (MTF)
FVG/IFVG Timeframe – Defines higher timeframe for imbalance detection.
Show MTF FVG – Enables higher timeframe FVG display.
Show MTF Implied FVG – Enables higher timeframe implied gaps.
Show MTF Inversed FVG – Enables higher timeframe inverse gaps.
Show MTF BPR – Enables higher timeframe BPR.
📌 Concepts – Multi-Timeframe Alignment
Higher timeframe defines bias, while lower timeframe provides entries, and aligning both improves trade quality.
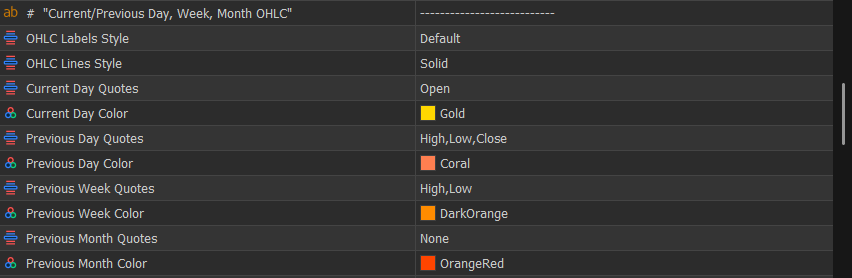
📊 Higher Timeframe OHLC
Current Day / Previous Day / Week / Month Quotes – Displays key reference levels used as support, resistance, and liquidity targets.
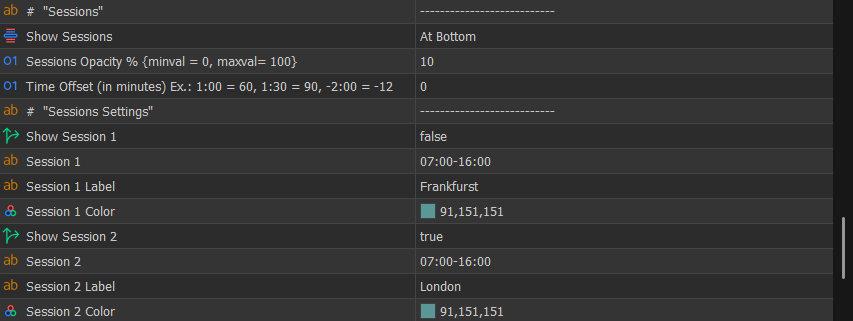
🕒 Sessions
Show Sessions – Displays trading sessions as boxes around the candles or in a timeline style at the bottom of the chart, allowing visualization of when specific market intervals occur.
Time Offset – Adjusts session time to match your broker time. Use this parameter to shift all sessions simultaneously instead of modifying each session individually.
In the Market Structure Patterns indicator, you can define up to 12 custom time intervals. By default, these are configured to represent major forex sessions, silver bullet ranges, and kill zones.
📌 Concepts – Forex Sessions
The forex market operates 24 hours a day and is divided into multiple trading sessions, each with distinct characteristics.
In this indicator, sessions are separated into the following key intervals:
- Sydney
- Tokyo (Asian session)
- Frankfurt (pre-London session)
- London (European session)
- New York (American session)
Each session contributes differently to market behavior:
- Sydney → low volatility, transition from previous trading day
- Tokyo → generally consolidative, often builds liquidity
- Frankfurt → early European activity, frequently sets up liquidity before London
- London → high volatility, strong directional moves and frequent structure breaks
- New York → continuation or reversal, often with high liquidity and major moves
💡 Note:
London and New York sessions are typically the most relevant for active trading due to their higher liquidity and volatility.
Frankfurt is often overlooked or grouped with London, but it plays an important role as a pre-London session, where liquidity is often built or partially taken before the main London move.
📌 Concepts – Kill Zones
Kill zones are specific time windows within trading sessions where liquidity and volatility are expected to increase significantly.
They are commonly associated with:
- Session opens
- Session overlaps (e.g., London–New York overlap)
During these periods:
- Liquidity enters the market
- Stop orders are more likely to be triggered
- Impulsive moves and structure shifts (BOS/CHoCH) occur more frequently
💡 Practical use:
- Focus trading activity during kill zones
- Avoid low-volatility periods where price is less predictable
📌 Concepts – Silver Bullet
The Silver Bullet refers to a specific intraday time window (commonly within the New York session) where high-probability setups are expected to occur.
This concept is based on the idea that:
- Liquidity has already been built earlier in the day
- Price moves into key levels (liquidity, FVG, OB)
- A precise entry opportunity forms within a short time window
The strategy typically combines:
- Liquidity sweep
- Entry within an imbalance (FVG / OB)
- Alignment with overall structure
💡 Practical use:
- Focus on precise entries within defined time windows
- Combine with premium/discount and liquidity concepts for higher probability
📌 Why Sessions Matter
Market behavior changes depending on time of day because participation changes.
Sessions and time-based intervals help answer:
👉 When is the market most likely to move?
By combining sessions with:
- Structure (BOS/CHoCH)
- Liquidity (BSL/SSL)
- Imbalances (FVG, OB)
…traders can improve both timing and trade selection.
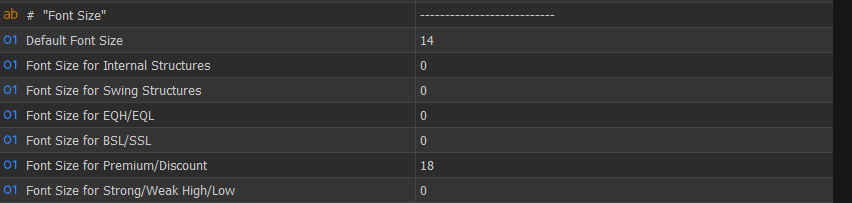
🔤 Font Size
Defines label sizes for different elements, allowing customization without affecting logic.
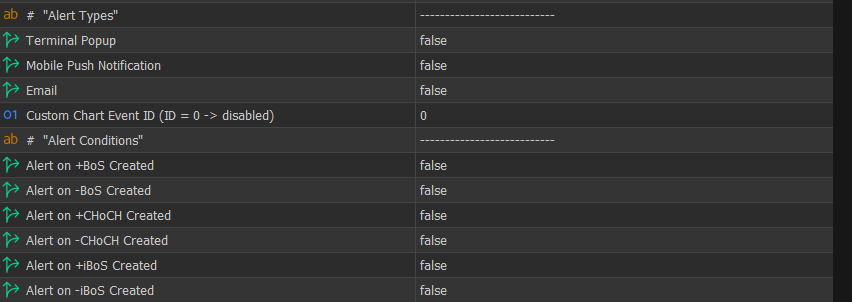
🔔 Alerts
Terminal Popup / Push / Email – Defines how alerts are delivered.
Alert Conditions – Allows enabling alerts for structure, liquidity, imbalances, and interactions.
📩 Support & Additional Information
If you have any questions about the indicator or if any concept in this document is not clear, feel free to get in touch. Feedback and questions are always welcome and help improve both the tool and its documentation.
You can also refer to the product pages for additional details, updates, and user feedback:
⬇️ Market Structure Patterns (MT5): https://mql5.com/8cicg
⬇️ Market Structure Patterns (MT4): https://mql5.com/8chj4


