
Smart Liquidity Matrix: Non-Repainting ICT Order Blocks & FVG Indicator for MT4/MT5

Introduction
Smart Money Concepts have transformed how retail traders interpret price action. The theory behind ICT (Inner Circle Trader) methodology -- that institutional order flow leaves structural fingerprints in price data -- is well-established. Order blocks mark the zones where large players accumulated or distributed positions. Fair value gaps reveal imbalances left by aggressive institutional moves. Break of structure and change of character events signal shifts in the balance between buyers and sellers. These are powerful tools when applied correctly.
The problem is that applying them correctly is slow, subjective, and inconsistent. Identifying a valid order block requires locating the last opposing candle before a structural move, determining whether the zone is still active, and monitoring it for invalidation as new bars form. Fair value gaps must be measured across three bars and tracked until price returns to fill them. Market structure analysis requires maintaining a mental model of swing highs, swing lows, locked structural levels, and trend direction -- all of which update continuously as new pivots form. Doing this manually across a single chart is demanding. Doing it across multiple instruments and timeframes is practically impossible without automation.
Smart Liquidity Matrix automates the entire process. It detects swing pivots, constructs order blocks at those pivots, identifies fair value gaps, tracks market structure breaks and changes of character, and generates confluence-scored buy and sell signals -- all on confirmed bar closes with zero repainting. The built-in signal engine combines EMA trend alignment, pivot zone retests, and RSI filtering into a single directional signal, while the 9-timeframe scanner provides instant multi-timeframe trend context without switching charts.
Download the indicator:
- MetaTrader 5: Smart Liquidity Matrix MT5
- MetaTrader 4: Smart Liquidity Matrix MT4
The non-repainting architecture ensures that every arrow, every order block, every structure label, and every signal printed on the chart is permanent. Conditions are evaluated only on closed bars. The indicator never modifies or removes historical markers. What you see on the chart in backtesting is exactly what would have appeared in real time.
This article explains the theory behind each Smart Money component, walks through the indicator's detection logic, and provides a complete reference for configuring the system across different markets and timeframes.
What Are Smart Money Concepts (ICT)
The financial markets are not a level playing field. Institutional participants -- banks, hedge funds, central bank desks, and large asset managers -- control the majority of daily volume in Forex, equities, and commodities. When these participants need to build or unwind large positions, they cannot do so in a single transaction without moving the market against themselves. Instead, they accumulate positions in stages, using specific price zones and structural patterns that leave identifiable traces in the chart.
Smart Money Concepts, often associated with the ICT methodology, is a framework for reading these institutional traces. The core premise is straightforward: retail traders lose not because they lack technical knowledge, but because they trade against the flow of institutional capital without realizing it. A retail trader sees a support level and buys; an institution sees a pool of retail stop losses below that support and sweeps it to fill a large sell order at a better price. A retail trader sees a breakout and chases; an institution sees a fair value gap that will be revisited before price continues.
The ICT framework identifies several key structural components that reveal institutional intent:
Order Blocks are the price zones where institutions placed their orders before a significant directional move. They are identified as the last opposing candle before a sharp move -- the last bearish candle before a bullish impulse (bullish order block) or the last bullish candle before a bearish impulse (bearish order block). When price returns to an order block, institutional orders that were not fully filled on the initial visit may still be present, creating a reaction zone.
Fair Value Gaps (FVGs) are three-bar patterns where the wicks of the first and third bars do not overlap, leaving an untraded price gap. These gaps represent aggressive institutional moves where demand or supply was so one-sided that normal two-way trading did not occur. Price tends to return to fill these gaps before continuing in the original direction.
Market Structure tracks the sequence of swing highs and swing lows to determine whether price is in an uptrend (higher highs and higher lows) or a downtrend (lower highs and lower lows). A Break of Structure (BoS) occurs when price continues the existing trend by breaking the most recent structural level. A Change of Character (CHoCH) occurs when price breaks structure in the opposite direction, signaling a potential trend reversal.
Liquidity pools form at equal highs, equal lows, and previous period levels where stop orders cluster. Institutions target these pools to fill large orders, creating sweep patterns where price briefly exceeds a level before reversing.
Understanding these components individually is valuable. Combining them into a single, automated analytical framework is where Smart Liquidity Matrix provides its primary advantage.
Order Blocks Explained
An order block is the footprint of institutional order placement. When a large participant needs to buy a significant position, it cannot execute at a single price without causing slippage. Instead, it places limit orders across a price zone and waits for sellers to fill those orders over multiple bars. The last bearish candle before price moves sharply upward is the bullish order block -- it represents the zone where the institution was absorbing sell orders before the move.
The mirror applies to bearish order blocks. The last bullish candle before a sharp downward move is the bearish order block, marking the zone where the institution was absorbing buy orders before selling pressure overwhelmed the market.
Smart Liquidity Matrix identifies order blocks at confirmed pivot points. When a new pivot low is detected (a swing low with SwingLen bars of confirmation on each side), the indicator scans backward up to OBScanBars candles from the pivot to find the first bearish candle. The high and low of that candle define the bullish order block zone. If no bearish candle is found within the scan range, the pivot bar itself becomes the order block.
The same process applies in reverse for bearish order blocks at pivot highs. The indicator scans for the first bullish candle near the pivot high, and the high and low of that candle define the bearish order block zone.
Order blocks are drawn as rectangular zones on the chart and extend forward from their creation point to the current bar. The number of active order blocks displayed is configurable: ShowBullOB controls bullish blocks (default: 3) and ShowBearOB controls bearish blocks (default: 3). When the maximum is reached, the oldest order block is removed to keep the chart readable.
The indicator includes automatic invalidation logic. A bullish order block is invalidated when a confirmed bar closes below its bottom boundary -- this indicates that the institutional orders in that zone have been fully absorbed or that the thesis was incorrect. Similarly, a bearish order block is invalidated when a bar closes above its top boundary. Invalidated blocks are grayed out and removed from the active count, ensuring that only zones with a valid institutional thesis remain on the chart.
This pivot-anchored approach differs from simpler order block implementations that scan for any opposing candle before a move. By requiring a confirmed swing pivot, Smart Liquidity Matrix ensures that order blocks are placed at genuine structural turning points rather than at minor intra-swing fluctuations.
Fair Value Gaps (FVGs)
A Fair Value Gap is a three-bar price pattern where the wicks of bar one and bar three do not overlap, creating a gap in the price range where no two-way trading occurred. This gap represents an imbalance -- one side of the market (buyers or sellers) was so dominant during bar two that the normal process of price discovery was bypassed.
A bullish FVG forms when the low of the current bar is higher than the high of two bars ago. The gap zone extends from the high of the older bar to the low of the newer bar. This pattern typically appears during strong upward impulse moves and represents a zone where buying pressure was overwhelming.
A bearish FVG forms when the high of the current bar is lower than the low of two bars ago. The gap zone extends from the low of the older bar to the high of the newer bar. This pattern appears during strong downward moves and represents a zone of overwhelming selling pressure.
Smart Liquidity Matrix detects FVGs on every confirmed bar and draws them as dashed rectangular zones on the chart. Like order blocks, the number of active FVGs is capped by the input parameters ShowBullFVG and ShowBearFVG (default: 3 each), and excess FVGs cause the oldest to be removed.
The significance of FVGs lies in the market's tendency to revisit them. Institutional traders often use FVGs as entry points: when price returns to fill a bullish FVG (retracing into the gap zone), it represents an opportunity to enter long in the direction of the original impulse. The indicator tracks FVG mitigation automatically. A bullish FVG is invalidated when a bar closes below its bottom boundary, and a bearish FVG is invalidated when a bar closes above its top boundary. Invalidated FVGs are grayed out and removed.
FVGs are particularly powerful when they overlap with order blocks. When a bullish FVG sits inside or near a bullish order block, the confluence of two institutional footprints at the same price zone significantly increases the probability of a reaction. The dashboard's Confluence Map section displays the count of active bullish and bearish FVGs alongside order blocks, allowing traders to assess the density of institutional footprints at a glance.
Market Structure: BoS and CHoCH
Market structure is the foundation of all trend analysis. At its simplest, a market in an uptrend produces a sequence of higher highs and higher lows. A market in a downtrend produces lower highs and lower lows. The transitions between these states -- and the specific events that trigger them -- carry significant information about institutional intent.
Smart Liquidity Matrix tracks market structure through a swing detection engine that uses alternating pivot highs and pivot lows with configurable confirmation ( SwingLen , default: 5). When a new pivot high is confirmed, the indicator locks the current swing low as the structural low. When a new pivot low is confirmed, the current swing high is locked as the structural high. This alternating pivot approach (zigzag-style) ensures that structural levels are always meaningful swing points rather than arbitrary price markers.
A Break of Structure (BoS) occurs when price continues the existing trend by breaking the most recent structural level. In an uptrend, a bullish BoS happens when a confirmed bar closes above the locked structural high. This confirms that the trend is intact and buyers are maintaining control. In a downtrend, a bearish BoS happens when a bar closes below the locked structural low.
A Change of Character (CHoCH) is the more significant event. It occurs when price breaks structure in the direction opposite to the prevailing trend. If the market has been trending down (g_trendDir == -1) and a bar closes above the locked structural high, this is classified as a bullish CHoCH rather than a BoS. The distinction is critical: a BoS is a trend continuation signal, while a CHoCH is a potential trend reversal signal.
The indicator draws each structural break as a dashed horizontal line from the structural level's origin time to the break bar, with a text label ("BoS" or "CHoCH") placed at the midpoint. BoS lines use the BosColor (default: Royal Blue) and CHoCH lines use the ChochColor (default: Orange Red), providing immediate visual distinction between trend continuation and trend reversal events.
The MaxStructLines parameter (default: 5) controls how many structure lines remain visible on the chart. As new breaks occur, the oldest lines are automatically cleaned up to prevent visual clutter.
The internal trend direction variable ( g_trendDir ) is updated with every structural break and drives the Trend Analysis section of the dashboard. A value of 1 indicates a bullish market structure, -1 indicates bearish, and 0 indicates no established trend. This variable is also used by the dashboard to display whether the chart trend is "BULLISH," "BEARISH," or "NEUTRAL."
The Signal Engine Architecture
Smart Liquidity Matrix does not rely on a single indicator or a simple crossover for its signals. The signal engine is a multi-condition system that combines trend alignment, pivot zone retests, momentum filtering, and one-trade-at-a-time position management into a coherent directional signal.
The engine operates as a stateful finite state machine with three states: flat (no position), long (buy active), and short (sell active). It transitions between states based on entry and exit conditions evaluated on confirmed bars only.
Trend Direction: EMA 20/50 Crossover. The foundation of every signal is the relationship between the 20-period and 50-period Exponential Moving Averages. Buy entries are permitted only when EMA 20 is above EMA 50, confirming that the short-term trend supports long positions. Sell entries are permitted only when EMA 20 is below EMA 50. This single condition eliminates the majority of counter-trend signals that would otherwise produce losses.
Pivot Zone Retest. Rather than entering on the crossover itself, the engine waits for price to retest a recent pivot zone. For buy signals, the bar's low must be within 0.3 ATR of the most recent pivot low, and the close must be above that pivot low. This means the engine is looking for pullbacks to structural support that hold -- not breakouts into thin air. For sell signals, the bar's high must be within 0.3 ATR of the most recent pivot high, and the close must be below it. This retest requirement significantly improves signal quality by entering at zones where institutional orders are likely to be clustered.
Candlestick Confirmation. Buy signals require a bullish candle (close > open) and sell signals require a bearish candle (close < open). This ensures that the bar itself confirms the expected direction rather than signaling during indecision.
RSI Filter. The 14-period RSI must be below 70 for buy signals and above 30 for sell signals. This boundary filter prevents entries at momentum extremes where reversals are statistically more likely. Unlike systems that require RSI to be in a specific zone, this filter only blocks signals at the extremes, allowing entries across the full mid-range of RSI values.
One-Trade-at-a-Time. The engine enforces a strict one-trade-at-a-time rule. When a buy signal fires, the engine enters the long state and sets internal stop loss and take profit levels. No new signal can fire until the current trade closes via SL hit, TP hit, or EMA crossover reversal. This prevents signal clustering during choppy conditions and ensures that each signal has a clean, measurable outcome.
Exit Conditions. An active long trade closes when the low touches the stop loss, the high touches the take profit, or EMA 20 crosses below EMA 50. An active short trade closes under the symmetric conditions. When a trade closes, the engine returns to the flat state and is ready for the next signal.
The signal engine runs independently from the Smart Money visual components (order blocks, FVGs, structure lines). The visual components provide context and the signal engine provides actionable entries. Traders who prefer discretionary entries can disable signals entirely ( EnableSignals = false ) and use the Smart Money components as pure analytical tools.
Auto Entry, Stop Loss, and Take Profit
Every signal generated by Smart Liquidity Matrix includes automatically calculated stop loss and take profit levels. These levels are derived from the structural context of the signal rather than from a fixed pip distance, making them adaptive to the current market volatility and structure.
Stop Loss Placement. For buy signals, the stop loss is placed below the most recent pivot low (the structural support that the signal is retesting). The exact distance is the pivot low price minus SLPadding times the 14-period ATR (default: 0.2 ATR). This padding ensures the stop is not placed exactly at the pivot, where it would be vulnerable to the same sweep behavior that the indicator detects elsewhere. If no valid pivot low is available, or if the pivot low is above the entry price (which would create an invalid stop), the indicator falls back to a default distance of 1.5 ATR below entry.
For sell signals, the stop loss is placed above the most recent pivot high plus the ATR padding. The same fallback logic applies if the pivot high is below the entry price.
An additional safety measure caps the maximum stop loss distance at 2.0 ATR from entry. This prevents excessively wide stops on instruments where the nearest structural level is far from the current price. The cap ensures consistent risk sizing regardless of the distance to the pivot.
Take Profit Levels. Two take profit levels are calculated using fixed risk-reward ratios relative to the stop loss distance:
-
TP1 at 1:1 risk-reward -- the take profit distance equals the stop loss distance. TP1 represents the breakeven target: if a trader closes half the position at TP1 and moves the stop to entry, the trade becomes risk-free.
-
TP2 at 1:R risk-reward, where R is the configurable RRRatio (default: 2.0) -- the take profit is RRRatio times the stop loss distance. With the default setting, TP2 is at 1:2 risk-reward, meaning the potential reward is twice the risk.
The stop loss, TP1, and TP2 are drawn on the chart as horizontal lines extending forward from the signal bar. The entry price is drawn as a solid white line, the stop loss as a dashed red line, and both take profits as dashed green lines. Labels at the right edge of each line display the price level.
When a trade is active, the dashboard displays the entry price, stop loss, TP1, TP2, and a live percentage P&L calculated from the current price relative to entry.
The 9-Timeframe Signal Scanner
One of the most common questions traders face is whether the signal on their chart aligns with the broader trend across other timeframes. A buy signal on the M15 chart is more convincing if the H1, H4, and D1 are also bullish. Conversely, a buy signal that contradicts the higher timeframe trend carries additional risk.
Smart Liquidity Matrix includes a built-in 9-timeframe scanner that evaluates trend direction across all standard MetaTrader timeframes: M1, M5, M15, M30, H1, H4, D1, W1, and MN. The scanner does not require the indicator to be loaded on multiple charts -- it reads data from all timeframes using cross-timeframe indicator calls ( iMA ) within a single chart instance.
The trend determination for each timeframe uses the same EMA 20/50 relationship that drives the chart signal engine. When EMA 20 is above EMA 50 on a given timeframe, that timeframe is classified as "BUY" (bullish). When EMA 20 is below EMA 50, the timeframe is classified as "SELL" (bearish). If data is insufficient or the EMAs are equal, the timeframe shows "--" (neutral).
The scanner is displayed in the Signal Scanner section of the dashboard as a 3x3 grid:
- Row 1: M1, M5, M15
- Row 2: M30, H1, H4
- Row 3: D1, W1, MN
Each cell shows the timeframe name followed by "BUY" in green or "SELL" in red. At a glance, traders can see whether the majority of timeframes agree on direction. A chart dominated by green indicates broad bullish consensus; a chart dominated by red indicates bearish consensus. Mixed signals suggest a transitional or ranging market.
The scanner updates on every tick, so the transition from one trend state to another is visible in real time. Traders can use the scanner as a confirmation layer: take buy signals only when the scanner shows a majority of bullish timeframes, or reduce position size when the scanner is mixed.
The scanner operates independently of the chart's own timeframe. An indicator running on M15 will show M1 through MN scanner results. This eliminates the need to open nine separate charts to assess multi-timeframe alignment.
Premium Dashboard Deep Dive
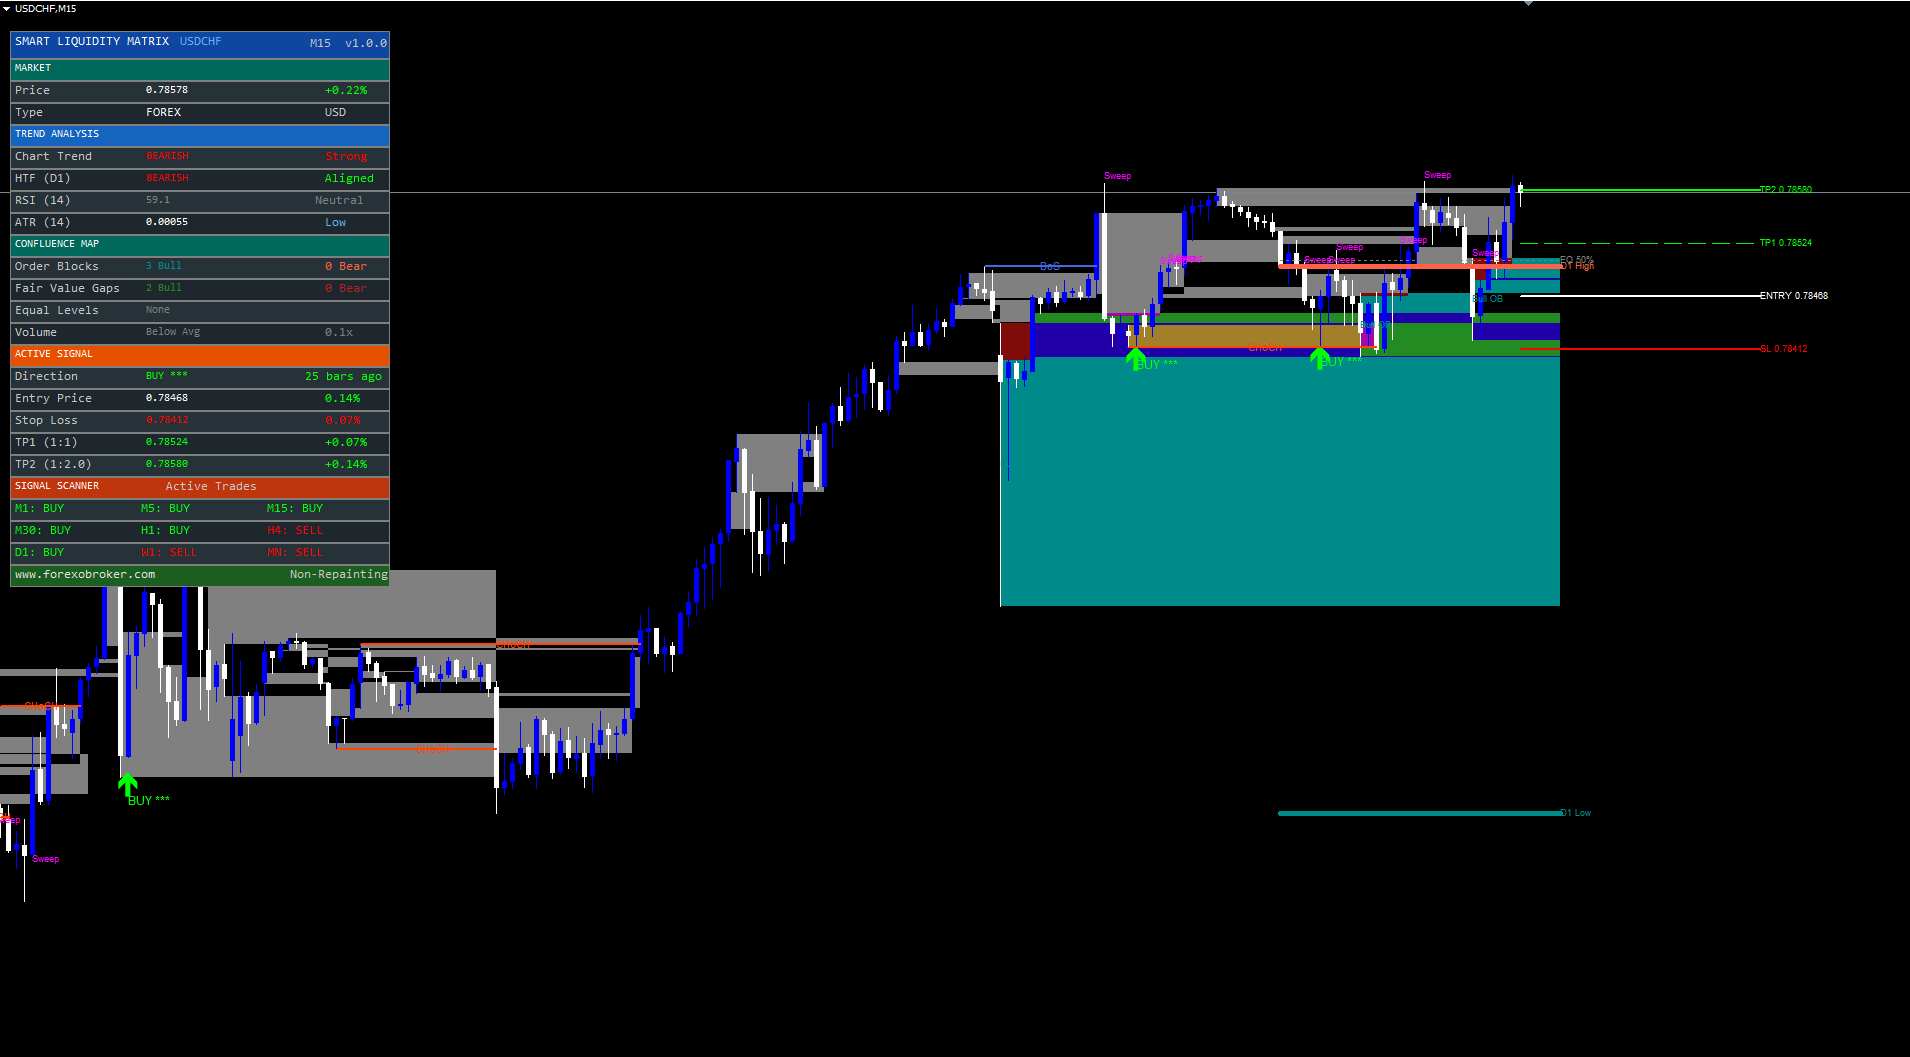
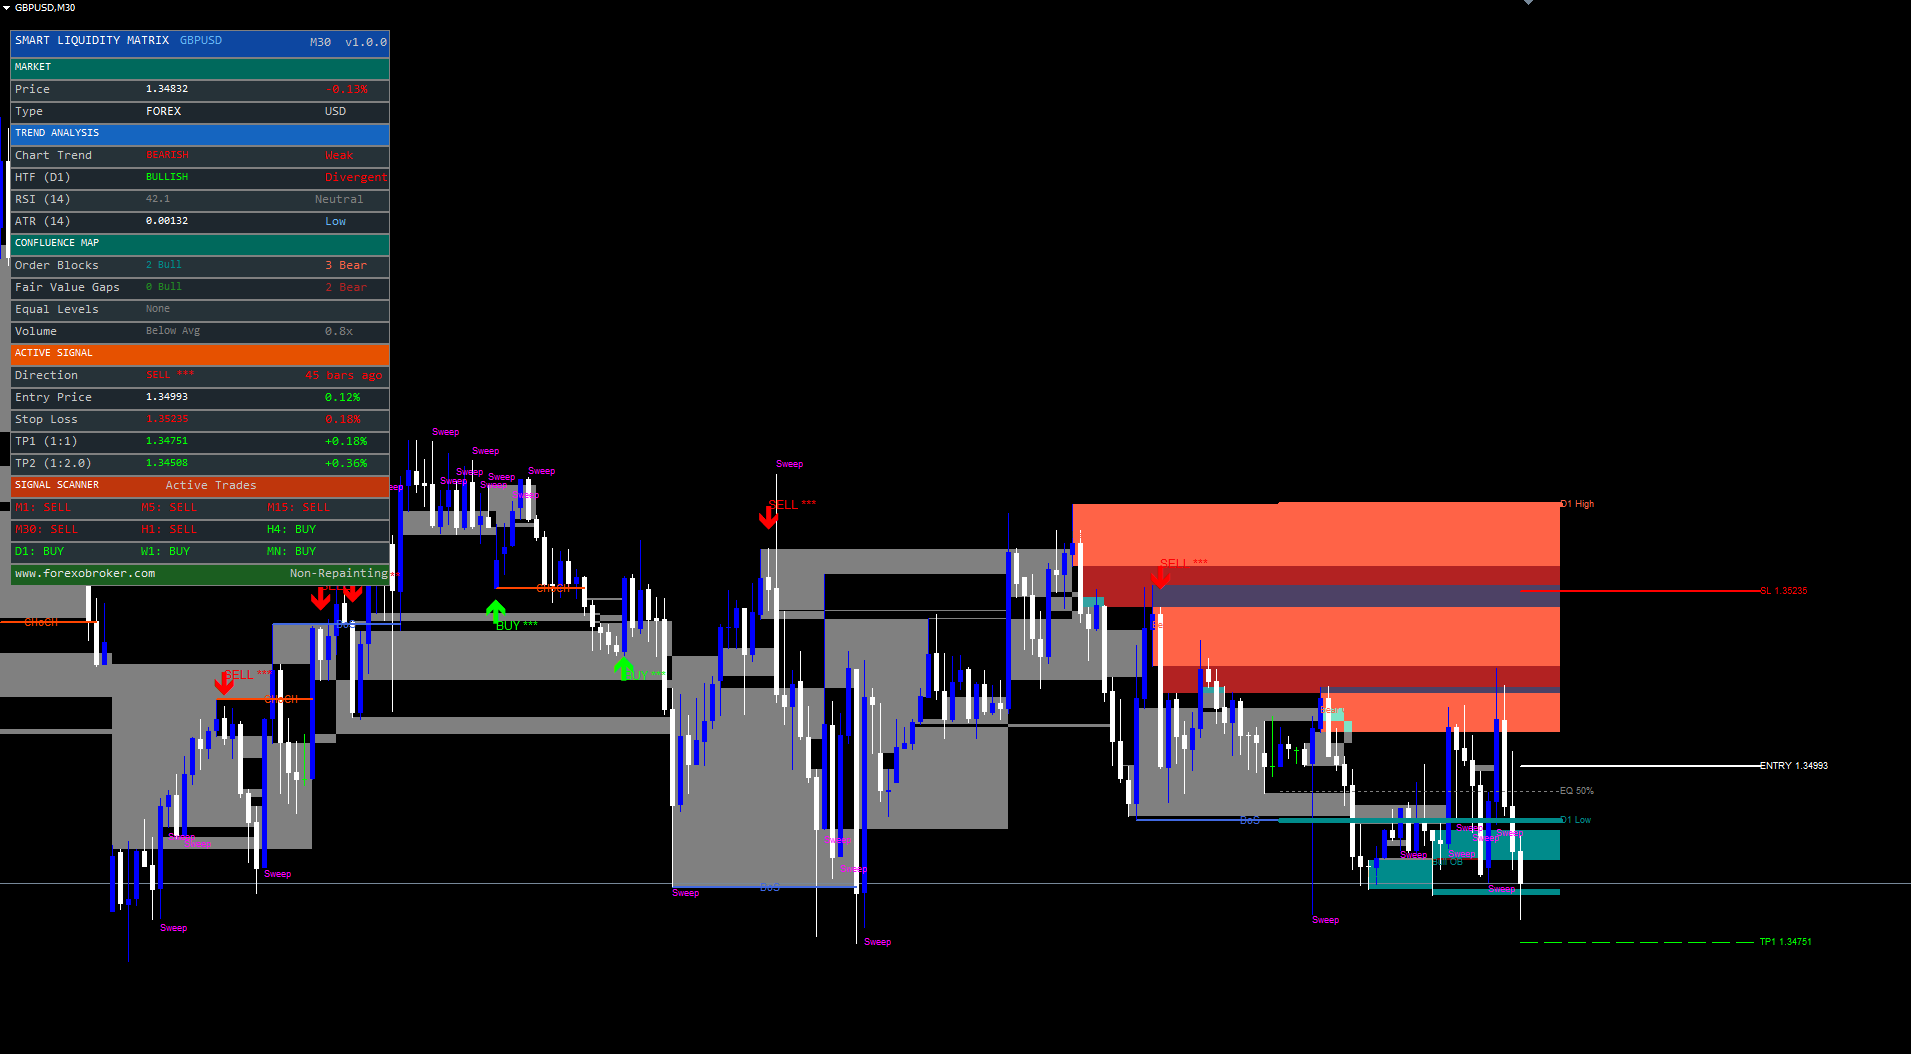
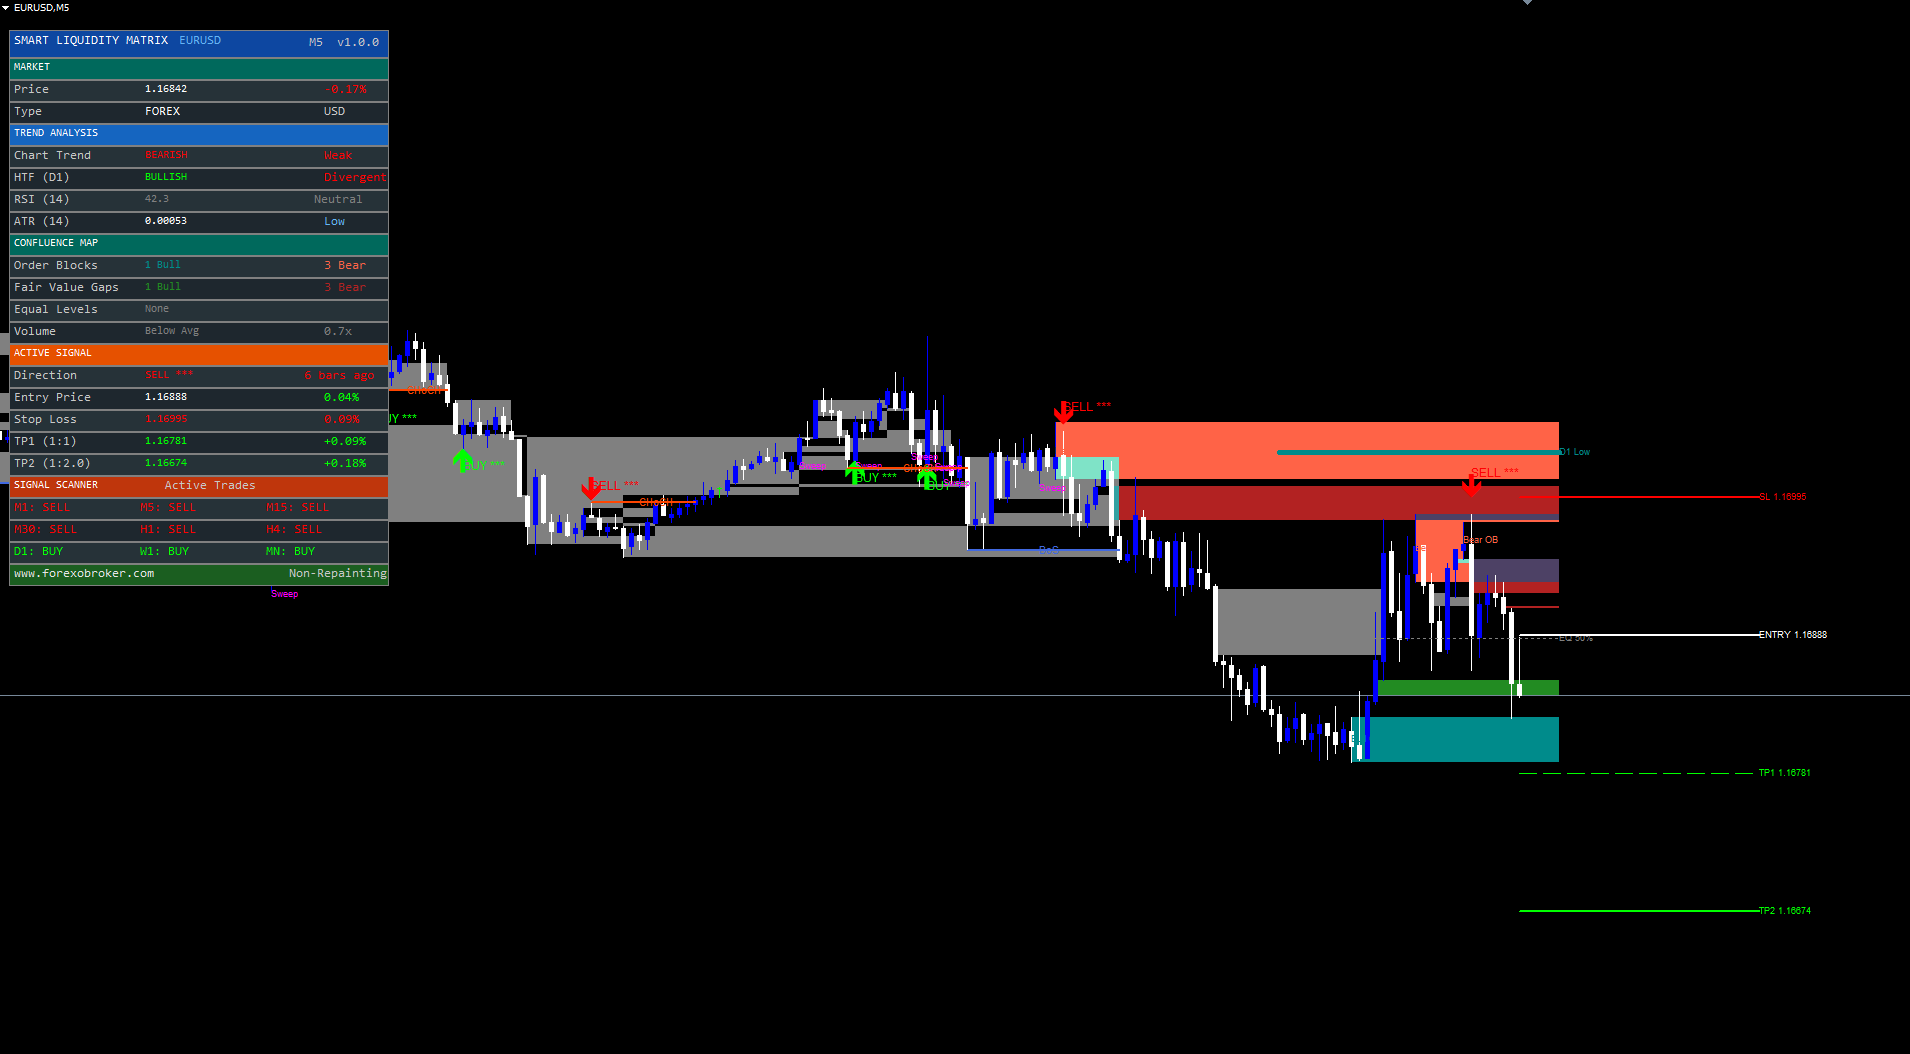
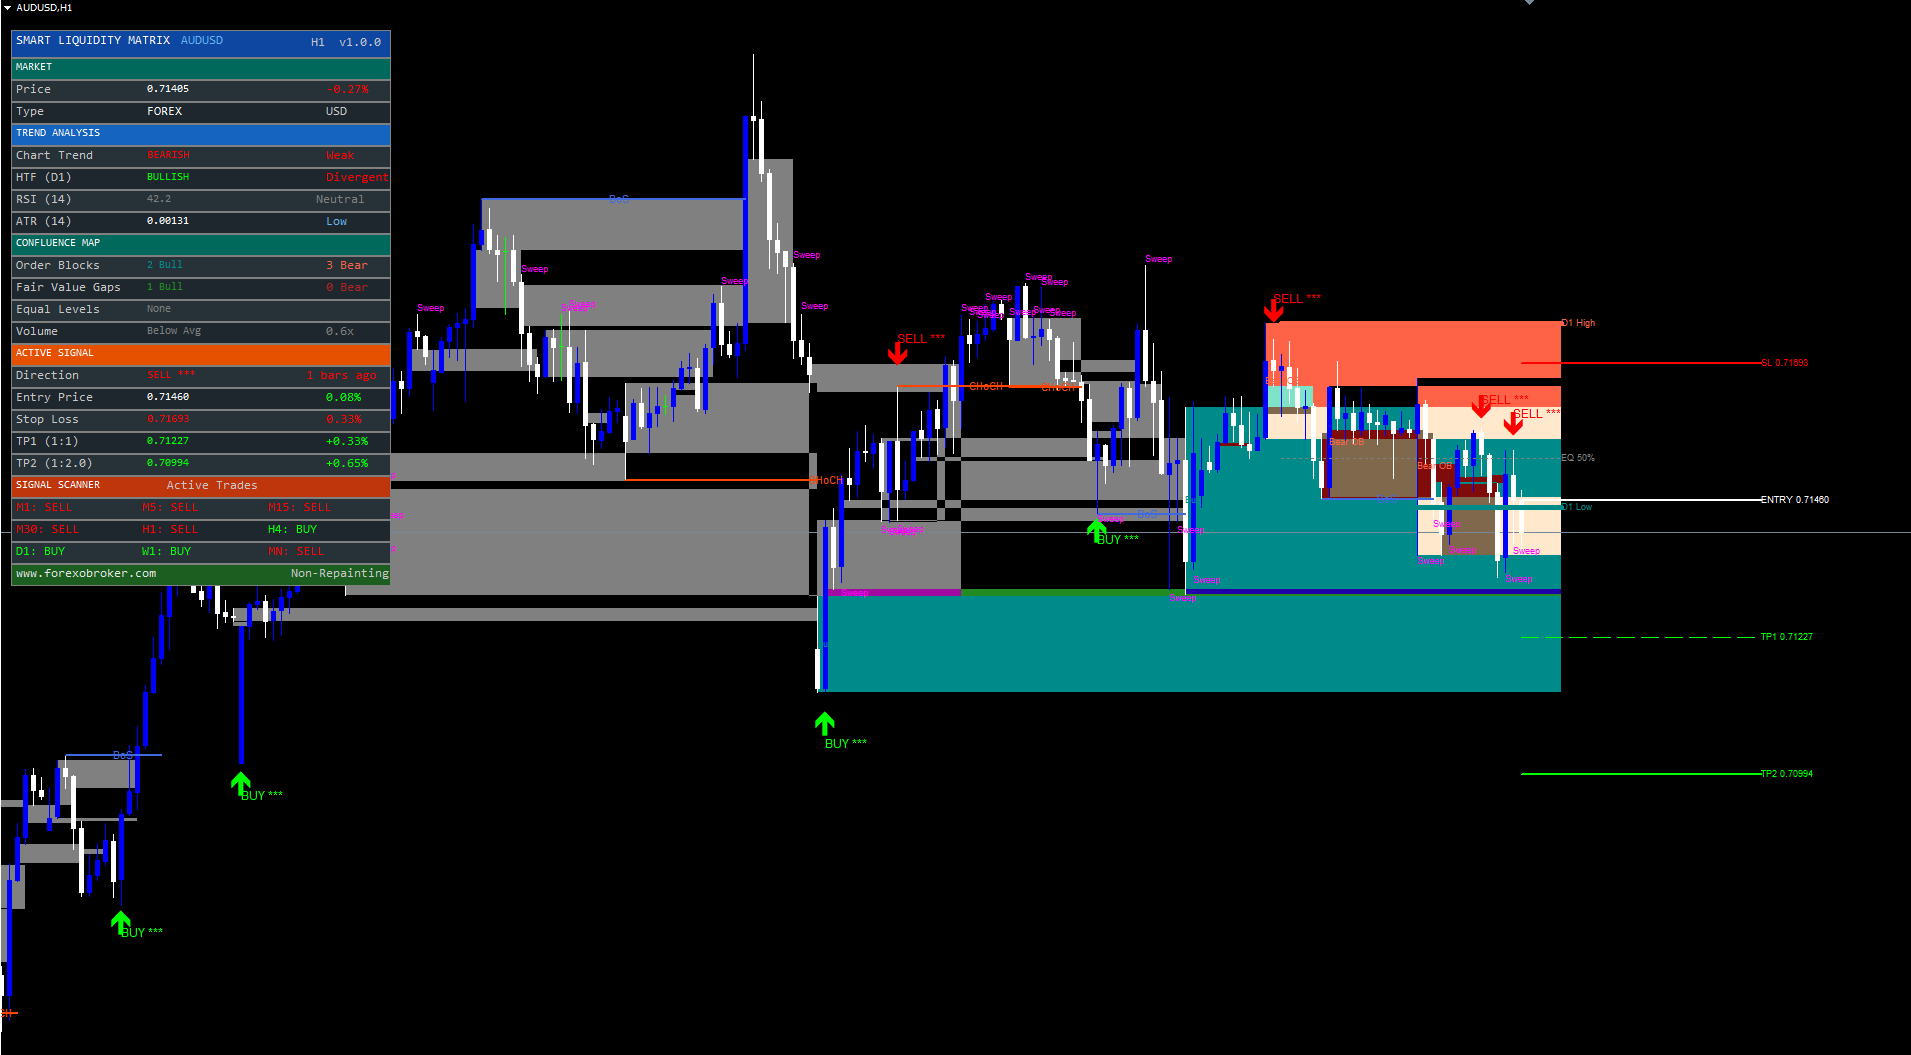
The dashboard is a persistent multi-section panel that consolidates all critical indicator data into a single visual reference. It is organized into five color-coded sections, each providing a distinct category of information.
Section 1: Market. The teal-colored Market section displays the current price with daily change percentage (green for positive, red for negative), the instrument type (Forex, by default), and the account currency. This section provides basic market context without requiring the trader to look at the chart's price scale.
Section 2: Trend Analysis. The blue-colored Trend Analysis section contains four rows. The Chart Trend row shows the market structure direction ("BULLISH," "BEARISH," or "NEUTRAL") derived from the swing detection engine, alongside a strength assessment ("Strong" when EMA 20 > EMA 50, "Weak" when reversed). The HTF Trend row shows the higher timeframe trend based on the configurable HTF EMA filter, with an "Aligned" or "Divergent" label indicating whether the HTF agrees with the chart trend. The RSI row displays the current 14-period RSI value with a zone label ("Overbought," "Oversold," "Bullish," "Bearish," or "Neutral"). The ATR row shows the current 14-period ATR value and a volatility classification ("HIGH," "Normal," or "Low") based on ATR as a percentage of price.
Section 3: Confluence Map. The teal-colored Confluence Map section provides a structural snapshot. It shows the count of active bullish and bearish order blocks, the count of active bullish and bearish fair value gaps, the presence of equal highs/lows (with a "Liquidity" tag when detected), and the current volume status relative to its 20-bar average ("HIGH," "Above Avg," or "Below Avg" with the multiplier ratio).
Section 4: Active Signal. The orange-colored Active Signal section displays the trade state. The Direction row shows "BUY" (green), "SELL" (red), or "WAITING" (gray), alongside the star rating and bars-since-signal count. The Entry Price row displays the signal's entry price with a live P&L percentage calculated from the current price. The Stop Loss row shows the SL price in red with its distance as a percentage of entry. TP1 and TP2 rows show their respective prices in green with percentage gain labels. When no trade is active, all values display "--".
Section 5: Signal Scanner. The deep-red-colored Signal Scanner section contains the 9-timeframe grid described in the previous section. Each timeframe cell displays "BUY" or "SELL" in the corresponding color.
The dashboard footer displays the Forexobroker website URL and a "Non-Repainting" label, confirming the indicator's signal integrity.
The dashboard position is configurable through the DashPosition input, which offers six placement options: Top Right, Top Left, Bottom Right, Bottom Left, Middle Right, and Middle Left. All dashboard objects use absolute pixel coordinates computed from the chart dimensions and are anchored to CORNER_LEFT_UPPER internally, which prevents the common MetaTrader issue where objects placed at other corner anchors extend off-screen. The dashboard repositions automatically when the chart is resized, handled by the OnChartEvent function.
Equal Highs/Lows and Liquidity Sweeps
Equal highs and equal lows are among the most targeted patterns in Smart Money trading. When two consecutive swing highs form at nearly the same price, the horizontal cluster of stop orders above those highs creates a liquidity pool that institutional traders find attractive. The same logic applies to equal lows, where stop orders cluster below.
Smart Liquidity Matrix detects equal highs when the two most recent swing highs are within 0.1 ATR of each other. Equal lows are detected when the two most recent swing lows meet the same tolerance. When detected, the indicator draws a horizontal line at the average of the two levels, extending forward from the older pivot to the right edge of the chart. The label "EQH" marks equal highs and "EQL" marks equal lows.
The detection uses the configurable EqHighColor (default: Tomato) and EqLowColor (default: Dark Cyan) for visual distinction. In standard mode, a second thicker line is drawn behind the dotted line for visibility; in Lite Mode, only the dotted line appears.
Liquidity Sweeps occur when price briefly exceeds an equal level (or a previous period high/low) but closes back on the original side. An upside sweep happens when the bar's high exceeds the level but the close is below it. A downside sweep is the mirror: the low dips below the level but the close is above it. These sweep events are critical because they often precede reversals -- the institution has now collected the liquidity it needed and is ready to move price in the opposite direction.
When a sweep is detected, the indicator places a "Sweep" text label at the sweep point in the configurable LiqSweepColor (default: Magenta). If the sweep occurs on a live bar (not during history scan), an alert fires to notify the trader immediately.
The combination of equal levels and sweep detection provides actionable intelligence: equal highs/lows identify where liquidity pools are forming, and sweeps identify when those pools have been collected. A buy signal that fires after a downside sweep of equal lows, with an active bullish order block at the same zone, represents a high-confidence institutional entry scenario.
Alert System and Webhook Integration
Smart Liquidity Matrix supports 11 distinct alert conditions, each covering a significant event in the indicator's lifecycle:
- Buy Signal -- fires when a new buy entry is generated by the confluence engine
- Sell Signal -- fires when a new sell entry is generated
- Bullish BoS -- fires when a bullish Break of Structure occurs
- Bearish BoS -- fires when a bearish Break of Structure occurs
- Bullish CHoCH -- fires when a bullish Change of Character occurs
- Bearish CHoCH -- fires when a bearish Change of Character occurs
- Upside Liquidity Sweep -- fires when price sweeps above an equal high or previous period high
- Downside Liquidity Sweep -- fires when price sweeps below an equal low or previous period low
- TP1 Hit -- fires when price reaches the first take profit
- TP2 Hit -- fires when price reaches the second take profit
- SL Hit -- fires when the stop loss is reached
Three delivery channels are available:
| Channel | Default | Parameter |
|---|---|---|
| Popup + Sound (on-screen dialog) | Enabled | EnableAlerts = true |
| Push notification (mobile) | Enabled | EnablePush = true |
| Disabled | EnableEmail = false |
Alert messages include the symbol, timeframe, and relevant price information. Buy and sell signal alerts include the confluence score and entry price. Structure break alerts specify the break type (BoS or CHoCH). Sweep alerts identify the direction (upside or downside).
For traders who use third-party execution platforms or notification systems, the alert messages follow a structured format that can be parsed by webhook receivers. A typical buy signal alert reads:
Smart Liquidity Matrix: BUY signal on EURUSD H1 | Score: 3/5 | Price: 1.08542
This format can be consumed by platforms like TradingConnector, MetaAPI, or custom webhook endpoints to trigger automated order placement or notification routing.
All alerts fire only on live bars (not during historical calculation) and are guarded by the new-bar detection mechanism, ensuring each alert fires exactly once per event.
Configuration Guide
Smart Liquidity Matrix exposes approximately 35 input parameters organized into eight logical groups. The following sections highlight the key parameters in each group and provide recommended starting configurations.
Market Structure
| Parameter | Default | Description |
|---|---|---|
| SwingLen | 5 | Number of bars on each side for pivot confirmation (2-20) |
| ShowBoS | true | Display Break of Structure lines |
| ShowCHoCH | true | Display Change of Character lines |
| MaxStructLines | 5 | Maximum structure lines on chart (1-20) |
Recommendation: Start with SwingLen = 5 for M15-H1, increase to 8-10 for H4-D1 to capture only major structural pivots.
Order Blocks and FVGs
| Parameter | Default | Description |
|---|---|---|
| ShowBullOB / ShowBearOB | 3 / 3 | Number of active order blocks per side |
| OBScanBars | 5 | How many candles before the pivot to search for the OB candle |
| ShowBullFVG / ShowBearFVG | 3 / 3 | Number of active FVGs per side |
Recommendation: Keep at defaults for most timeframes. Reduce to 2 on M5/M15 if the chart becomes visually busy. Set any value to 0 to disable that component entirely.
Signal Engine
| Parameter | Default | Description |
|---|---|---|
| EnableSignals | true | Master switch for the signal engine |
| MinConfluence | 2 | Minimum confluence score required (2-5) |
| SignalCooldown | 20 | Minimum bars between same-direction signals |
| UseHTF | true | Enable higher timeframe trend filter |
| HTFTF | D1 | Higher timeframe for trend confirmation |
| HTFEmaLen | 50 | EMA period on the higher timeframe |
Recommendation: The default MinConfluence = 2 provides balanced signal frequency. Increase to 3 for a conservative filter. The HTF filter on D1 with EMA 50 provides solid trend alignment for H1/H4 chart signals.
Risk Management
| Parameter | Default | Description |
|---|---|---|
| ShowSLTP | true | Display SL/TP lines on chart |
| RRRatio | 2.0 | Risk-reward ratio for TP2 (1.0-5.0) |
| SLPadding | 0.2 | ATR multiplier for SL padding below/above pivot |
Recommendation: A RRRatio of 2.0 provides a solid asymmetric payoff structure. Increase to 3.0 on trending instruments (GBPJPY, XAUUSD). Reduce to 1.5 for scalping on lower timeframes where extended targets are less likely to be reached.
Visual and Dashboard
| Parameter | Default | Description |
|---|---|---|
| LiteMode | false | Simplified visual mode (thinner lines, fewer elements) |
| ShowDashboard | true | Display the premium dashboard |
| DashPosition | Top Left | Dashboard placement on chart |
Recommendation: Enable LiteMode = true on lower timeframes (M5, M15) where the density of visual elements can obscure price action. The dashboard can be moved to any corner or edge of the chart.
Recommended Timeframe Profiles
Scalping (M5-M15): SwingLen = 3, ShowBullOB/BearOB = 2, SignalCooldown = 10, LiteMode = true, RRRatio = 1.5.
Swing Trading (H1-H4): Use all defaults. SwingLen = 5, ShowBullOB/BearOB = 3, SignalCooldown = 20, RRRatio = 2.0.
Position Trading (D1-W1): SwingLen = 8, ShowBullOB/BearOB = 5, SignalCooldown = 5, RRRatio = 3.0, HTFTF = W1.
Download the indicator:
- MetaTrader 5: Smart Liquidity Matrix MT5
- MetaTrader 4: Smart Liquidity Matrix MT4
Conclusion
Smart Liquidity Matrix automates the most demanding aspects of ICT Smart Money analysis -- order block detection, fair value gap identification, market structure tracking, liquidity sweep detection, and confluence-scored signal generation -- within a single non-repainting indicator. By processing all conditions on confirmed bar closes, the indicator ensures that every element on the chart is permanent and backtestable.
The signal engine's multi-condition architecture (EMA trend, pivot zone retest, candlestick confirmation, RSI filter) produces signals that are structurally grounded rather than based on simple crossovers. The 9-timeframe scanner provides instant multi-timeframe context, and the premium dashboard consolidates market data, trend analysis, confluence counts, active trade information, and scanner results into a single persistent panel.
The indicator is designed for Forex, Crypto, Stocks, Commodities, and Indices across all timeframes. All parameters are fully configurable, allowing the system to be tuned from aggressive scalping setups to conservative position trading configurations.
CONTACT & SUPPORT
- Email: info@forexobroker.com
- Questions: Use the Comments section on the product page or send a private message
- Bug Reports: Please include your broker name, account type, and a screenshot
-
✅ All MQL Tools: https://www.mql5.com/en/users/forexobroker/ ✅
--------------------------------------------------------------------------------------------------------------
🏦 **Broker I use**: https://icmarkets.com/?camp=55869
🏦 **Broker For EU Traders I use 1**: https://www.ictrading.com?camp=91414
🏦 **Broker I use 2**: https://one.exnessonelink.com/boarding/sign-up/a/c_thuv62ocfq
💻 **VPS**: https://chocoping.com/processing/aff.php?aff=738
💼 **Companies I use for getting funded**:
Fundednext: https://fundednext.com/?fpr=kestutis39
The5ers: https://www.the5ers.com/?afmc=16kl
FTMO: https://trader.ftmo.com/?affiliates=nRAyOhmFRnEnFdOpdLeh
Risk Disclaimer. Trading financial instruments carries a high level of risk and may not be suitable for all investors. Past indicator signals do not guarantee future results. The information provided in this article and by the indicator is for educational and informational purposes only and should not be construed as investment advice. No indicator can predict future price movements with certainty, and all trading involves the risk of loss. Always use proper risk management, position sizing appropriate to your account, and never risk more than you can afford to lose. Consult a qualified financial advisor before making trading decisions. Test any new indicator thoroughly on a demo account before applying it to live trading.


")
