

Gold is not a foreign currency. Treating it the same way as the euro/US dollar will result in huge losses.
XAUUSD fluctuates between $30 and $50 per day. It exhibits unique session behavior, sharp rises in ATR, and moments where everything changes in seconds. Most strategies that work for major currency pairs are completely ineffective for gold.
After 12 years of specializing solely in gold trading, I've consistently found one method that makes perfect sense: a moving average touch entry strategy using rigorous filtering.
This article explains the mechanism of "Gold Signal Pro," an indicator I developed for my own trading.
The core idea: Entry is only possible with MA Touch.

Many gold traders lose money because they enter trades at random prices. They chase momentum, panic when buying on dips, and have no idea where to take profits.
The solution is simple: only enter a trade when the price touches the moving average.
Why is this effective? Because moving averages (MAs) act as dynamic support and resistance lines for gold prices. In a trending market, when the price is pushed back down to the moving average, it often rebounds. That rebound is the entry point.
However, not all MA touches are the same. That's where filtering comes in.
Four Master's Programs – Four Application Methods
I use 13, 21, 75, and 100-period Simple Moving Averages (SMAs). Each generates different types of trades.
13MA — Shallow pullback. The price will fall slightly and then fall again. Enter quickly, TP/SL tight. Only valid when all moving averages are aligned in a perfect order.
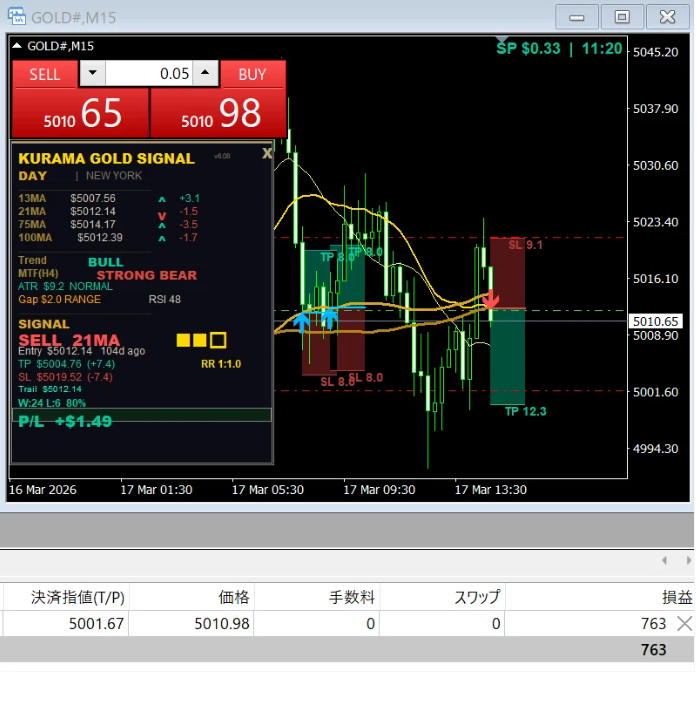
21MA – The absolute basic. A standard pullback in trending markets. The most frequently occurring and most reliable signal type.
75MA — A significant pullback. The price rebounds after a large decline. This pattern offers the potential for wider TP/SL and larger price movements. Often seen near trend reversal zones.
100MA — The biggest pullback. A major support and resistance level. Rare but powerful. Wide TP/SL range.
The key point is that short-term moving averages indicate fast trading speeds but small trading volumes, while long-term moving averages indicate slower trading speeds but large trading volumes. Knowing which moving average triggered your entry allows you to accurately understand what type of trades you are making.
Why most moving average indicators fail
A simple indicator like "touching the moving average = buy/sell" results in too many signals and large losses. The market constantly touches the moving average, but most of that information is useless.
The difference between losing and winning moving average strategies lies in filtering. It's necessary to distinguish between situations where a move average touch is effective and situations where it's simply noise.
Therefore, we created seven independent filters that all signals must pass through before being displayed on the chart.
1. Volatility Check — Is the ATR normal? No signals are generated during sharp rises or stagnation.
2. MA Structure —Are the four MAs properly aligned? If the MAs are not aligned, the trend will become unclear.
3. Trend Direction — Is the slope of the moving average strong enough? Is the price in the correct position?
4. MA Angle — Is the MA horizontal? If the MA is horizontal, it indicates a range-bound market, which can result in an incorrect signal.
5. Higher timeframes —Does the H4 timeframe align with the signal direction?
6. RSI — Is the market overbought or oversold? If so, skip this step.
7. Breakthrough Block — Did the price break through the moving average instead of rebounding? That's a breakout, not a pullback. It's a completely different trade.
If any of the filters fail, no signals will be displayed. No signals mean no trades will be executed. This is the most important feature; it allows you to know when you shouldn't enter a trade.
Dynamic TP/SL (Target Profit Margin / Target Loss Margin) - Not a fixed value
Most indicators use fixed TP/SL, such as "TP of $10 / SL of $5." This is lazy and doesn't work well because the price of gold fluctuates daily.
My method calculates TP and SL for each signal based on the following criteria:
- Which moving average line did it touch? (Short-term moving average = narrow, Long-term moving average = wide)
- Current ATR (High Volatility = Wide Range, Low Volatility = Narrow Range)
- Signal Quality Score
- Whether the signal is part of a continuous movement in the same direction.
In other words, your TP/SL always reflects the current market conditions. Not yesterday's market conditions, or last week's average market conditions, but the conditions right now.
Quality Score — Not all signals have the same value.
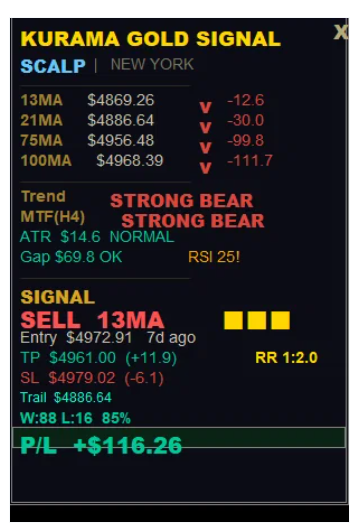
All signals are evaluated automatically.
Three stars – Multiple confirmations match. Strong trend, clear direction, 4-hour chart agreement, and healthy ATR. These are signals to increase position size.
Two stars – Standard condition. A solid setup, but not perfect. Standard size.
1 star – Unstable environment. Some filters are generating conflicting signals. Keep positions small or skip entirely.
This scoring system has significantly changed my trading. Previously, I treated all signals the same, but now I adjust my risk based on the quality of the signals. I give myself more leeway with high-quality signals and set stricter stop-losses or choose not to trade at all with low-quality signals.
Rules that make a difference
After years of testing, we discovered three rules that can eliminate most losing trades.
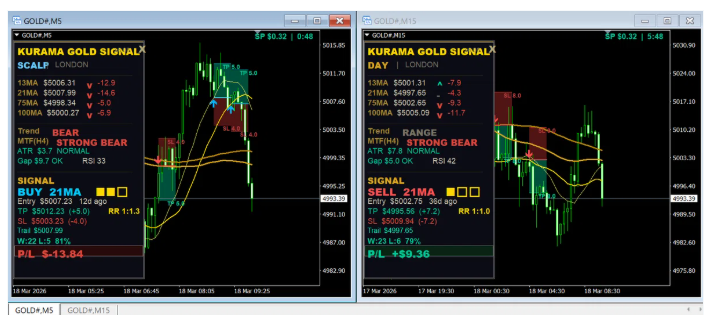
Rule 1: Trade only when the direction of the M15 and M5 signals align. If the M15 is giving a sell signal, ignore all buy signals from the M5. Do not go against the major trend.
Rule 2: Pay attention to 2-star and 3-star signals. Ignore 1-star signals or trade them with the minimum size, as they have a low expected value.
Rule 3: Do not trade when the trend indicates a range-bound market. When moving averages are converging and there is no clear direction, even seemingly good signals tend to fail.
These three rules alone can significantly reduce the number of losing trades.
M5 Scalping vs. M15 Day Trading
M5 Scalp Trading – Rapid entry in trending markets. Tight TP/SL settings. Requires continuous monitoring, but generates more signals.
M15 Day Trading – Larger targets, stricter filters. Fewer signals, but improved quality. Less time spent watching the screen.
The best approach is to perform both in parallel. Adjust the directional bias with M15 and set the precise timing with M5. When both settings match, that will be the setting with the highest probability.
Reasons why it's gold only
I tried applying this method to EUR/USD, GBP/JPY, and other currency pairs, but it didn't work the same way. Gold has unique properties.
- Session-based volatility patterns that repeat daily
- ATR doubles in minutes before and after news events
- Price fluctuations that are far larger than those of foreign exchange when viewed in absolute terms.
- Reaction distance of a specific moving average that is different from any other currency pair
All thresholds, filter parameters, and TP/SL coefficients in my indicator are specifically tuned for XAUUSD. This is not a general-purpose tool for gold settings; it is a tool specifically for gold. That's all.
Common mistakes
After sharing this indicator with other traders, the most common mistake is as follows:
Instead of inputting all signals regardless of quality , utilize the quality score. That's what the quality score is for.
When taking multiple positions for consecutive signals —one position per signal—there's a reason why the trade-off point (TP) is already reduced for the second signal in the same direction.
Ignore the trend – If the panel shows "Range," do not trade. The filter indicates that the market is uncertain.
If you move your stop-loss (SL) or take-profit (TP) after entering a trade —there's a reason the indicator calculated these levels. Trust the numbers or don't use the tool.
You should not proceed with trading based solely on the direction of the M15 timeframe without confirming the direction of the higher timeframe (M15). Going against the direction of the M5 is gambling, not trading.
Please verify everything yourself.
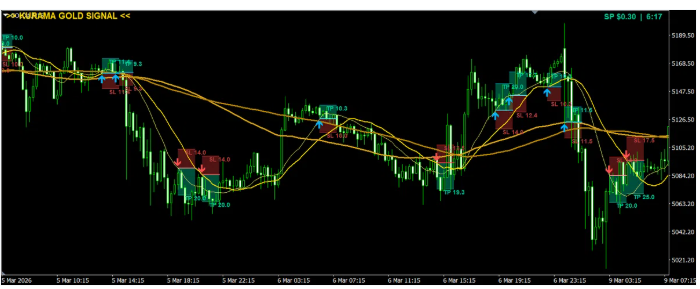
I'm not asking anyone to take screenshots or claimed results at face value. All past signals remain on the chart along with the TP/SL zones. Scroll down to see them. Reaching the green zone means you've reached TP, and reaching the red zone means you've reached SL.
The indicator's performance can be verified using your own charts, your own broker, and your own market environment. This transparency is intentional.
Past signal performance does not guarantee future results. Market conditions change. However, the ability to verify results is what distinguishes a legitimate tool from marketing hype.
About the indicators
Gold Signal Pro is compatible with both MetaTrader 4 and MetaTrader 5 and is available on the MQL5 marketplace. It comes with all the features, including 7 filters, dynamic TP/SL, quality scoring, session detection, spread monitoring, and a built-in win/loss counter.
MT4 version: Gold Signal Pro MT4
MT5 version: Gold Signal Pro MT5
This article reflects my personal trading methods. It is not investment advice. All trading decisions are your own responsibility. XAUUSD is highly volatile and can result in significant losses. Please trade only with funds you can afford to lose.


