
Automated Harmonic Pattern Detection: How the ABCD Harmonic Dashboard Scans 20 Symbols Across All Timeframes

1. Introduction
You are scrolling through GBPUSD on the 15-minute chart, squinting at swing highs and swing lows, mentally trying to connect four points into a valid AB=CD pattern. Is that a C point or just noise? Does the BC leg retrace between 38.2% and 88.6% of the AB leg? You grab a Fibonacci tool, measure the retrace, and it comes back at 41% -- borderline. Now you need to measure the CD extension relative to BC. By the time you calculate both ratios and decide the pattern is valid, three more candles have printed and the entry window at point D is long gone.
Now multiply that by twenty symbols across nine timeframes. Harmonic pattern trading is one of the most mathematically precise approaches to the markets, but its precision is also its bottleneck. Each potential ABCD pattern requires identifying four confirmed swing points, measuring two Fibonacci ratios, and validating them against acceptable ranges -- all while price is still moving. Manual scanning for harmonic patterns across a full watchlist is not just slow; it is practically impossible to do consistently.
The fundamental problem is not understanding the pattern. The problem is that no human can scan 180 chart combinations in real time, identify every valid ABCD formation, and act on them before the opportunity passes. You need a system that does the geometric analysis for you -- continuously, automatically, and across your entire watchlist.
I built the ABCD Harmonic Dashboard to solve this exact problem. It scans up to 20 symbols across nine timeframes, identifies confirmed swing pivots, constructs potential ABCD patterns, validates them against Fibonacci ratio ranges with configurable tolerance, and presents every valid pattern in a compact six-column dashboard with real-time alerts. No manual measuring. No missed patterns. One glance tells you which symbols have active harmonic setups right now.
The indicator is available on the MQL5 Market for both platforms:
- MetaTrader 5: ABCD Harmonic Dashboard MT5
- MetaTrader 4: ABCD Harmonic Dashboard MT4
2. What Is Harmonic Pattern Trading?
Harmonic pattern trading is a methodology based on the idea that price movements form geometric structures that repeat across all markets and timeframes. These structures are defined by specific Fibonacci ratios between their legs, and when those ratios align within acceptable tolerances, they indicate high-probability reversal zones.
The concept dates back to H.M. Gartley's 1935 book Profits in the Stock Market, where he described a specific price pattern that offered favorable risk-to-reward entries. Larry Pesavento and Scott Carney later refined and expanded harmonic trading by incorporating strict Fibonacci measurements, creating a family of patterns including the Gartley, Butterfly, Bat, Crab, and the foundational AB=CD pattern.
What makes harmonic patterns different from standard chart patterns like head and shoulders or double tops is their mathematical precision. A head and shoulders pattern is identified visually -- there is no universally agreed-upon ratio that defines how deep the neckline should be relative to the head. Harmonic patterns, in contrast, require specific Fibonacci relationships between each leg. A pattern either meets the ratio criteria or it does not. This binary validation removes much of the subjectivity from pattern identification.
The AB=CD pattern is the simplest and most fundamental harmonic structure. Every more complex harmonic pattern -- Gartley, Butterfly, Bat, Crab -- contains an AB=CD pattern within it. Mastering the AB=CD is therefore the foundation for all harmonic trading.
Why do these geometric structures repeat? The Fibonacci sequence and its derived ratios (0.382, 0.618, 0.786, 1.272, 1.618, etc.) appear throughout natural systems. In financial markets, these ratios manifest in the way crowds of traders react to price swings. Retracements tend to find support or resistance at Fibonacci levels because large numbers of participants use these same ratios for entries, stops, and targets. The self-reinforcing nature of this behavior is what gives harmonic patterns their predictive power.
The challenge is not theoretical. It is operational. Identifying valid AB=CD patterns requires precise measurement of swing points and Fibonacci ratios across multiple timeframes and instruments -- a task that overwhelms manual analysis when applied to a full trading watchlist.
3. The AB=CD Pattern Explained
The AB=CD pattern consists of four consecutive swing points -- labeled A, B, C, and D -- that form two distinct price legs with specific Fibonacci relationships between them.
There are two types of AB=CD patterns:
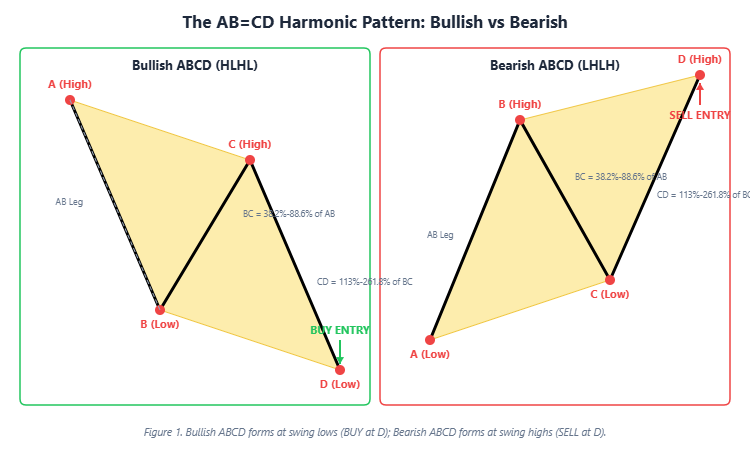
Bullish ABCD (HLHL -- High, Low, High, Low)
In a bullish AB=CD, the four points form this structure:
- A is a swing high -- the starting point of the pattern
- B is a swing low -- price drops from A to B (this is the AB leg)
- C is a swing high -- price retraces upward from B, but C must be lower than A
- D is a swing low -- price drops from C to D, and D must be lower than B
The D point is where the pattern completes, and it represents a BUY entry. The logic is that price has completed a measured move down and is now at a statistically significant support level defined by the Fibonacci extension of the BC leg.
Bearish ABCD (LHLH -- Low, High, Low, High)
In a bearish AB=CD, the structure mirrors the bullish version:
- A is a swing low -- the starting point
- B is a swing high -- price rises from A to B
- C is a swing low -- price retraces downward from B, but C must be higher than A
- D is a swing high -- price rises from C to D, and D must be higher than B
The D point completes the pattern and signals a SELL entry. Price has completed a measured move up to a Fibonacci-defined resistance level.
The key constraint that separates a valid ABCD from random price action is the Fibonacci relationship between the legs:
-
BC must retrace between 38.2% and 88.6% of AB -- This ensures that the C point represents a legitimate counter-move, neither too shallow (which would suggest the original trend is still dominant) nor too deep (which would suggest a full reversal rather than a retracement)
-
CD must extend between 113% and 261.8% of BC -- This ensures that the D point represents a proportional measured move from the C point, completing the harmonic structure
When both ratios fall within these ranges, the D point becomes a high-probability reversal zone. The pattern is telling you that price has moved in a geometrically precise way that historically precedes a directional change.
Figure 1. Bullish ABCD forms at swing lows (BUY at D); Bearish ABCD forms at swing highs (SELL at D).
4. Fibonacci Ratios: The Validation Engine
The Fibonacci ratios are what transform a random four-point price swing into a validated harmonic pattern. Without ratio validation, you would be trading every zigzag in price, and most of those would be meaningless noise.
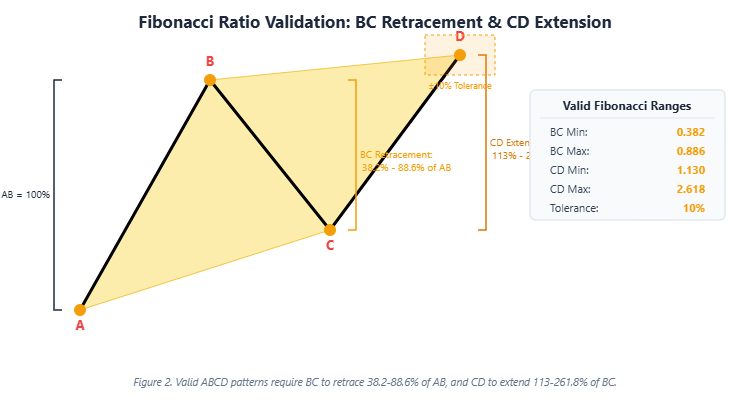
BC Retracement of AB
The BC retracement measures how much of the AB leg price retraces before continuing. The calculation is straightforward:
BC Retracement = |C - B| / |A - B|
For a bullish pattern (where A is high and B is low), if AB spans 100 pips and BC retraces 50 pips upward, the BC retracement is 0.50 (50%). The ABCD Harmonic Dashboard validates this against a configurable range, with defaults of 0.382 (38.2%) minimum and 0.886 (88.6%) maximum.
A BC retracement below 38.2% suggests the counter-move at C was too weak -- the original trend from A to B is likely still in control, and any reversal at D would be fighting strong momentum. A retracement above 88.6% suggests the counter-move was too strong -- it has almost fully reversed the AB leg, which undermines the geometric premise of the ABCD structure.
CD Extension of BC
The CD extension measures how far the D leg extends relative to the BC leg:
CD Extension = |D - C| / |C - B|
The default range is 1.13 (113%) minimum to 2.618 (261.8%) maximum. A CD extension of exactly 1.0 would mean CD is the same length as BC, which is the textbook "perfect" AB=CD. Extensions between 113% and 261.8% represent the range of valid harmonic completions where the measured move has been proportionally fulfilled.
Tolerance: Handling Real-World Imprecision
Markets do not produce mathematically perfect patterns. Price may overshoot or undershoot ideal Fibonacci levels by a few pips. The ABCD Harmonic Dashboard includes a configurable tolerance parameter (default: 10%) that expands the valid ratio ranges slightly:
Effective BC Min = 0.382 x (1 - 0.10) = 0.3438 Effective BC Max = 0.886 x (1 + 0.10) = 0.9746
This tolerance prevents the indicator from rejecting patterns that are geometrically sound but marginally outside the strict ratio boundaries. The 10% default strikes a balance between precision and practicality.
Figure 2. Valid ABCD patterns require BC to retrace 38.2-88.6% of AB, and CD to extend 113-261.8% of BC.
5. Why Manual Pattern Scanning Fails
Even experienced harmonic traders face three critical operational problems when scanning for ABCD patterns manually.
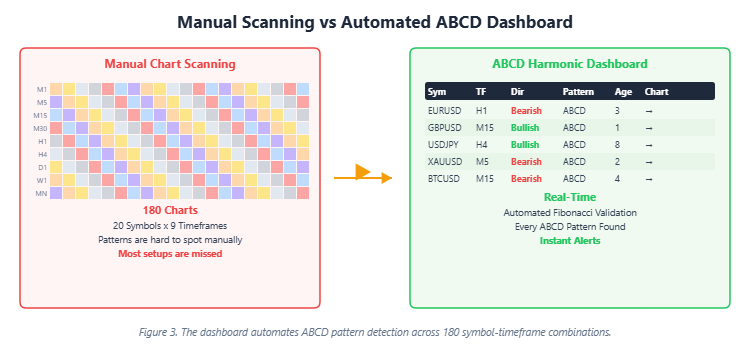
Problem 1: Volume of Chart Combinations
A typical multi-asset trader monitors 20 symbols -- major and minor forex pairs, gold, silver, crypto assets, and indices. With nine available timeframes (M1 through Monthly), that produces 180 possible chart combinations. Scanning each chart for ABCD patterns requires identifying swing points, measuring ratios, and making a validity judgment. At even 30 seconds per chart, a full scan takes 90 minutes -- by which time many of the setups you were looking for have already played out.
Problem 2: Pattern Recognition Fatigue
Harmonic pattern identification is cognitively demanding. You are not just looking for a shape -- you are looking for a shape that meets specific mathematical criteria. After an hour of measuring Fibonacci ratios across different symbols and timeframes, accuracy drops significantly. The human eye starts seeing patterns where none exist (false positives) or overlooking valid patterns in noisy price action (false negatives).
Problem 3: Real-Time Pattern Completion
ABCD patterns complete when the D point forms. In fast-moving markets, the window between pattern completion and optimal entry can be a handful of candles. If you are still scanning EURUSD on the M5 chart when a valid bearish ABCD completes on XAUUSD M30, you miss the entry entirely. There is no way to monitor 180 charts simultaneously with human eyes.
The result is that most harmonic traders either limit themselves to a handful of symbols and timeframes (missing the majority of setups) or spend so much time scanning that they cannot act on what they find. The scanning process itself becomes the bottleneck, not the strategy.
Figure 3. The dashboard automates ABCD pattern detection across 180 symbol-timeframe combinations.
6. Introducing the ABCD Harmonic Dashboard
The ABCD Harmonic Dashboard is a professional multi-symbol, multi-timeframe indicator that automates the entire harmonic pattern detection process. Instead of manually scanning 180 charts and measuring Fibonacci ratios by hand, you get a single dashboard that continuously monitors all your symbols across all enabled timeframes and alerts you the moment a valid ABCD pattern completes.
Core Features:
- Automated ABCD Detection -- Identifies both Bullish (HLHL) and Bearish (LHLH) ABCD patterns with full Fibonacci validation
- 6-Column Dashboard -- Symbol, Timeframe, Direction, Pattern, Age, and one-click Chart navigation
- Multi-Symbol Scanning -- Monitor up to 20 instruments simultaneously (forex, metals, crypto, indices)
- Multi-Timeframe Coverage -- Scan M1 through Monthly (9 timeframes, individually toggleable)
- Non-Repainting Signals -- Patterns are based on confirmed swing pivots with right-bar validation
- Yellow Triangle Fill -- Completed patterns are drawn with filled yellow triangles and labeled A/B/C/D points
- 4-Channel Alerts -- Popup, sound, email, and push notifications with pattern details
- Configurable Fibonacci Ranges -- Adjust BC retracement, CD extension, and tolerance to match your trading style
The indicator handles all the geometric analysis automatically. You configure your symbols and preferred Fibonacci tolerance, and the dashboard does the rest -- scanning, measuring, validating, and alerting in real time.
Download the free demo or purchase the full version:
- MetaTrader 5: ABCD Harmonic Dashboard MT5
- MetaTrader 4: ABCD Harmonic Dashboard MT4
Figure 4. The 6-column dashboard shows every detected ABCD pattern across all monitored symbols and timeframes.

7. How the Detection Engine Works
The detection engine operates in three stages on every new bar: pivot identification, pattern construction, and Fibonacci validation.
Stage 1: Pivot Identification
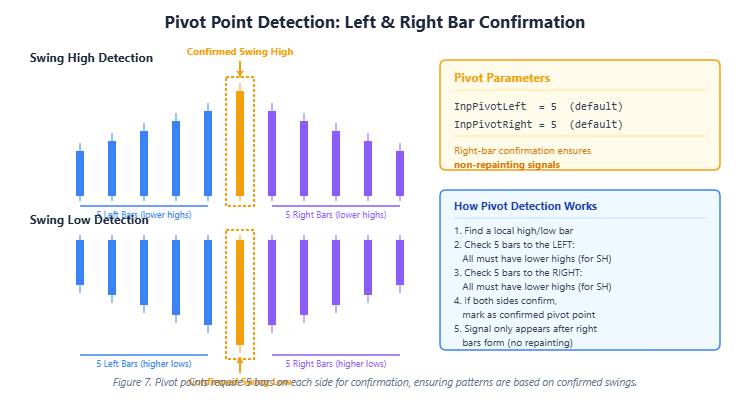
The engine first identifies confirmed swing highs and swing lows across the price history. A swing high is a bar whose high is greater than the highs of a specified number of bars to its left and to its right. Similarly, a swing low is a bar whose low is lower than the lows of bars on both sides.
The key parameters are Pivot Left Bars and Pivot Right Bars , both defaulting to 5. This means a swing high requires 5 bars with lower highs on both the left and right sides before it is confirmed. This right-side confirmation is what makes the signals non-repainting -- a pivot cannot be identified until enough future bars have confirmed it.
Stage 2: Pattern Construction
Once pivots are identified, the engine searches for valid four-point sequences:
- For Bullish ABCD: it looks for a High (A), then a subsequent Low (B), then a High (C) that is lower than A, then a Low (D) that is lower than B
- For Bearish ABCD: it looks for a Low (A), then a subsequent High (B), then a Low (C) that is higher than A, then a High (D) that is higher than B
The engine scans up to 500 bars of history (configurable via Max History Bars ) to find the most recent valid pattern for each symbol-timeframe combination.
Stage 3: Fibonacci Validation
Every candidate pattern is validated against the Fibonacci ratio criteria:
- Calculate BC retracement of AB: |C - B| / |A - B|
- Check that the ratio falls within [0.382, 0.886] (adjusted by tolerance)
- Calculate CD extension of BC: |D - C| / |C - B|
- Check that the ratio falls within [1.13, 2.618] (adjusted by tolerance)
Only patterns that pass both ratio checks are displayed on the dashboard. This ensures that every signal you see represents a geometrically valid harmonic structure -- not just any random four-point swing.
Non-Repainting Guarantee
The indicator evaluates only confirmed pivots -- pivots where the required number of right-side bars have already formed. Because the D point must be a confirmed pivot (with InpPivotRight bars to its right), the signal cannot appear until the pattern is fully confirmed. Once displayed, it never changes or disappears.
8. The 6-Column Dashboard
The dashboard presents all detected ABCD patterns in a compact, scrollable table with six columns:
| Column | Content | Description |
|---|---|---|
| Symbol | e.g., EURUSD | The instrument where the pattern was detected |
| Timeframe | e.g., H1, M15 | The chart timeframe of the pattern |
| Direction | Bullish / Bearish | Green for Bullish (BUY at D), Red for Bearish (SELL at D) |
| Pattern | ABCD | The pattern type (currently AB=CD) |
| Age | e.g., 3 | Number of bars since the pattern completed |
| Chart | Click to navigate | Opens the corresponding chart for visual confirmation |
The dashboard displays in a separate indicator window below your main chart. It supports scrolling when there are more signals than visible rows (configurable, default 12 rows). Each row is color-coded by direction -- green background tint for Bullish, red for Bearish -- making it easy to scan for the type of setup you want.
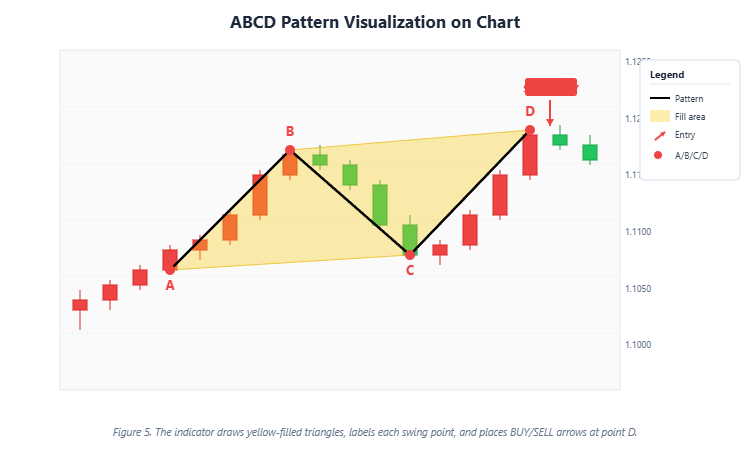
Clicking the Chart column on any row switches your main chart to that symbol and timeframe, where the full ABCD pattern is drawn with yellow triangle fills, A/B/C/D labels, and a BUY ENTRY or SELL ENTRY arrow at the D point.
The Age column tells you how fresh each signal is. An age of 1 means the pattern just completed on the most recent confirmed bar. Higher ages indicate older patterns that may still be valid if price has not moved significantly from the D point.
Figure 5. The indicator draws yellow-filled triangles, labels each swing point, and places BUY/SELL arrows at point D.
9. 4-Channel Alert System
The ABCD Harmonic Dashboard supports four independent alert channels, any combination of which can be enabled simultaneously:
| Channel | Parameter | Default | Description |
|---|---|---|---|
| Popup | Enable Popup Alerts | ON | Standard MetaTrader popup dialog |
| Sound | Enable Sound Alerts | ON | Plays a WAV file (default: alert2.wav) |
| Enable Email Alerts | OFF | Sends to the email configured in MT4/MT5 settings | |
| Push | Enable Push Notifications | ON | Sends to MetaTrader mobile app |
Alert Message Format:
When a new ABCD pattern is detected, the alert message includes the essential details:
ABCD Harmonic Dashboard: EURUSD BULLISH ABCD (BUY) pattern on H1
The message tells you the symbol, pattern type (Bullish or Bearish), the trading direction (BUY or SELL), and the timeframe. This gives you enough information to immediately pull up the chart and evaluate the setup.
Alerts fire only once per pattern per symbol-timeframe combination to prevent duplicate notifications. The alert title is configurable via the Alert Title parameter.
For email and push notifications to work, you need to configure the respective settings in your MetaTrader terminal options (Tools > Options > Notifications for push, Tools > Options > Email for email).
10. Practical Trading Workflow
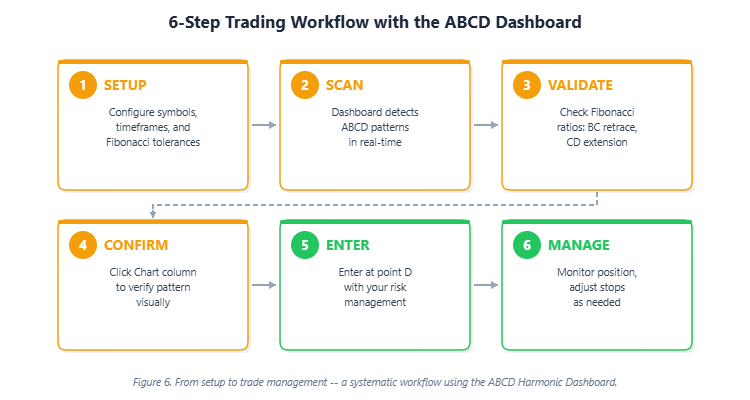
Here is a systematic six-step workflow for trading with the ABCD Harmonic Dashboard:
Step 1: Setup
Configure the indicator with your preferred symbols (up to 20) and enable the timeframes you trade. Set your Fibonacci tolerance based on how strict you want pattern validation to be. The default 10% tolerance works well for most instruments.
Step 2: Scan
Let the dashboard run. It continuously monitors all symbol-timeframe combinations and populates the table with every valid ABCD pattern it detects. Fresh patterns appear with low Age values.
Step 3: Validate the Fibonacci Ratios
When a new pattern appears (Age = 1 or 2), note the direction. Bullish patterns indicate a BUY opportunity at the D point. Bearish patterns indicate a SELL opportunity. The dashboard has already validated the Fibonacci ratios, but you can click through to the chart to visually confirm the pattern structure.
Step 4: Confirm on Chart
Click the Chart column to open the corresponding chart. Verify that the yellow triangle pattern looks clean and that the A, B, C, D points are well-defined swing points. Check if there is additional confluence -- does the D point align with a support/resistance level, a round number, or a higher-timeframe structure?
Step 5: Enter the Trade
If the pattern passes your visual confirmation:
- For a Bullish ABCD (BUY): Enter long near the D point. Place your stop loss below D by a buffer (e.g., 1x ATR below D). Set take profit at the B level or the A level, depending on your risk-reward preference
- For a Bearish ABCD (SELL): Enter short near the D point. Place your stop loss above D by a buffer. Set take profit at the B level or A level
Step 6: Manage the Position
Monitor the trade. Harmonic patterns often produce sharp reversals from the D point, so consider moving your stop to breakeven once price has moved in your favor by 1R (one times your initial risk).
Figure 6. From setup to trade management -- a systematic workflow using the ABCD Harmonic Dashboard.
11. Real Trade Examples
The following examples are taken from live charts with the ABCD Harmonic Dashboard active. Each screenshot shows the completed pattern with yellow triangle fills, A/B/C/D labels, and the dashboard running in the indicator window.
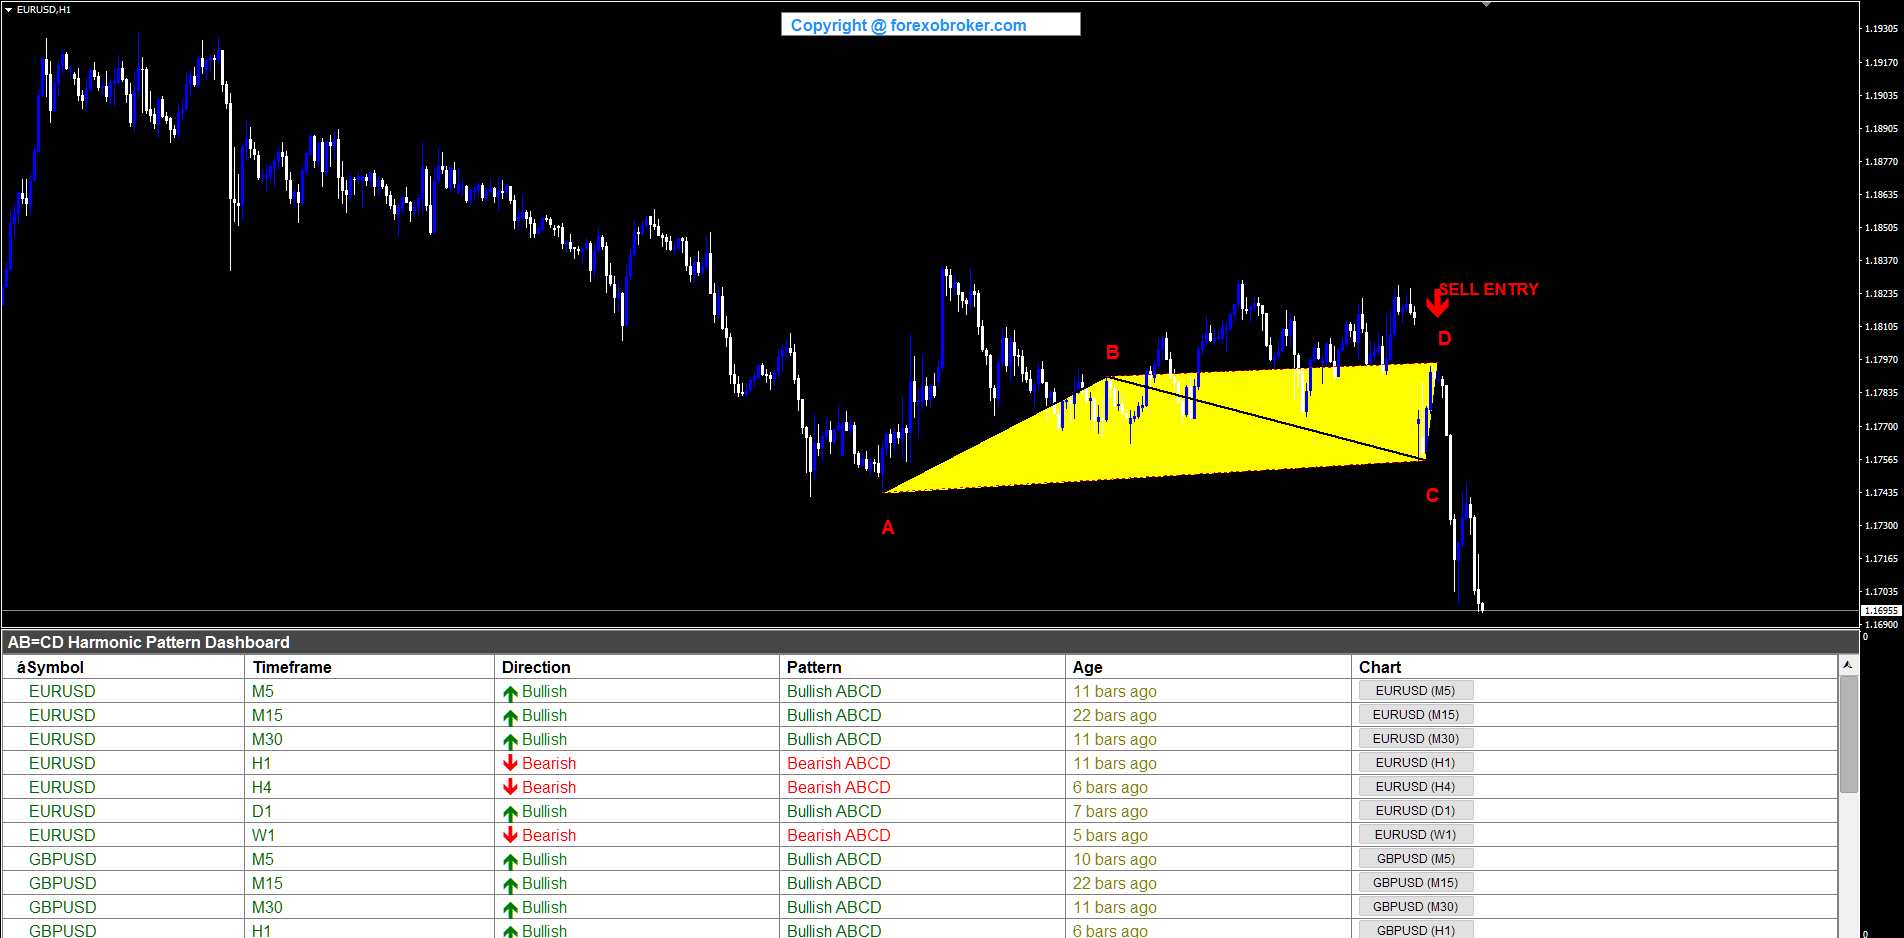
EURUSD H1 -- Bearish ABCD
A bearish ABCD pattern completed on EURUSD H1 with the SELL ENTRY arrow at approximately 1.1810. The pattern formed as A (swing low around 1.1730) rose to B (swing high around 1.1798), retraced down to C (swing low around 1.1743), then extended upward to D (swing high around 1.1810). The BC retracement and CD extension both fell within valid Fibonacci ranges. The yellow triangles clearly mark the ABC and BCD structures, and the dashboard shows EURUSD active across multiple timeframes.
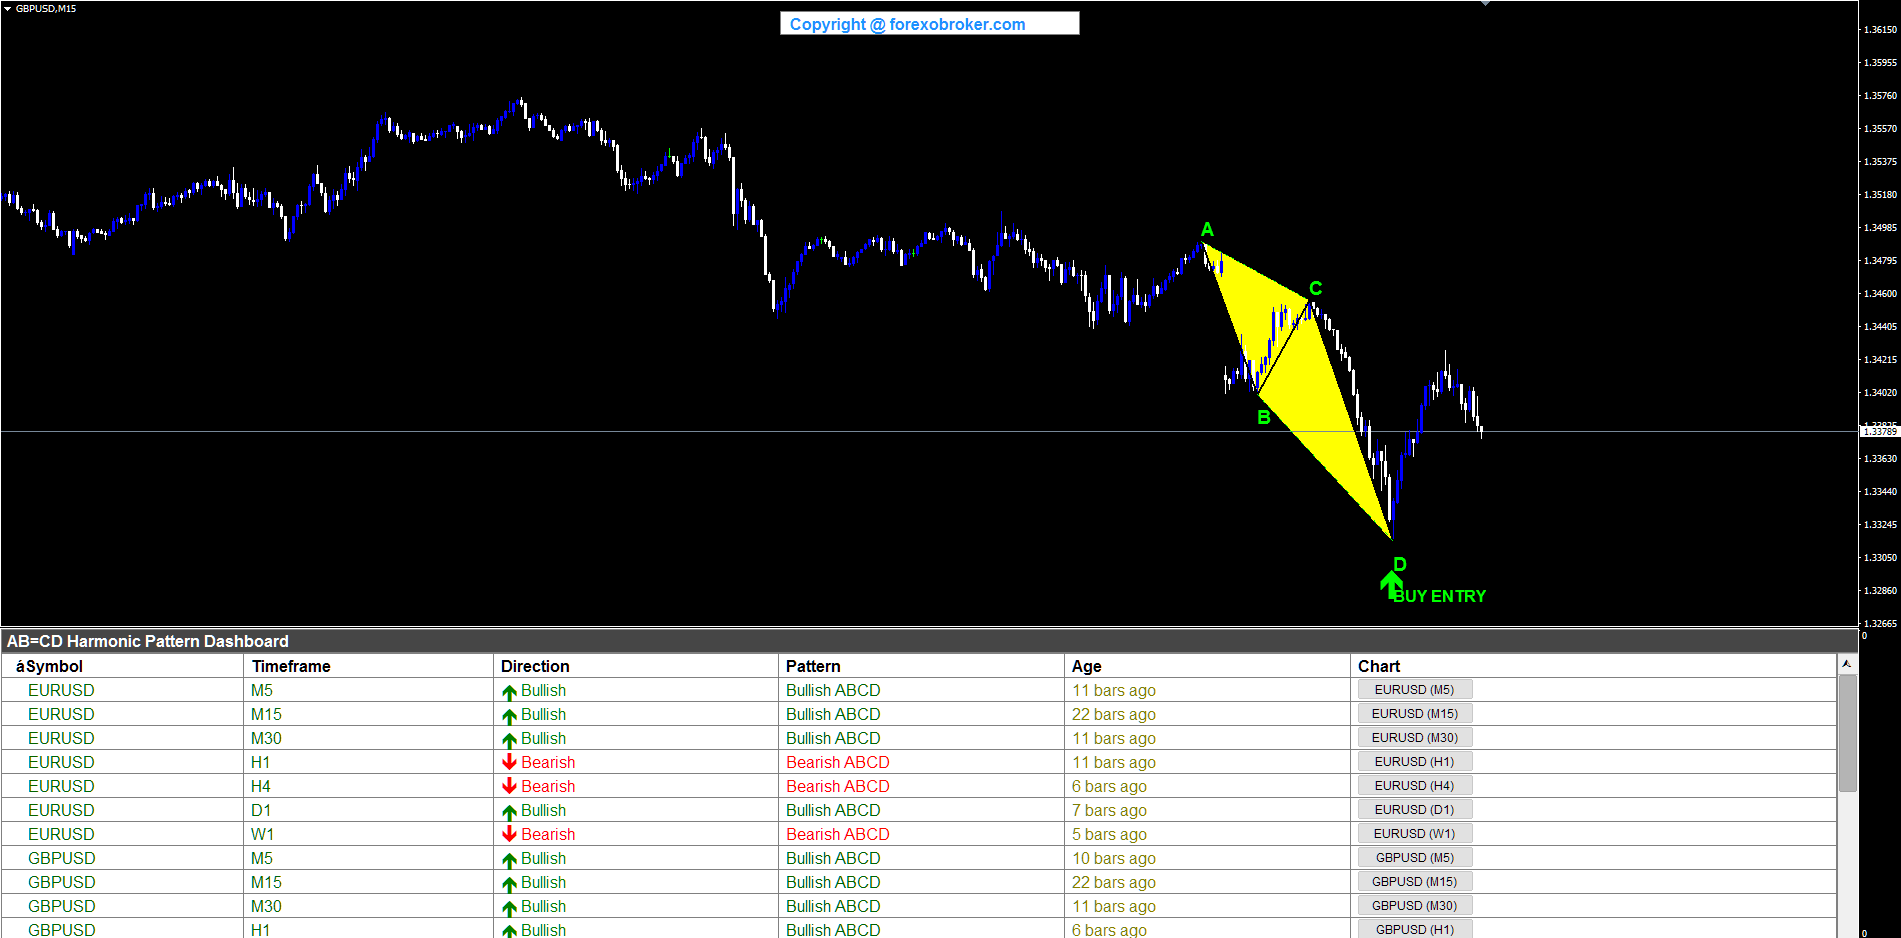
GBPUSD M15 -- Bullish ABCD
GBPUSD on the M15 timeframe displayed a bullish ABCD pattern during a strong downtrend, signaling a potential reversal. Point A formed at a swing high near 1.3498, B at the swing low around 1.3370, C retraced higher to approximately 1.3460, and D completed at a swing low near 1.3287. The BUY ENTRY arrow appeared at D, and the yellow-filled triangles highlighted the harmonic structure. The pattern provided a counter-trend entry at a Fibonacci-validated support zone.
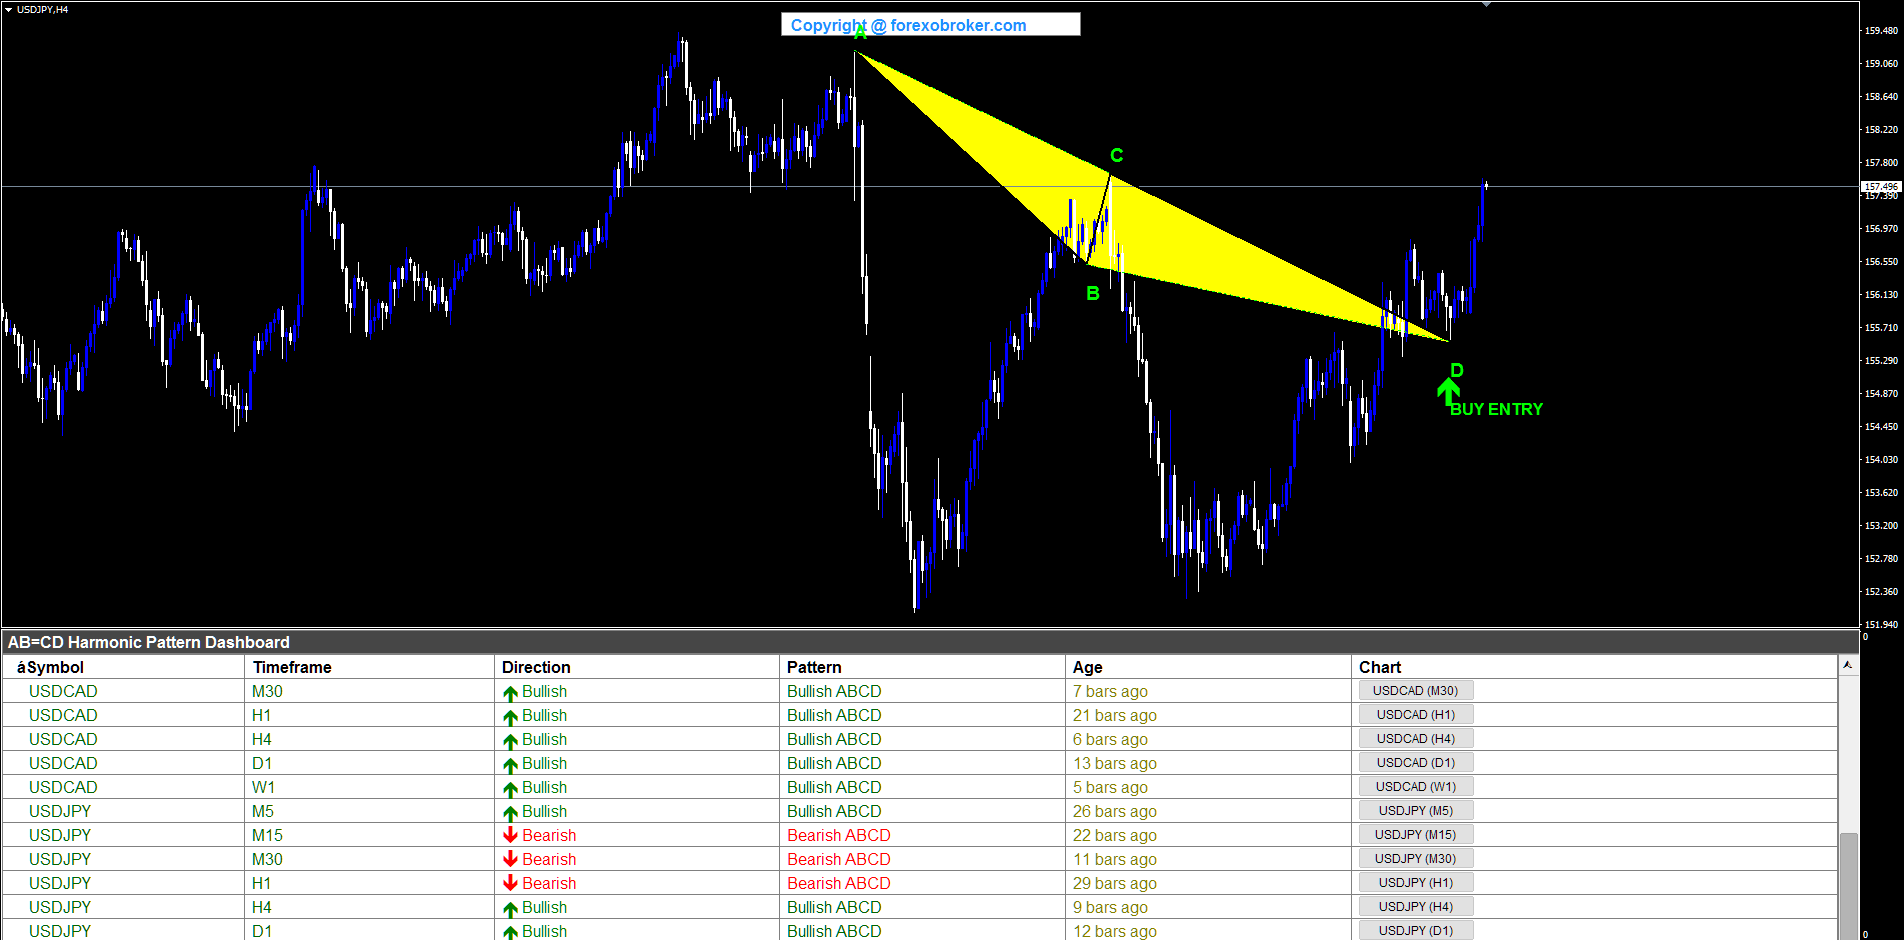
USDJPY H4 -- Bullish ABCD
On the H4 chart, USDJPY formed a bullish ABCD with A at a swing high near 159.00, B at a swing low around 156.05, C at a retracement high near 157.80, and D completing at a swing low around 155.10. The BUY ENTRY signal appeared at the D point, offering a long entry after a measured pullback within the broader structure. The dashboard showed both USDCAD and USDJPY rows, demonstrating the multi-symbol scanning capability.
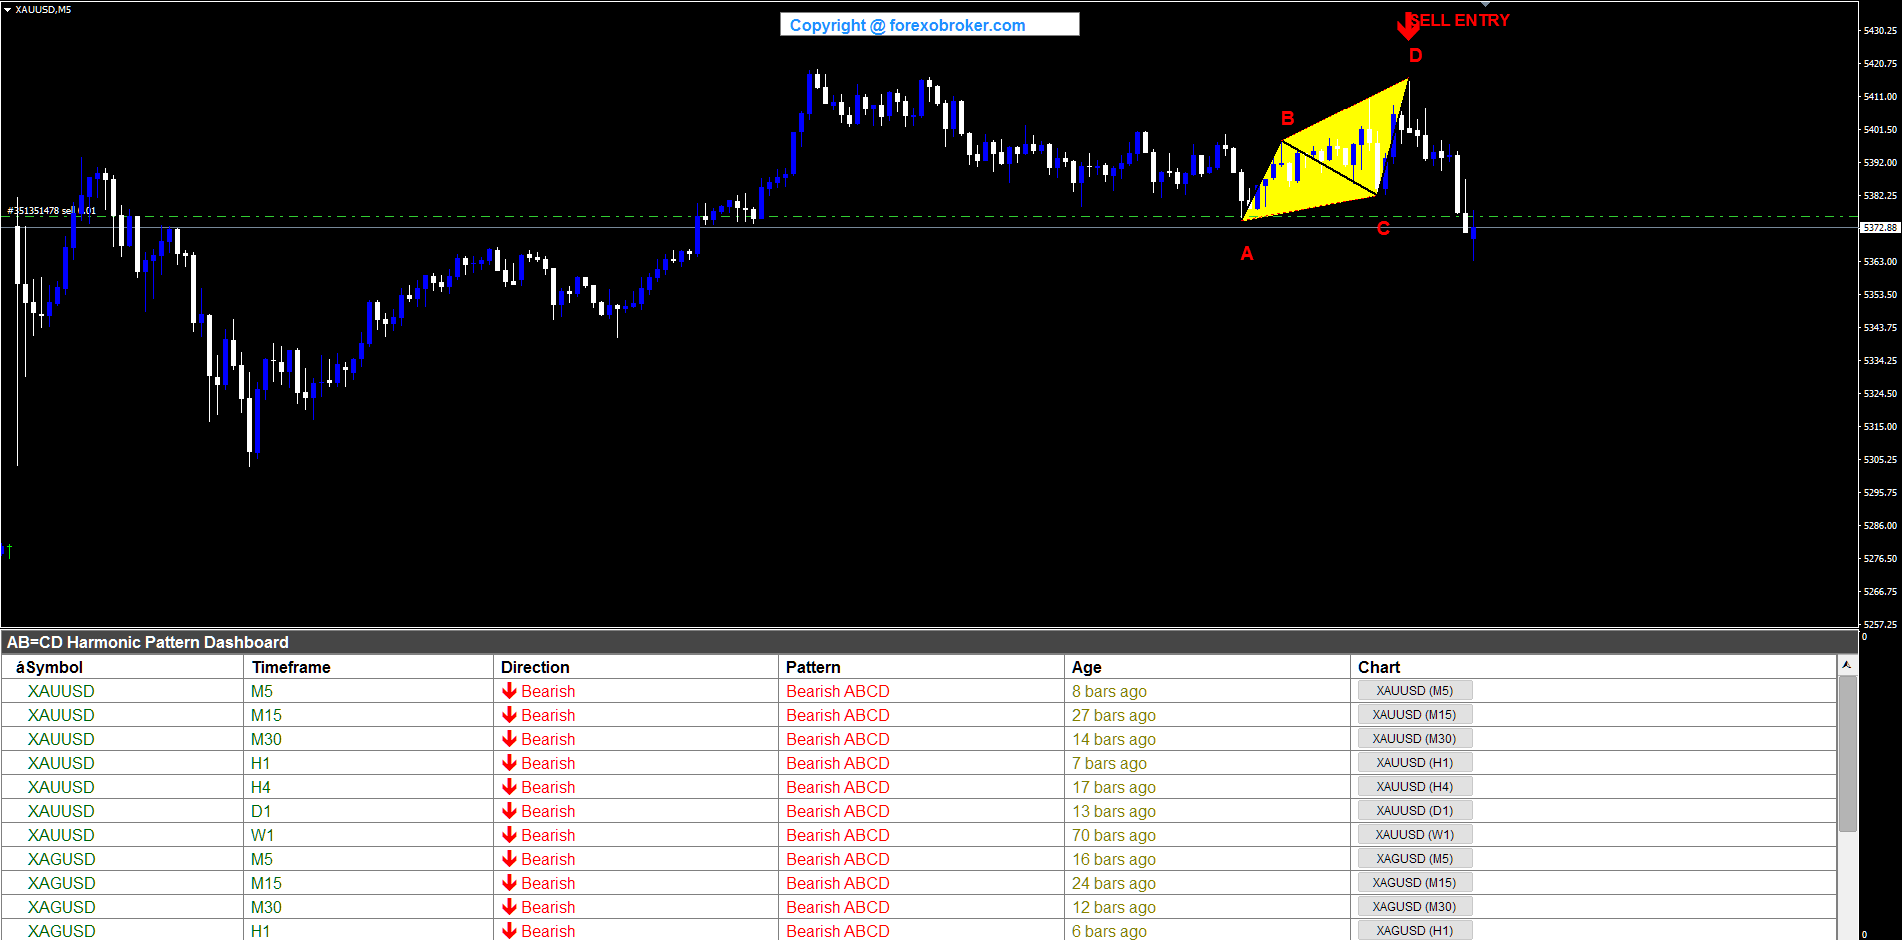
XAUUSD M5 -- Bearish ABCD
Gold on the M5 timeframe produced a compact bearish ABCD pattern near the top of a price move. The A-B-C-D sequence formed within a tight range around the 5370-5420 area, with the SELL ENTRY arrow at D near 5420. The dashboard simultaneously showed all-Bearish readings across XAUUSD and XAGUSD timeframes, indicating broad bearish sentiment in the precious metals sector.
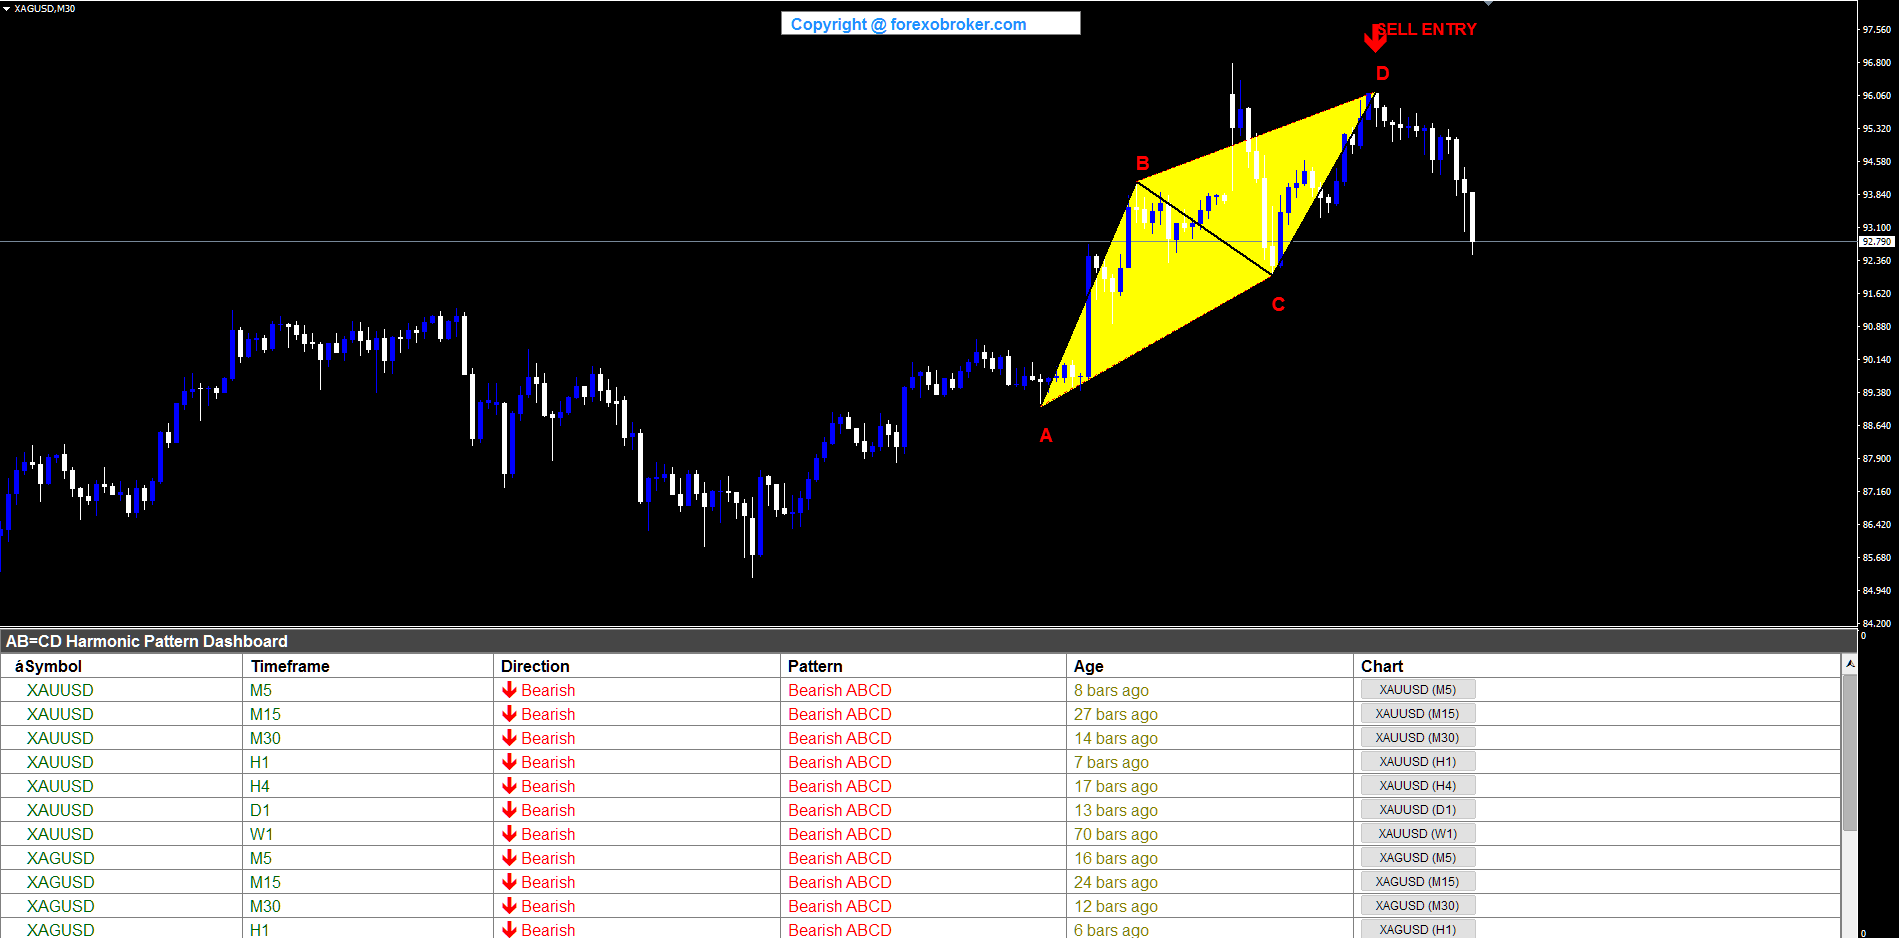
XAGUSD M30 -- Bearish ABCD
Silver on the M30 chart displayed a large bearish ABCD with well-defined swing points. A formed at a swing low near 89.38, B at a swing high near 93.84, C at a swing low around 91.62, and D completed at a swing high near 96.80. The prominent yellow triangles covered a significant portion of the price range, making the pattern easy to identify visually. The SELL ENTRY at D near 96.80 marked the pattern completion in an extended uptrend.
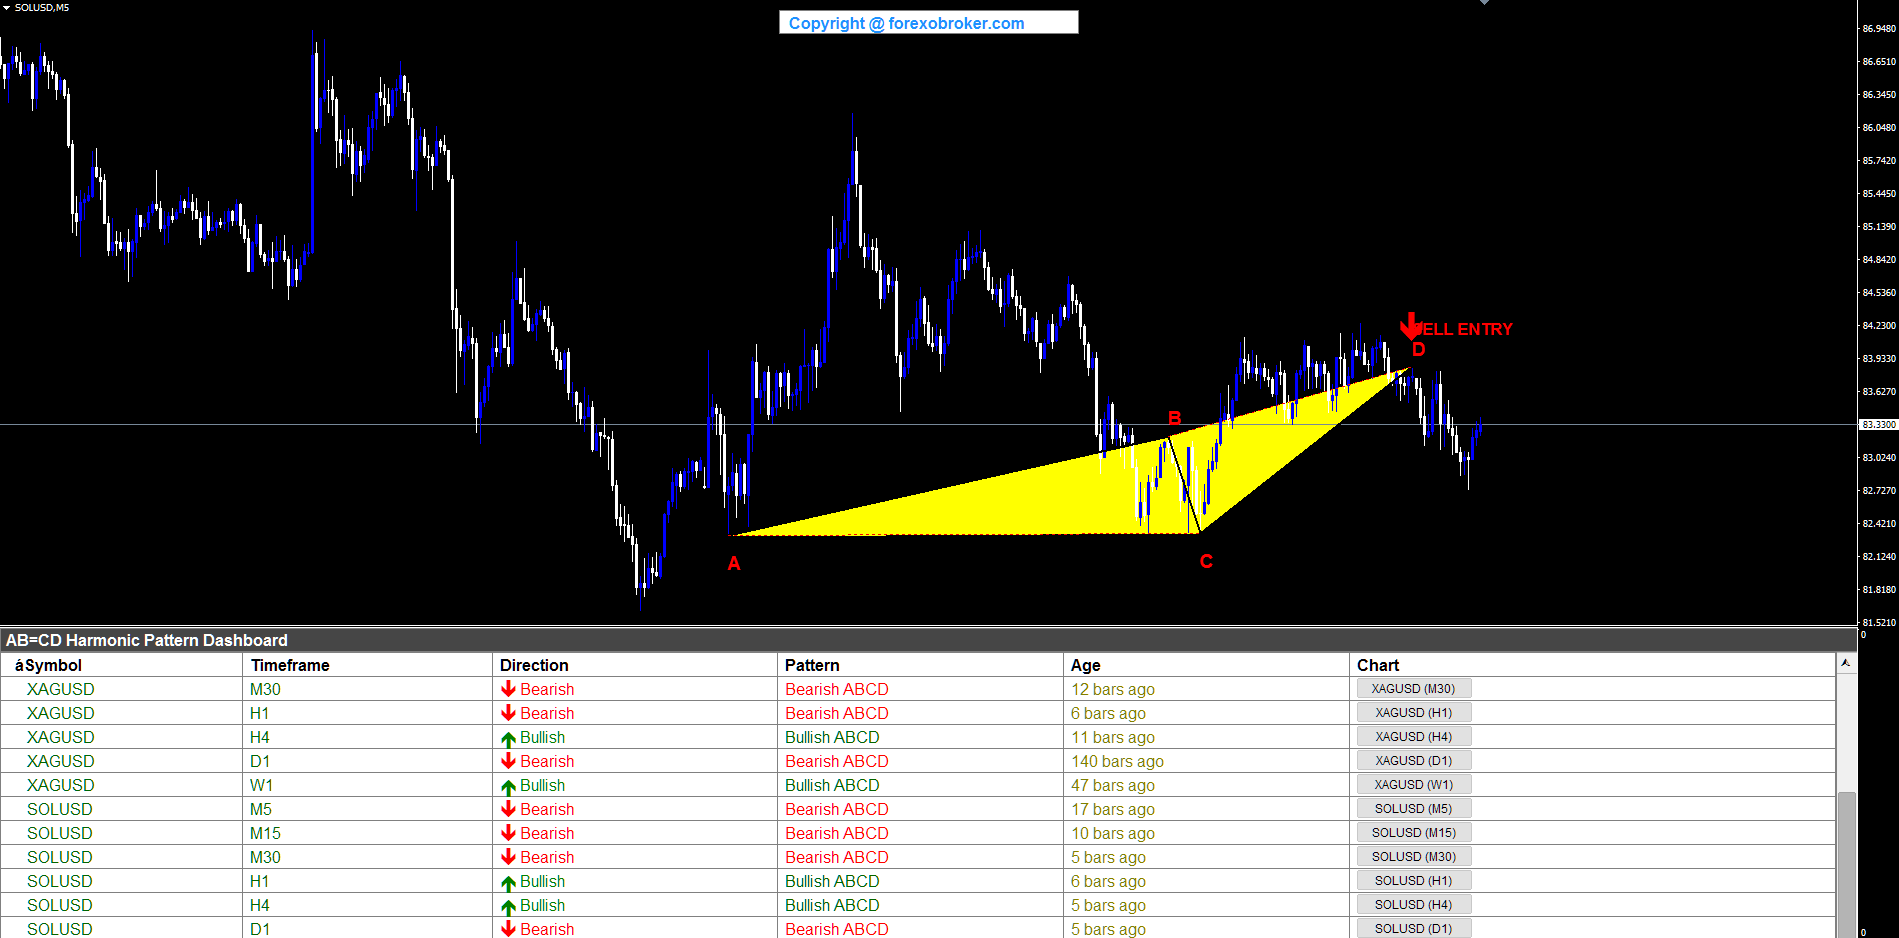
SOLUSD M5 -- Bearish ABCD
Solana on the M5 timeframe showed a bearish ABCD pattern forming within a downtrend. The D point completed near 84.23 with the SELL ENTRY arrow marking the short opportunity. The pattern's A-B-C-D points were contained within the 82-84 range, representing a compact scalping setup. The dashboard displayed XAGUSD and SOLUSD rows, showing the indicator's ability to scan across different asset classes simultaneously.
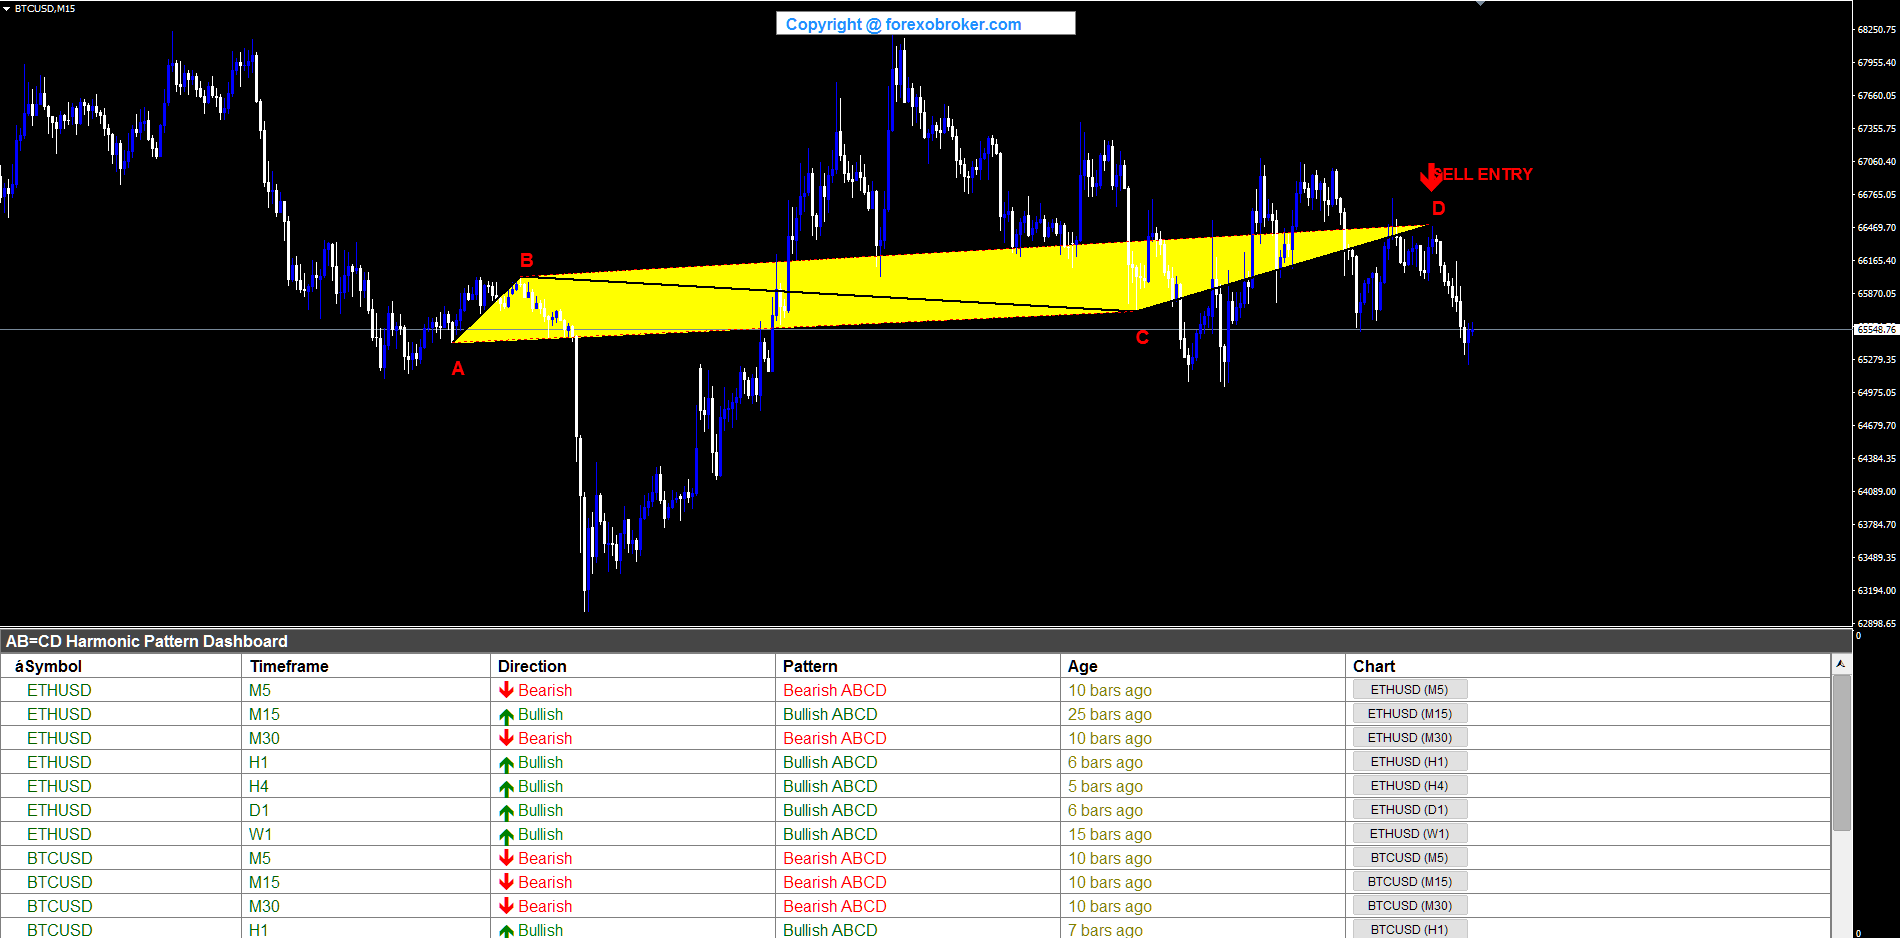
BTCUSD M15 -- Bearish ABCD
Bitcoin on the M15 chart produced a wide bearish ABCD pattern spanning a significant price range. The A point formed near 65,549 (swing low), B rose to approximately 65,870, C pulled back to around 65,549, and D extended to the swing high near 66,765. The yellow-filled triangles were particularly prominent due to the large price range. The SELL ENTRY at D near 66,765 was confirmed, and the dashboard showed ETHUSD and BTCUSD rows, demonstrating crypto market coverage.
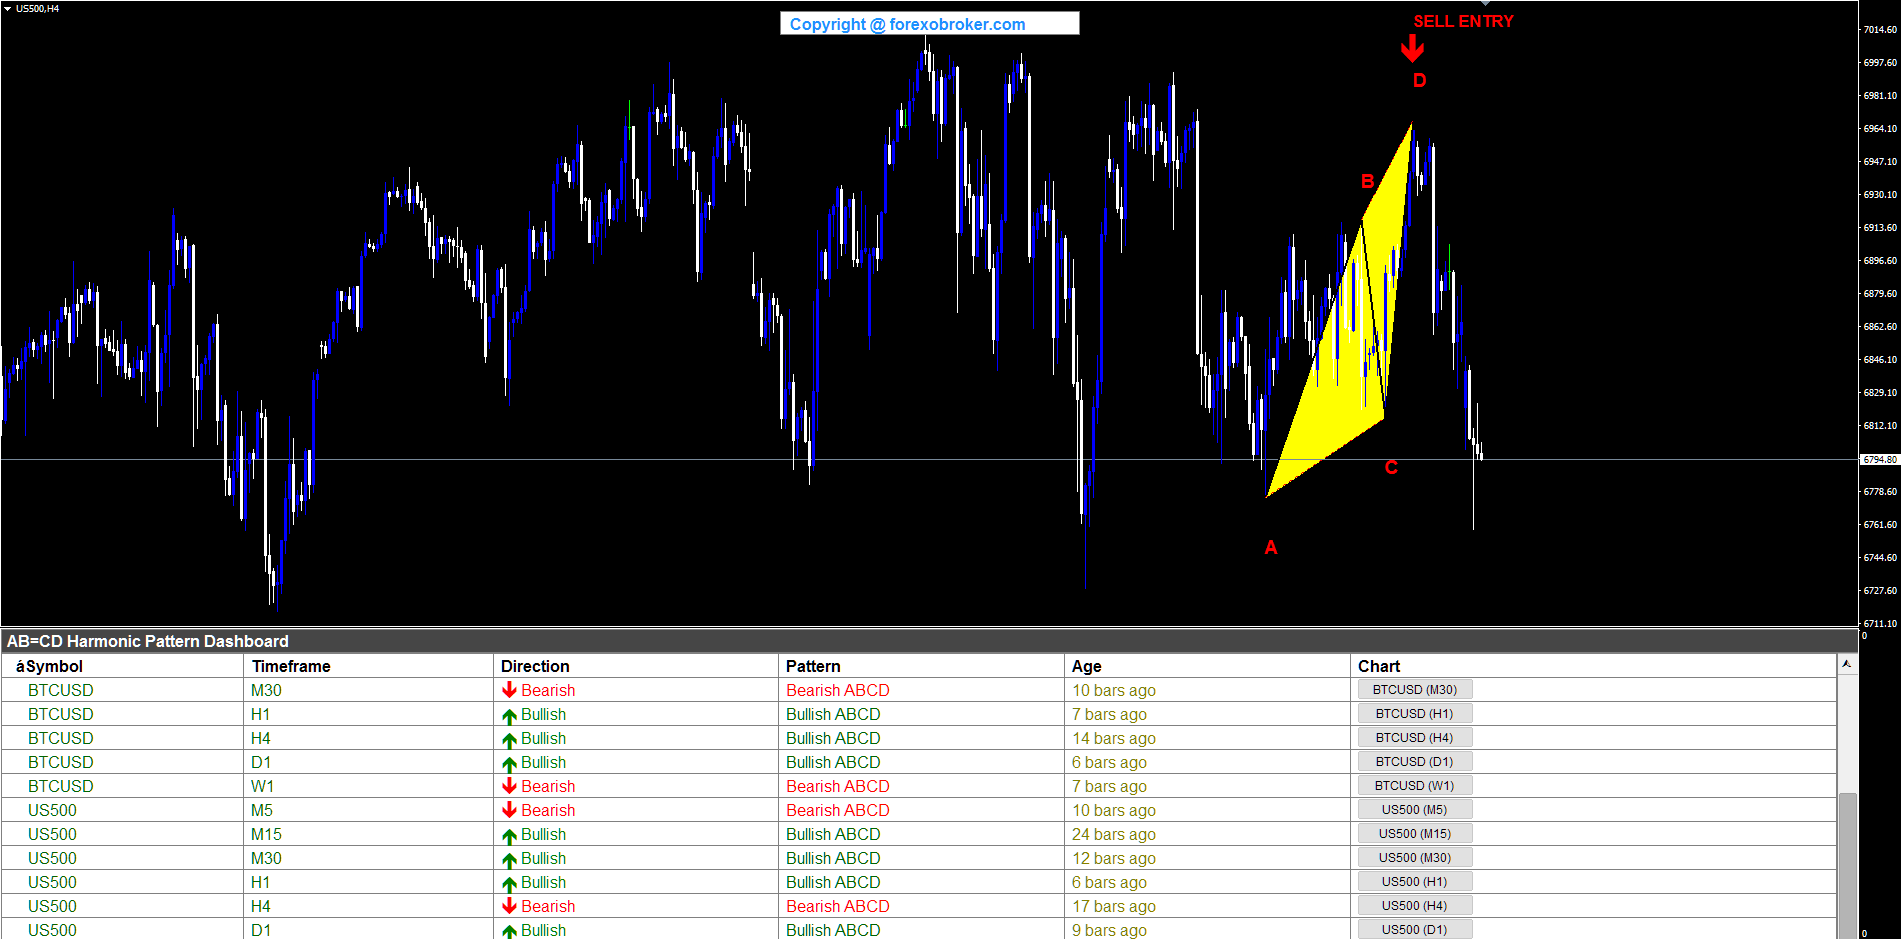
US500 H4 -- Bearish ABCD
The S&P 500 index on the H4 chart formed a bearish ABCD pattern with A at a swing low near 6,744, B at a swing high around 6,930, C at a swing low near 6,794, and D completing at a swing high around 6,997. The SELL ENTRY at D offered a reversal trade on the index at a Fibonacci-defined resistance level. The dashboard showed BTCUSD and US500 rows, illustrating cross-asset scanning from crypto to indices within the same indicator instance.
12. Pivot & Fibonacci Tuning Guide
The ABCD Harmonic Dashboard provides several parameters for fine-tuning pattern detection to match your trading style and the instruments you trade.
Pivot Sensitivity
| Parameter | Default | Effect of Increase | Effect of Decrease |
|---|---|---|---|
| Pivot Left Bars | 5 | Requires more bars before the pivot, finds major swings only | Finds minor swings, more patterns but lower quality |
| Pivot Right Bars | 5 | More confirmation bars needed, fewer but more reliable patterns | Faster pattern detection, more patterns but higher false-positive risk |
For scalping on M1-M5, consider reducing pivot bars to 3-4 for faster pattern detection. For swing trading on H4-D1, the default 5 or even 7-8 gives higher-quality patterns based on significant swing points.
Fibonacci Range Tuning
| Trading Style | BC Range | CD Range | Tolerance |
|---|---|---|---|
| Strict (fewer, higher-quality) | 0.50 - 0.786 | 1.27 - 2.00 | 5% |
| Default (balanced) | 0.382 - 0.886 | 1.13 - 2.618 | 10% |
| Relaxed (more patterns) | 0.30 - 0.90 | 1.0 - 3.0 | 15% |
Strict settings filter for near-perfect harmonic patterns. This produces fewer signals but each one closely matches the textbook definition. Use this approach when you want quality over quantity.
Default settings cover the standard harmonic trading range and work well across most instruments and timeframes. This is recommended for most traders starting out with the indicator.
Relaxed settings cast a wider net. You will see more patterns, but some will be at the edges of what would be considered valid harmonic geometry. Use this when scanning instruments with irregular price behavior (crypto, exotic pairs) where patterns tend to be less geometrically precise.
Max History Bars
The Max History Bars parameter (default: 500) controls how far back the indicator looks for pivots. Reducing this value speeds up calculation but may miss larger patterns that span many bars. Increasing it to 1000 or more allows detection of major swing patterns on higher timeframes but increases computation time. For most trading scenarios, 500 bars provides sufficient lookback depth.
Figure 7. Pivot points require confirmation bars on each side, ensuring patterns are based on confirmed swings.
13. Parameter Reference
Dashboard Settings
| Parameter | Default | Description |
|---|---|---|
| Symbols | EURUSD,GBPUSD,USDCAD,USDJPY | Comma-separated list of symbols to monitor (up to 20) |
| Symbol Prefix | (empty) | Broker prefix, e.g., "x" for xEURUSD |
| Symbol Suffix | (empty) | Broker suffix, e.g., ".pro" for EURUSD.pro |
| Enable M1-MN | Varies | Toggle each timeframe individually |
| Visible Rows | 12 | Number of rows displayed in the dashboard |
Pattern Detection Settings
| Parameter | Default | Description |
|---|---|---|
| Pivot Left Bars | 5 | Number of bars to the left for swing detection |
| Pivot Right Bars | 5 | Number of bars to the right for confirmation |
| BC Min Retracement | 0.382 | Minimum BC retracement ratio |
| BC Max Retracement | 0.886 | Maximum BC retracement ratio |
| CD Min Extension | 1.13 | Minimum CD extension ratio |
| CD Max Extension | 2.618 | Maximum CD extension ratio |
| Ratio Tolerance | 0.10 | Tolerance percentage for Fibonacci validation (10%) |
| Max History Bars | 500 | Number of historical bars to scan per symbol-timeframe |
Chart Display Settings
| Parameter | Default | Description |
|---|---|---|
| Show AB=CD Pattern | true | Draw the pattern overlay on chart |
| Show BUY/SELL Arrows | true | Display entry arrows at point D |
| Show Pattern Labels | true | Display A, B, C, D text labels |
| Bullish Pattern Color | Lime | Color for bullish (BUY) patterns |
| Bearish Pattern Color | Red | Color for bearish (SELL) patterns |
| Pattern Fill Color | Yellow | Color for the triangle fill |
| Pattern Line Color | Black | Color for the A-B-C-D connecting lines |
| Arrow Size | 4 | Size of entry arrows (1-5) |
| Arrow Gap (ATR mult.) | 0.8 | Distance of arrow from price (ATR multiplier) |
Alert Settings
| Parameter | Default | Description |
|---|---|---|
| Alert Title | "ABCD Harmonic Dashboard" | Title for alert messages |
| Enable Popup Alerts | true | Show MetaTrader popup dialog |
| Enable Sound Alerts | true | Play alert sound |
| Sound File | alert2.wav | WAV file for sound alerts |
| Enable Email Alerts | false | Send email notification |
| Enable Push Notifications | true | Send mobile push notification |
14. Conclusion
The AB=CD harmonic pattern is one of the most mathematically precise and reliable structures in technical analysis. Its effectiveness comes from the Fibonacci ratio relationships between the AB, BC, and CD legs -- relationships that are rooted in the natural geometry of market swings. The challenge has always been operational: identifying these patterns across a full watchlist of 20 symbols and nine timeframes requires continuous measurement and validation that exceeds what manual scanning can deliver.
The ABCD Harmonic Dashboard automates this entire process. It identifies confirmed swing pivots, constructs ABCD pattern candidates, validates them against configurable Fibonacci ranges with tolerance adjustment, and presents every valid pattern in a clean six-column dashboard with real-time alerts. The non-repainting design ensures that every signal is based on confirmed price structure, and the yellow triangle visualization makes pattern identification immediate and intuitive.
Whether you trade forex, metals, crypto, or indices -- and whether you scalp on M5 or swing trade on the Daily -- the dashboard adapts to your watchlist and timeframe preferences. Configure it once, and let it scan continuously while you focus on evaluating setups and managing trades.
Try the free demo or get the full version on the MQL5 Market:
- MetaTrader 5: ABCD Harmonic Dashboard MT5
- MetaTrader 4: ABCD Harmonic Dashboard MT4


