
How the Gartley Harmonic Dashboard Scans 20 Symbols Across All Timeframes for Fibonacci-Validated XABCD Trade Setups

1. Introduction & Hook
You are staring at EURUSD on the hourly chart, trying to piece together five swing points into a Gartley harmonic pattern -- the original XABCD structure that started it all back in 1935. You think you have found X at a swing low, A at the subsequent high, and B at a pullback low -- but does B sit at exactly the 61.8% golden ratio retracement of XA? You grab the Fibonacci retracement tool, measure, and get 59.2%. Is that close enough? You check your tolerance rules: 61.8% plus or minus 5% gives you a valid range of 56.8% to 66.8%, so 59.2% qualifies. Now you need to find C, verify it retraces between 38.2% and 88.6% of AB, then locate D and confirm the XAD retracement lands at 78.6% within tolerance. By the time you have measured all three Fibonacci relationships and decided the pattern is valid, the D-point entry has already moved away from the optimal zone.
Now multiply that by twenty symbols across nine timeframes. The Gartley is the most widely traded harmonic pattern in existence -- the grandfather of every XABCD structure that followed -- but its reliance on the precise 61.8% golden ratio at the B point makes it demanding to identify correctly. Each potential Gartley requires locating five confirmed swing points in the correct alternating sequence, then measuring and validating three separate Fibonacci ratios against strict criteria. Manual scanning for Gartley patterns across a full watchlist is not just slow; it is operationally unfeasible.
The fundamental problem is not understanding the pattern. Most traders who study harmonic analysis can describe the Gartley structure and its Fibonacci requirements from memory. The problem is that no human can scan 180 chart combinations in real time, identify every valid five-point XABCD formation, validate three ratio conditions simultaneously, and act on them before the entry window at point D closes. You need a system that performs the geometric analysis for you -- continuously, automatically, and across your entire watchlist.
I built the Gartley Harmonic Dashboard to solve this exact problem. It scans up to 20 symbols across nine timeframes, identifies confirmed swing pivots, constructs potential Gartley XABCD patterns, validates them against three Fibonacci ratio checks with configurable tolerance, and presents every valid pattern in a compact six-column dashboard with real-time alerts. No manual measuring. No missed patterns. One glance tells you which symbols have active Gartley harmonic setups right now.
The indicator is available on the MQL5 Market for both platforms:
- MetaTrader 5: Gartley Harmonic Dashboard MT5
- MetaTrader 4: Gartley Harmonic Dashboard MT4
2. What Is Harmonic Pattern Trading?
Harmonic pattern trading is a methodology based on the idea that price movements form geometric structures defined by specific Fibonacci ratios between their legs. When those ratios align within acceptable tolerances, they identify high-probability reversal zones where price is statistically likely to change direction.
The concept originated with H.M. Gartley, who in 1935 published Profits in the Stock Market -- a groundbreaking work that described a specific five-point price pattern offering favorable risk-to-reward entries. Gartley observed that certain price formations recurred with remarkable regularity and that trades taken at the completion point of these formations had a high success rate. However, Gartley's original description lacked the precise Fibonacci measurements that would later define the pattern bearing his name.
Larry Pesavento was the first to apply strict Fibonacci ratios to Gartley's original price pattern, transforming it from a visual formation into a mathematically defined structure. His work in the 1990s established the connection between the pattern's swing points and specific Fibonacci retracement and extension levels. Then Scott Carney systematized the entire harmonic trading methodology, publishing a series of books beginning in the late 1990s that codified the Gartley pattern with exact ratio requirements and expanded the harmonic family to include the Bat, Butterfly, Crab, and other structures. Carney's contribution was to define the Gartley's B point at the 61.8% golden ratio retracement and the D point at the 78.6% XAD retracement -- the specific numbers that traders use today.
The Gartley pattern holds a unique position in harmonic trading as the first and most widely recognized of all XABCD structures. Every harmonic pattern that came after it -- the Bat, Butterfly, Crab, and their variants -- is essentially a modification of the original Gartley geometry with different Fibonacci ratios. Understanding the Gartley is therefore foundational to understanding the entire harmonic pattern family.
What makes harmonic patterns different from standard chart patterns like head and shoulders or double tops is their mathematical precision. A head and shoulders pattern is identified visually -- there is no universally agreed-upon ratio defining how deep the neckline should be relative to the head. Harmonic patterns, in contrast, require specific Fibonacci relationships between each leg. A pattern either meets the ratio criteria or it does not. This binary validation removes much of the subjectivity from pattern identification.
Why do these geometric structures repeat? The Fibonacci sequence and its derived ratios (0.382, 0.50, 0.618, 0.786, 0.886, 1.272, 1.618, 2.618) appear throughout natural systems. In financial markets, these ratios manifest in the way crowds of traders react to price swings. Retracements tend to find support or resistance at Fibonacci levels because large numbers of participants use these same ratios for entries, stops, and targets. The self-reinforcing nature of this behavior is what gives harmonic patterns their predictive power. The Gartley pattern, with its 61.8% golden ratio at the B point, taps directly into the most widely watched Fibonacci level in all of technical analysis.
3. The Gartley Pattern Explained
The Gartley pattern consists of five consecutive swing points -- labeled X, A, B, C, and D -- that form a specific geometric structure with three Fibonacci relationships between its legs. Unlike the Bat pattern which requires four ratio checks (including a BCD extension), the Gartley uses only three ratio validations: XAB, ABC, and XAD. There is no BCD extension check.
There are two types of Gartley patterns:
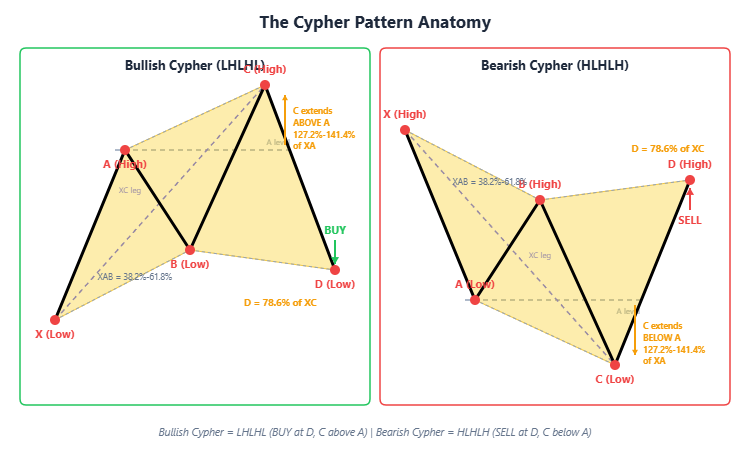
Bullish Gartley (LHLHL -- Low, High, Low, High, Low)
In a bullish Gartley, the five points form this structure:
- X is a swing low -- the starting point of the pattern
- A is a swing high -- price rises from X to A (this is the XA leg)
- B is a swing low -- price retraces downward from A, and B must remain above X. B sits at the 61.8% golden ratio retracement of XA
- C is a swing high -- price moves upward from B, but C must be lower than A
- D is a swing low -- price drops from C to D, and D must be above X
The D point is where the pattern completes, and it represents a BUY entry. The logic is that price has completed a measured retracement of the XA leg (78.6%) and is now at a statistically significant support level defined by the convergence of three Fibonacci relationships. The requirement that D remains above X is critical -- it means the original XA impulse has not been fully reversed, preserving the bullish bias.
Bearish Gartley (HLHLH -- High, Low, High, Low, High)
In a bearish Gartley, the structure mirrors the bullish version:
- X is a swing high -- the starting point
- A is a swing low -- price drops from X to A
- B is a swing high -- price retraces upward from A, and B must remain below X. B sits at the 61.8% golden ratio retracement of XA
- C is a swing low -- price moves downward from B, but C must be higher than A
- D is a swing high -- price rises from C to D, and D must be below X
The D point completes the pattern and signals a SELL entry. Price has retraced 78.6% of the XA leg to a Fibonacci-defined resistance zone. The requirement that D remains below X confirms the bearish structure is intact.
The key features that distinguish the Gartley from other harmonic patterns are twofold. First, the B point must sit at the 61.8% golden ratio retracement of XA -- this is a fixed ratio with a narrow tolerance, not a wide range like the Bat's 38.2%-50% XAB window. Second, the XAD retracement at 78.6% is shallower than the Bat's 88.6%, meaning the D-point completion zone does not push as close to the X level. The Gartley's shallower D point gives the pattern a slightly different risk profile: the stop loss beyond X is further from the entry, but the pattern tends to complete more frequently because it does not require as deep a retracement.
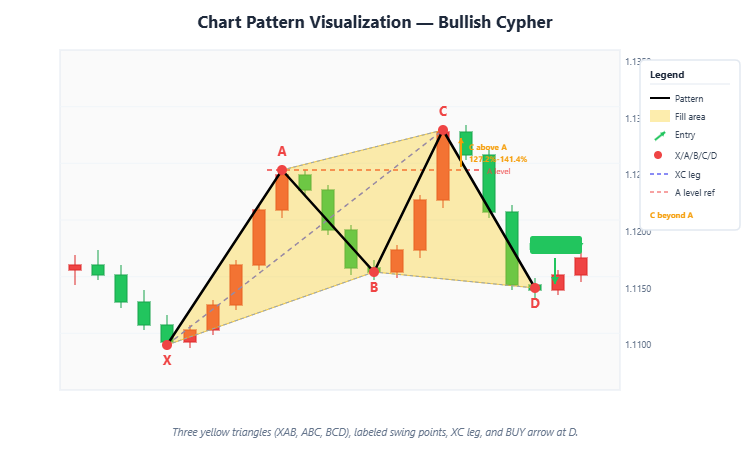
Figure 1. Bullish Gartley forms as LHLHL with BUY at D (above X); Bearish Gartley forms as HLHLH with SELL at D (below X).
4. Fibonacci Ratios: The Validation Engine
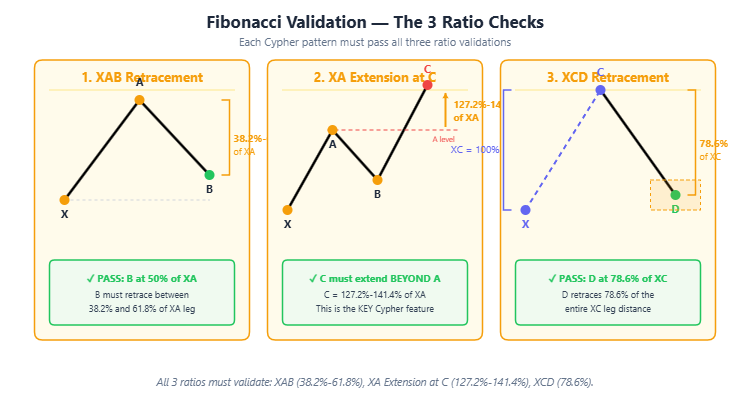
The Fibonacci ratios are what transform a random five-point price swing into a validated Gartley harmonic pattern. Without ratio validation, you would be trading every zigzag in price, and most of those would be meaningless noise. The Gartley pattern requires three separate ratio checks -- one fewer than the Bat pattern, which adds a BCD extension check. This makes the Gartley structurally simpler to validate, though the fixed 61.8% XAB ratio imposes its own strict requirement.
XAB Retracement -- The Golden Ratio (B retraces 61.8% of XA)
The XAB retracement is the signature ratio of the Gartley pattern:
XAB Retracement = |B - A| / |A - X|
The target ratio is 0.618 -- the golden ratio -- with a configurable tolerance of plus or minus 5% (default). This means the effective valid range is:
Effective XAB Min = 0.618 x (1 - 0.05) = 0.568
Effective XAB Max = 0.618 x (1 + 0.05) = 0.668
This is fundamentally different from other harmonic patterns. The Bat allows XAB anywhere from 38.2% to 50% -- a wide range. The Gartley demands that B land precisely at the golden ratio, the most important number in all of Fibonacci analysis. The 61.8% level is the ratio of consecutive Fibonacci numbers as the sequence approaches infinity, and it is the single most watched retracement level among technical traders worldwide. When B lands at this level, it means the initial XA impulse was strong enough that the pullback respected the golden ratio -- a sign of structural integrity in the price movement.
ABC Retracement (C retraces 38.2%-88.6% of AB)
The ABC retracement measures how much of the AB leg is retraced by the move from B to C:
ABC Retracement = |C - B| / |B - A|
The valid range is 0.382 to 0.886. This is a wide range that accommodates various market conditions. A shallow ABC retracement (near 38.2%) suggests the counter-move at C was modest, while a deep retracement (near 88.6%) indicates a strong corrective move. Both extremes can produce valid Gartley patterns as long as the remaining ratios also validate. The C point must also satisfy the structural constraint of remaining below A in a bullish pattern (or above A in a bearish pattern).
XAD Retracement -- The Completion Ratio (D retraces 78.6% of XA)
The XAD retracement defines where the pattern completes:
XAD Retracement = |D - A| / |A - X|
The target ratio is 0.786, with a configurable tolerance of plus or minus 5% (default). This means the effective valid range is:
Effective XAD Min = 0.786 x (1 - 0.05) = 0.7467 Effective XAD Max = 0.786 x (1 + 0.05) = 0.8253
The 78.6% level is the square root of 0.618 (the golden ratio), making it a mathematically significant Fibonacci number in its own right. This ratio places the D point at a shallower retracement than the Bat's 88.6%, meaning the Gartley completes before price has retraced as deeply into the XA leg. The D point must remain above X (bullish) or below X (bearish), which is guaranteed by the 78.6% retracement since it does not reach the full 100% of XA.
Why Only Three Ratios?
The Gartley does not use a BCD extension check. Unlike the Bat pattern, which validates the relationship between the BC and CD legs (requiring 161.8%-261.8% extension), the Gartley relies on the XAD retracement alone to define the D point location. The fixed 61.8% XAB ratio and the 78.6% XAD ratio together constrain the geometry tightly enough that an additional BCD check is unnecessary. This three-ratio validation is the standard Gartley definition used by Scott Carney and adopted by the broader harmonic trading community.
Figure 2. A valid Gartley pattern requires three Fibonacci ratios: XAB (0.618 with 5% tolerance), ABC (0.382-0.886), and XAD (0.786 with 5% tolerance).
5. Why Manual Pattern Scanning Fails
Even experienced harmonic traders face three critical operational problems when scanning for Gartley patterns manually. While the Gartley requires only three ratio checks instead of the Bat's four, the fixed 61.8% XAB ratio actually makes manual identification harder in practice because it demands precision at the very first ratio measurement.
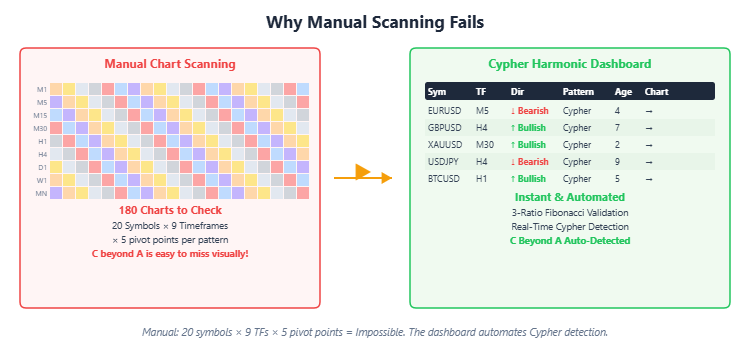
Problem 1: Volume of Chart Combinations
A typical multi-asset trader monitors 20 symbols -- major and minor forex pairs, gold, silver, crypto assets, and indices. With nine available timeframes (M1 through Monthly), that produces 180 possible chart combinations. Scanning each chart for five-point Gartley patterns requires identifying alternating swing highs and lows, then measuring three separate Fibonacci ratios -- starting with the critical 61.8% XAB check that either qualifies or disqualifies the candidate immediately. At even 40 seconds per chart, a full scan takes two hours -- by which time the majority of the setups you were looking for have already played out or disappeared entirely.
Problem 2: The Golden Ratio Precision Problem
The Gartley's 61.8% XAB requirement creates a unique challenge for manual scanners. Unlike the Bat, where B can fall anywhere in a 38.2%-50% range (an 18 percentage point window), the Gartley demands B at 61.8% with only a 10 percentage point tolerance window (56.8%-66.8%). This narrow target means most five-point structures fail at the very first ratio check. A trader can spend minutes setting up the Fibonacci tool, measuring the XAB retracement, and finding it reads 54% or 71% -- outside the valid range. After dozens of these false starts across multiple charts, fatigue and frustration cause the trader to either rush measurements (introducing errors) or abandon the scan entirely.
Problem 3: Real-Time Pattern Completion
Gartley patterns complete when the D point forms at the 78.6% XAD retracement. Because the Gartley's D point is shallower than the Bat's 88.6% D point, Gartley patterns tend to complete more frequently -- but the window between completion and optimal entry is still narrow. In fast-moving markets, the entry window can be just a few candles. If you are scanning EURUSD on the M15 chart when a valid bullish Gartley completes on XAUUSD H1, you miss the entry entirely. And because the stop loss is placed just beyond X, late entries after the D point significantly degrade your risk-to-reward ratio. There is no way to monitor 180 charts simultaneously with human eyes.
The result is that most harmonic traders either limit themselves to a handful of symbols and timeframes (missing the majority of Gartley setups) or spend so much time scanning that they cannot act on what they find. The scanning process itself becomes the bottleneck, not the strategy.
Figure 3. The dashboard automates Gartley pattern detection across 180 symbol-timeframe combinations, eliminating the manual scanning bottleneck.
6. Introducing the Gartley Harmonic Dashboard
The Gartley Harmonic Dashboard is a professional multi-symbol, multi-timeframe indicator that automates the entire Gartley harmonic pattern detection process. Instead of manually scanning 180 charts, identifying five swing points, and measuring three Fibonacci ratios by hand, you get a single dashboard that continuously monitors all your symbols across all enabled timeframes and alerts you the moment a valid Gartley pattern completes.
Core Features:
- Automated Gartley Detection -- Identifies both Bullish (LHLHL) and Bearish (HLHLH) Gartley patterns with full three-ratio Fibonacci validation (XAB, ABC, and XAD)
- 6-Column Dashboard -- Symbol, Timeframe, Direction, Pattern, Age, and one-click Chart navigation
- Multi-Symbol Scanning -- Monitor up to 20 instruments simultaneously (forex, metals, crypto, indices)
- Multi-Timeframe Coverage -- Scan M1 through Monthly (9 timeframes, individually toggleable)
- Non-Repainting Signals -- Patterns are based on confirmed swing pivots with right-bar validation
- Yellow Triangle Fill -- Completed patterns are drawn with filled yellow triangles and labeled X/A/B/C/D points
- 4-Channel Alerts -- Popup, sound, email, and push notifications with pattern details
- Golden Ratio Precision -- XAB validated at 0.618 with configurable tolerance, ensuring only true Gartley geometry
The indicator handles all the geometric analysis automatically. You configure your symbols, preferred timeframes, and Fibonacci tolerance ranges, and the dashboard does the rest -- scanning, measuring, validating, and alerting in real time.
Download the free demo or purchase the full version:
- MetaTrader 5: Gartley Harmonic Dashboard MT5
- MetaTrader 4: Gartley Harmonic Dashboard MT4
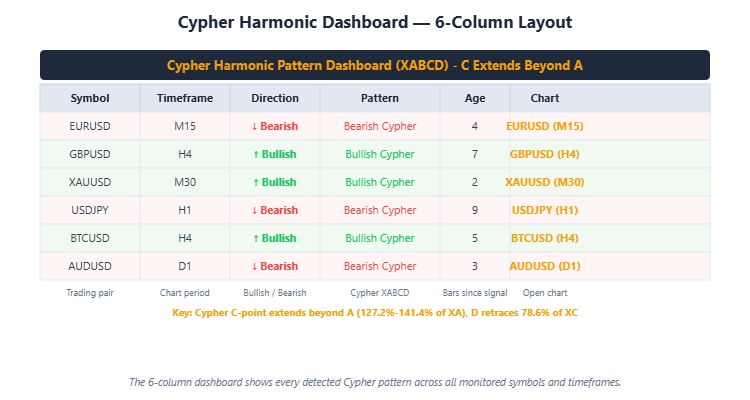
Figure 4. The 6-column dashboard shows every detected Gartley pattern across all monitored symbols and timeframes.
7. How the Detection Engine Works
The detection engine operates in three stages on every new bar: pivot identification, pattern construction, and Fibonacci validation.
Stage 1: Pivot Identification
The engine first identifies confirmed swing highs and swing lows across the price history. A swing high is a bar whose high is greater than the highs of a specified number of bars to its left and to its right. Similarly, a swing low is a bar whose low is lower than the lows of bars on both sides.
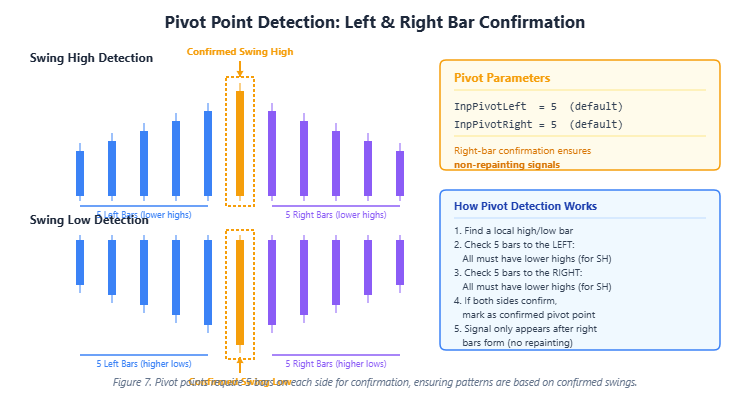
The key parameters are Pivot Left Bars and Pivot Right Bars , both defaulting to 5. This means a swing high requires 5 bars with lower highs on both the left and right sides before it is confirmed. This right-side confirmation is what makes the signals non-repainting -- a pivot cannot be identified until enough future bars have confirmed it.
Stage 2: Pattern Construction
Once pivots are identified, the engine searches for valid five-point alternating sequences:
-
For Bullish Gartley: it looks for a Low (X), then a subsequent High (A), then a Low (B) that is above X, then a High (C) that is lower than A, then a Low (D) that is above X. This LHLHL sequence ensures the correct Gartley geometry where the pattern has not violated the X level.
-
For Bearish Gartley: it looks for a High (X), then a subsequent Low (A), then a High (B) that is below X, then a Low (C) that is higher than A, then a High (D) that is below X. This HLHLH sequence mirrors the bullish structure.
The engine scans up to 500 bars of history (configurable via Max History Bars ) to find the most recent valid pattern for each symbol-timeframe combination.
Stage 3: Three-Ratio Fibonacci Validation
Every candidate pattern is validated against all three Fibonacci ratio criteria:
- Calculate XAB retracement: |B - A| / |A - X| -- must equal 0.618 within plus or minus 5% tolerance (effective range: 0.568 to 0.668)
- Calculate ABC retracement: |C - B| / |B - A| -- must fall within [0.382, 0.886]
- Calculate XAD retracement: |D - A| / |A - X| -- must equal 0.786 within plus or minus 5% tolerance (effective range: 0.7467 to 0.8253)
There is no BCD extension check. The Gartley validation requires only these three ratios.
Only patterns that pass all three ratio checks are displayed on the dashboard. This rigorous three-gate validation ensures that every signal represents a geometrically valid Gartley harmonic structure -- not just any random five-point zigzag in price. The fixed 61.8% XAB requirement is particularly effective as a filter because it immediately eliminates the vast majority of five-point price structures that fail to place B at the golden ratio.
Non-Repainting Guarantee
The indicator evaluates only confirmed pivots -- pivots where the required number of right-side bars have already formed. Because the D point must be a confirmed pivot (with Pivot Right Bars bars to its right), the signal cannot appear until the pattern is fully confirmed. Once displayed, it never changes or disappears.
8. The 6-Column Dashboard
The dashboard presents all detected Gartley patterns in a compact, scrollable table with six columns:
| Column | Content | Description |
|---|---|---|
| Symbol | e.g., EURUSD | The instrument where the pattern was detected |
| Timeframe | e.g., H1, M15 | The chart timeframe of the pattern |
| Direction | Bullish / Bearish | Green for Bullish (BUY at D), Red for Bearish (SELL at D) |
| Pattern | Gartley | The pattern type |
| Age | e.g., 3 | Number of bars since the pattern completed |
| Chart | Click to navigate | Opens the corresponding chart for visual confirmation |
The dashboard displays in a separate indicator window below your main chart. It supports scrolling when there are more signals than visible rows (configurable, default 12 rows). Each row is color-coded by direction -- green background tint for Bullish, red for Bearish -- making it easy to scan for the type of setup you want.
Clicking the Chart column on any row switches your main chart to that symbol and timeframe, where the full Gartley pattern is drawn with yellow triangle fills, X/A/B/C/D labels, and a BUY ENTRY or SELL ENTRY arrow at the D point. The dashed lines connecting X-B, A-C, B-D, and X-D visually decompose the five-point structure into its component relationships, making it easy to see the geometric framework at a glance.
The Age column tells you how fresh each signal is. An age of 1 means the pattern just completed on the most recent confirmed bar. Higher ages indicate older patterns that may still be valid if price has not moved significantly from the D point.
Figure 5. The indicator draws yellow-filled triangles, labels each swing point, and places BUY/SELL arrows at point D with dashed internal lines (X-B, A-C, B-D, X-D).
9. 4-Channel Alert System
The Gartley Harmonic Dashboard supports four independent alert channels, any combination of which can be enabled simultaneously:
| Channel | Parameter | Default | Description |
|---|---|---|---|
| Popup | Enable Popup Alerts | ON | Standard MetaTrader popup dialog |
| Sound | Enable Sound Alerts | ON | Plays a WAV file (default: alert2.wav) |
| Enable Email Alerts | OFF | Sends to the email configured in MT4/MT5 settings | |
| Push | Enable Push Notifications | ON | Sends to MetaTrader mobile app |
Alert Message Format:
When a new Gartley pattern is detected, the alert message includes the essential details:
Gartley Harmonic Dashboard: EURUSD BULLISH GARTLEY (BUY) pattern on H1
The message tells you the symbol, pattern direction (Bullish or Bearish), the trading action (BUY or SELL), and the timeframe. This gives you enough information to immediately pull up the chart and evaluate the setup.
Alerts fire only once per pattern per symbol-timeframe combination to prevent duplicate notifications. The alert title is configurable via the Alert Title parameter, which defaults to "Gartley Harmonic Dashboard".
For email and push notifications to work, you need to configure the respective settings in your MetaTrader terminal options (Tools > Options > Notifications for push, Tools > Options > Email for email).
10. Practical Trading Workflow
Here is a systematic six-step workflow for trading with the Gartley Harmonic Dashboard:
Step 1: Setup
Configure the indicator with your preferred symbols (up to 20) and enable the timeframes you trade. Set your Fibonacci tolerances based on how strict you want pattern validation to be. Pay particular attention to the XAB tolerance -- the default 5% works well for most instruments, requiring B to land between 56.8% and 66.8% of XA. For higher-quality signals, tighten to 3%. For more pattern detection on volatile instruments like crypto, widen to 8%.
Step 2: Scan
Let the dashboard run. It continuously monitors all symbol-timeframe combinations and populates the table with every valid Gartley pattern it detects. Fresh patterns appear with low Age values. The three-ratio validation ensures that every pattern in the table is a geometrically valid Gartley with the golden ratio at the B point -- not just a five-point zigzag.
Step 3: Validate the Fibonacci Ratios
When a new pattern appears (Age = 1 or 2), note the direction. Bullish Gartley patterns indicate a BUY opportunity at the D point. Bearish Gartley patterns indicate a SELL opportunity. The dashboard has already validated all three Fibonacci ratios (XAB, ABC, and XAD), but you can click through to the chart to visually confirm the structure and check the golden ratio precision at the B point.
Step 4: Confirm on Chart
Click the Chart column to open the corresponding chart. Verify that the yellow triangles and five labeled points (X, A, B, C, D) form a clean Gartley structure. Check that the X-A-B-C-D sequence follows the correct alternating pattern. Look for additional confluence -- does the D point align with a support/resistance level, a round number, a moving average, or a higher-timeframe structure? The 78.6% XAD retracement level is already a significant Fibonacci zone, and confluence with other technical levels strengthens the setup.
Step 5: Enter the Trade
If the pattern passes your visual confirmation:
- For a Bullish Gartley (BUY): Enter long near the D point. Place your stop loss below X by a buffer (e.g., 1x ATR below X). Set take profit at the B level initially, with an extended target at the A level. The distance from D to X defines your risk, and the Gartley's 78.6% XAD ratio means this distance is wider than for a Bat pattern (which uses 88.6%), so size your position accordingly.
- For a Bearish Gartley (SELL): Enter short near the D point. Place your stop loss above X by a buffer. Set take profit at the B level or the A level, depending on your risk-reward preference.
Step 6: Manage the Position
Monitor the trade. Gartley patterns produce reversals from the D point as price moves away from the 78.6% XAD zone. Consider moving your stop to breakeven once price has moved in your favor by 1R (one times your initial risk). The natural targets at B and A provide logical levels for scaling out of the position. Because the Gartley's D point is shallower than the Bat's, the initial reversal move from D back toward C and B can be swift and decisive.
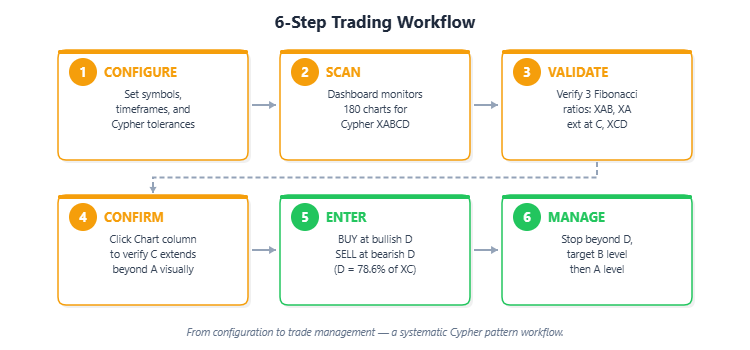
Figure 6. From setup to trade management -- a systematic workflow using the Gartley Harmonic Dashboard.
11. Real Trade Examples
The following examples are taken from live charts with the Gartley Harmonic Dashboard active. Each screenshot shows the completed pattern with yellow triangle fills, X/A/B/C/D labels, and the dashboard running in the indicator window.
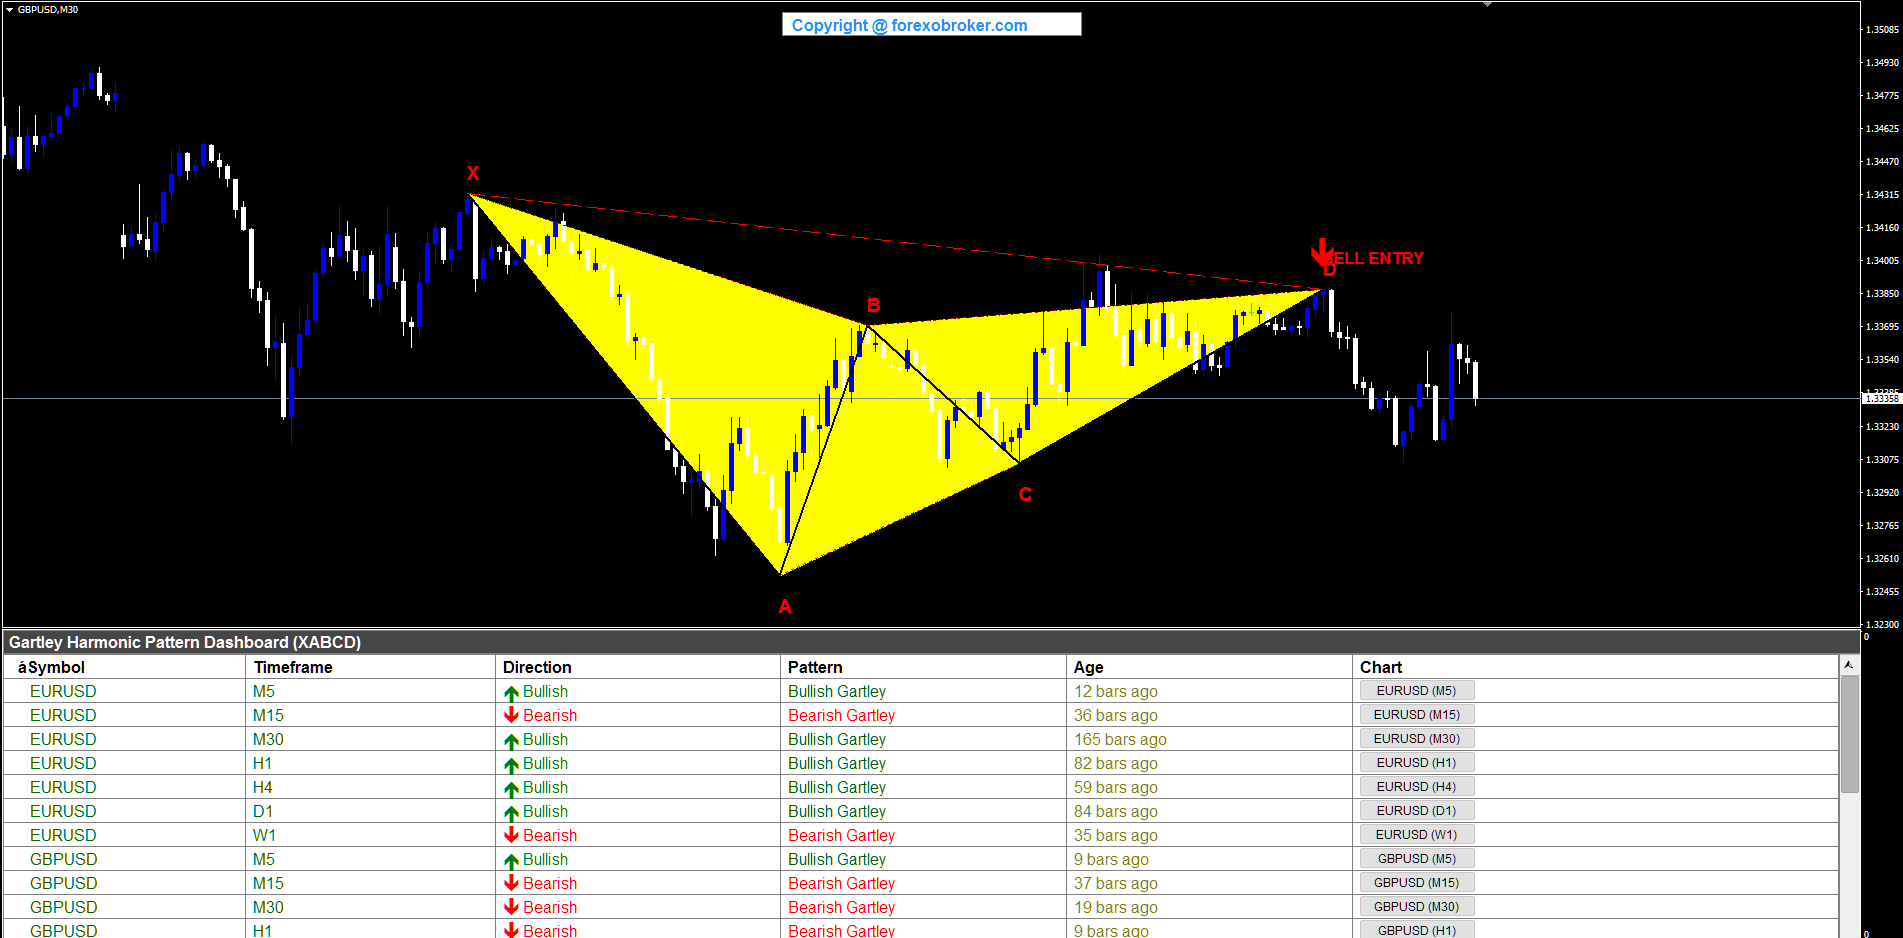
GBPUSD M30 -- Bearish Gartley
Cable on the M30 timeframe produced a bearish Gartley signaling a short-term reversal opportunity. X formed at a swing high, with A dropping to a swing low below. B retraced upward to the 61.8% golden ratio retracement of XA, sitting below X as required for a bearish structure. C pulled back lower but remained above A, and D completed at a swing high near the 78.6% XAD retracement level -- below X. The SELL ENTRY arrow at D confirmed the short opportunity. The dashboard displayed the GBPUSD M30 row with Bearish direction in red, and the dashed internal lines (X-B, A-C, B-D, X-D) clearly outlined the HLHLH sequence.
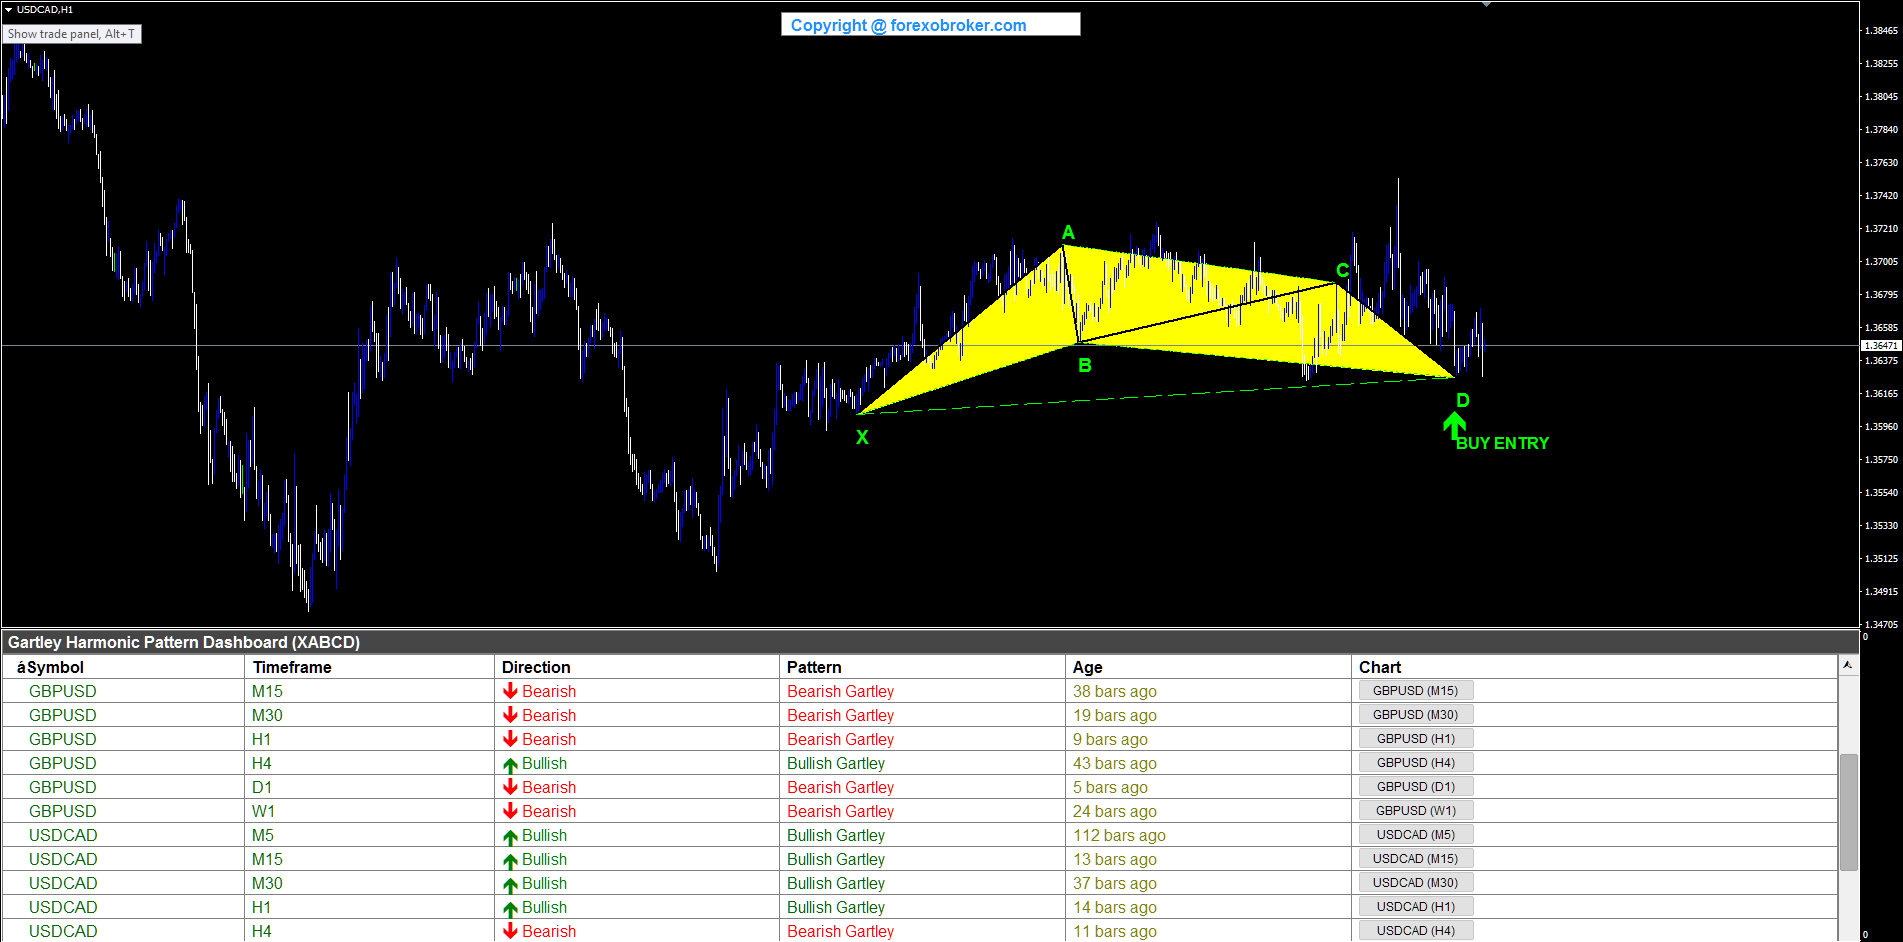
USDCAD H1 -- Bullish Gartley
USDCAD on the hourly chart formed a bullish Gartley suitable for intraday swing trading. X was identified at a swing low, A at a swing high above. B retraced downward to the 61.8% retracement of XA, remaining above X. C pushed higher but stayed below A, and D completed at a swing low at the 78.6% XAD retracement -- above X. The BUY ENTRY at D offered a long entry at a Fibonacci-defined support zone where the golden ratio at B and the 78.6% XAD retracement converged to define valid Gartley geometry. The dashboard showed USDCAD alongside other symbols, demonstrating the multi-symbol scanning across the H1 timeframe.
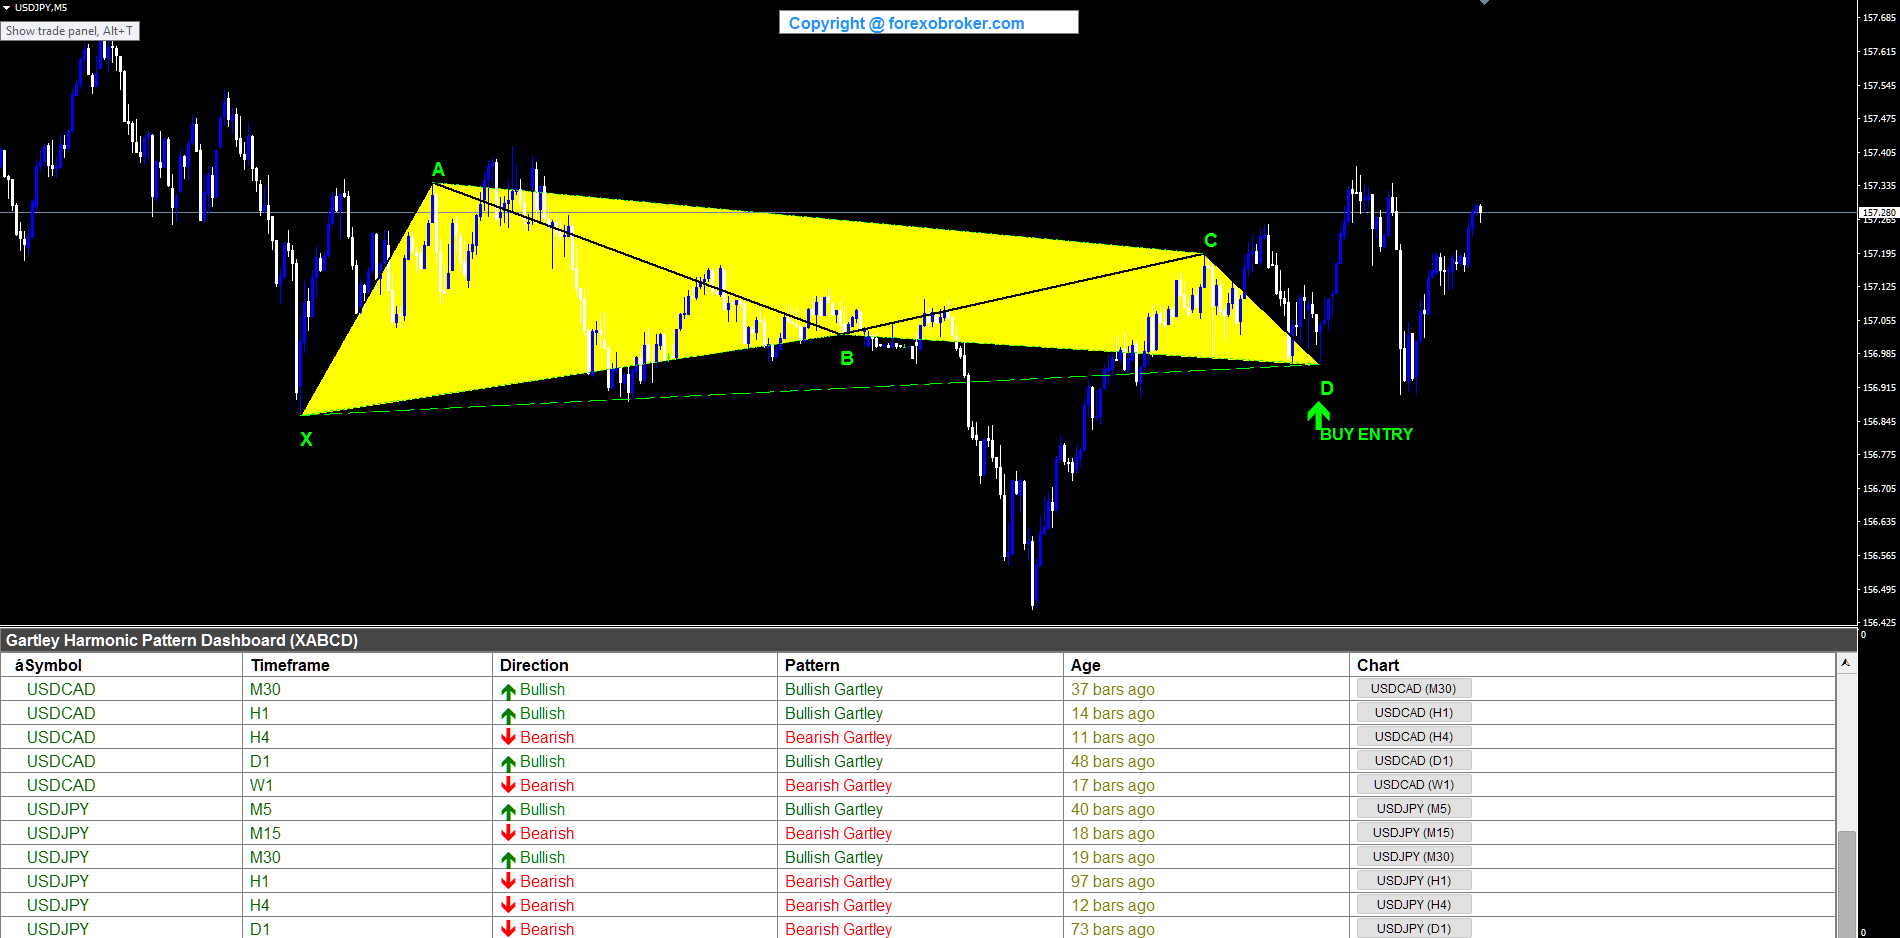
USDJPY M5 -- Bullish Gartley
The yen pair on the M5 chart produced a compact bullish Gartley suitable for forex scalping. X formed at a swing low, A at a nearby swing high. B retraced to the golden ratio level, C rose but stayed below A, and D completed at the 78.6% XAD retracement. The tight price range on the M5 timeframe meant the pattern was compact, but all three Fibonacci ratios validated correctly. The BUY ENTRY signal at D appeared with a low Age value, and the dashboard captured this fast-timeframe setup alongside detections on higher timeframes.
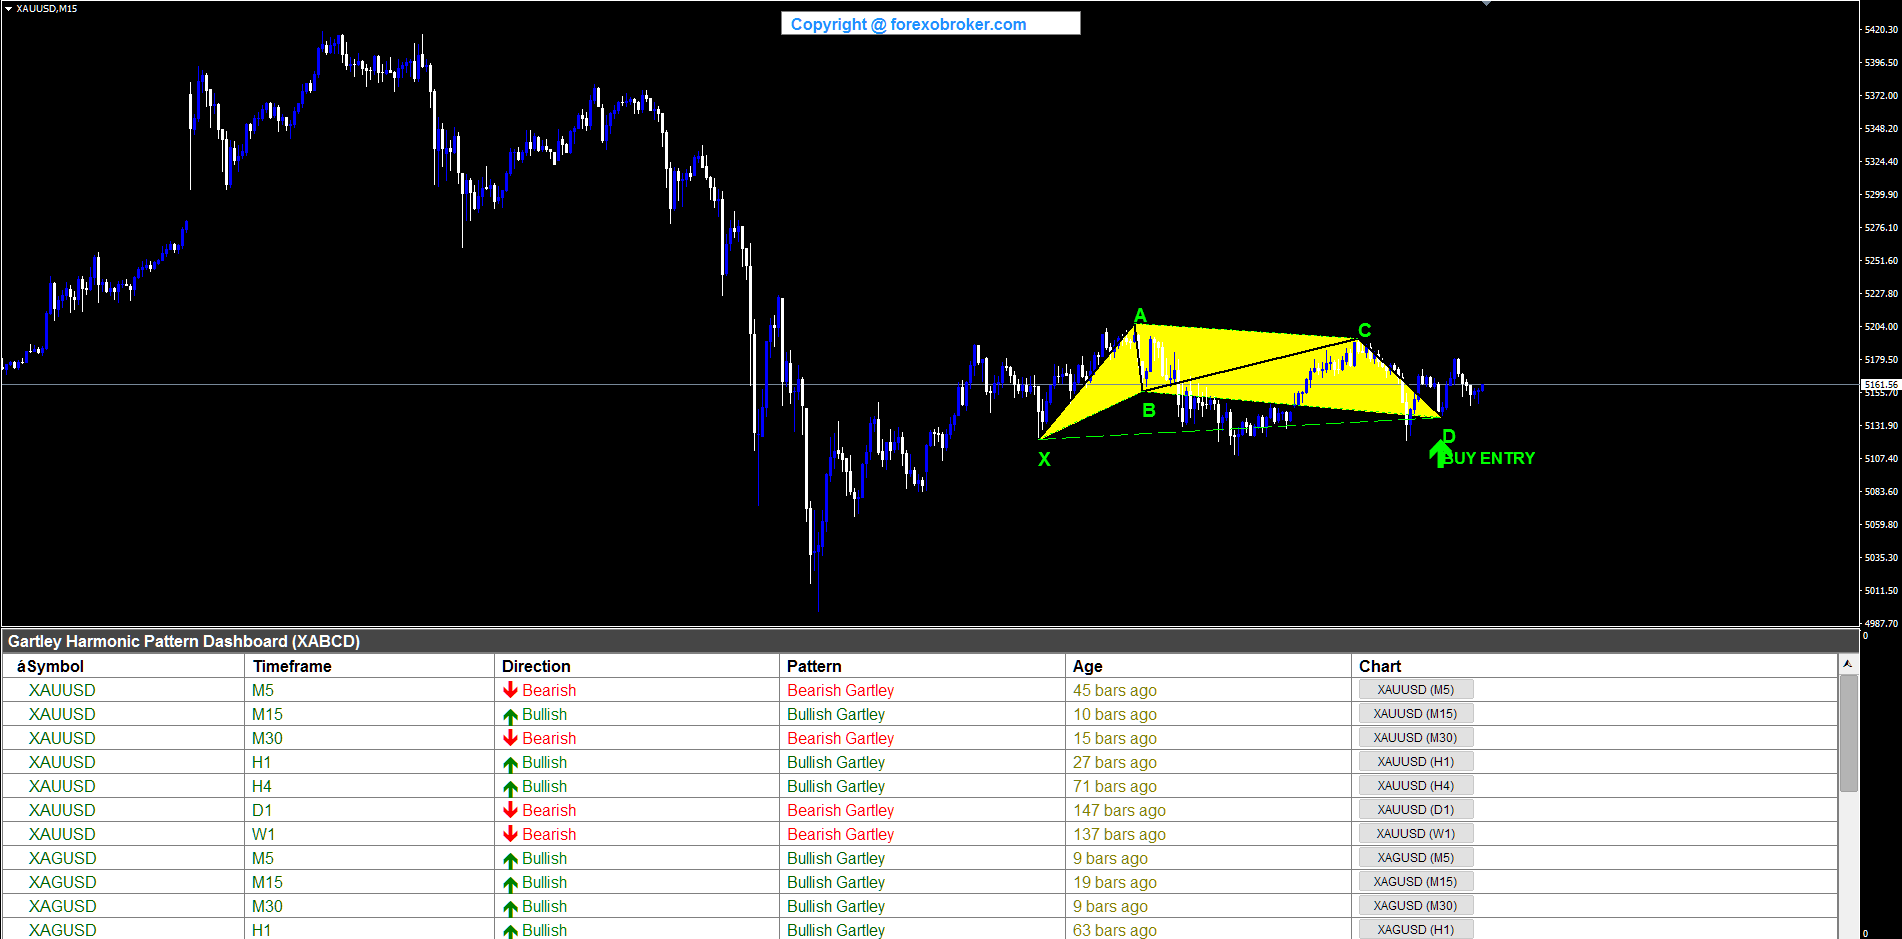
XAUUSD M15 -- Bullish Gartley
Gold on the M15 chart displayed a bullish Gartley with the five-point structure forming over several hours of price action. X established at a swing low, A surged to a swing high. B retraced to the 61.8% level of XA, C pushed higher but remained below A, and D completed at the 78.6% XAD retracement. The BUY ENTRY at D offered a long entry on gold at a Fibonacci-validated support zone. The yellow triangle fills were prominently visible on the chart, and the pattern provided a clear long opportunity with the stop loss below X and targets at the B and A levels.
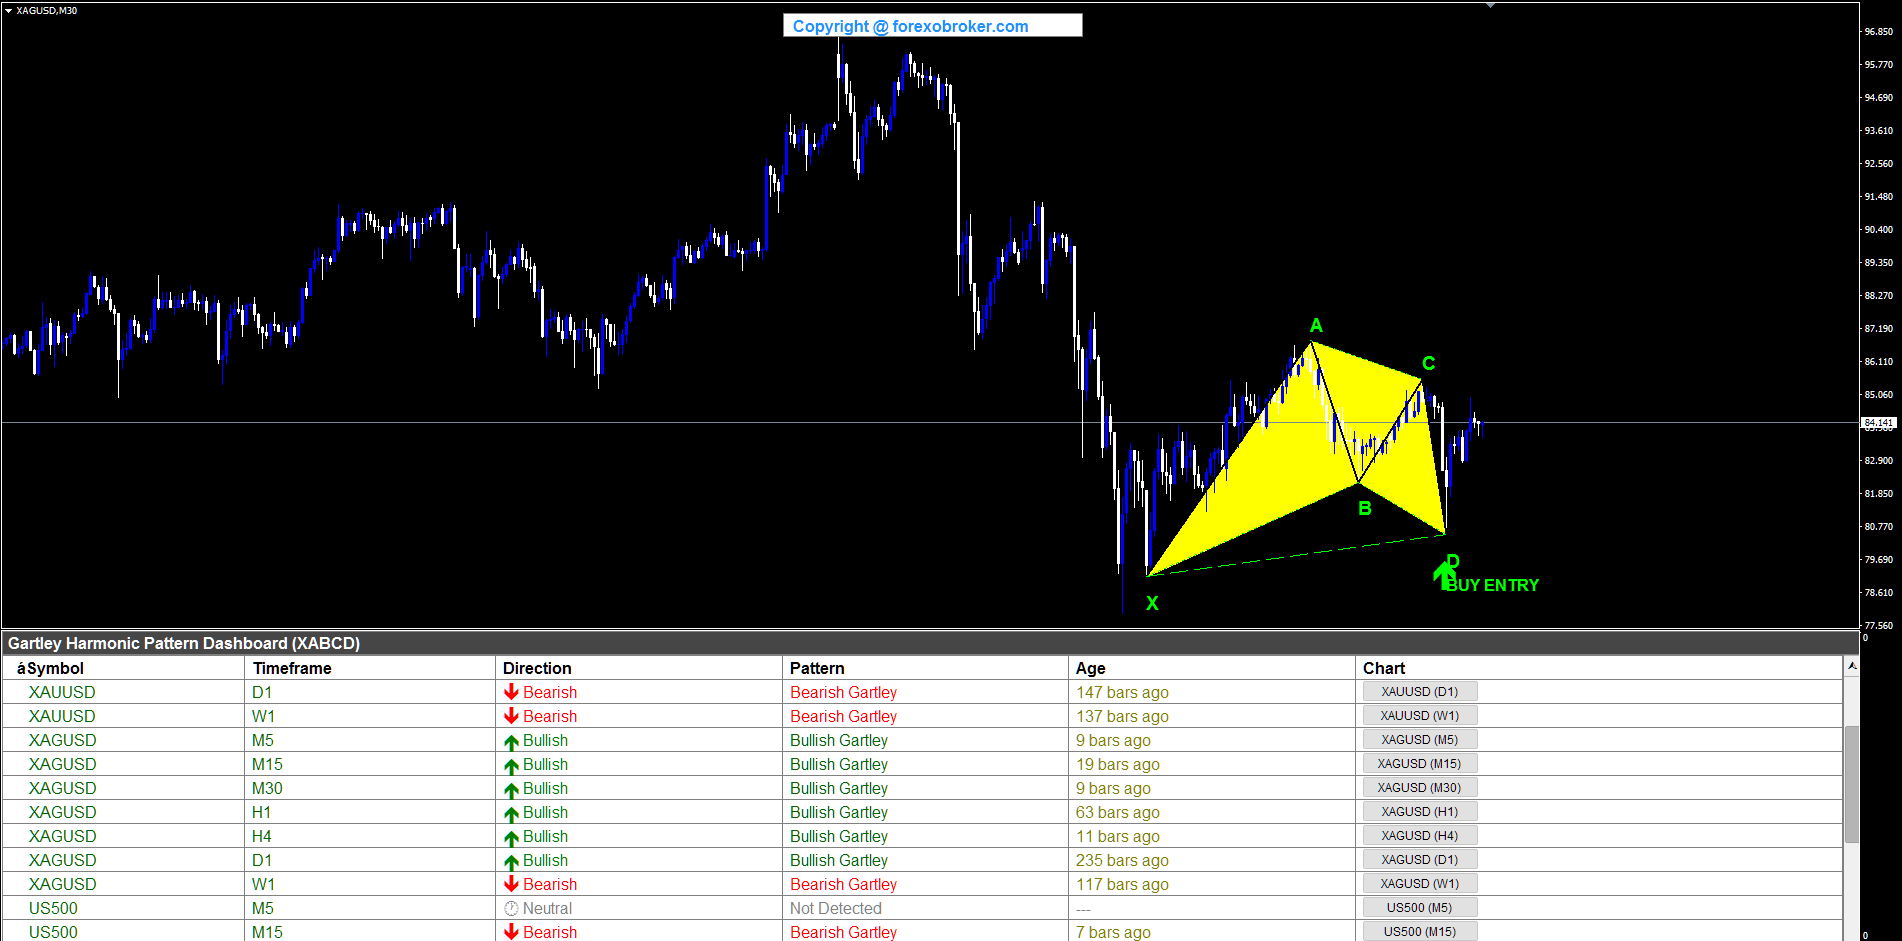
XAGUSD M30 -- Bullish Gartley
Silver on the M30 timeframe formed a bullish Gartley covering a substantial price range. X was identified at a swing low, A reached a swing high above. B retraced to the golden ratio retracement of XA, C climbed but stayed below A, and D completed at the 78.6% XAD level. The large distance between X and A produced visually striking yellow triangles across the chart. The BUY ENTRY at D offered a long opportunity on silver with well-defined risk parameters -- stop below X and targets at B and A levels.
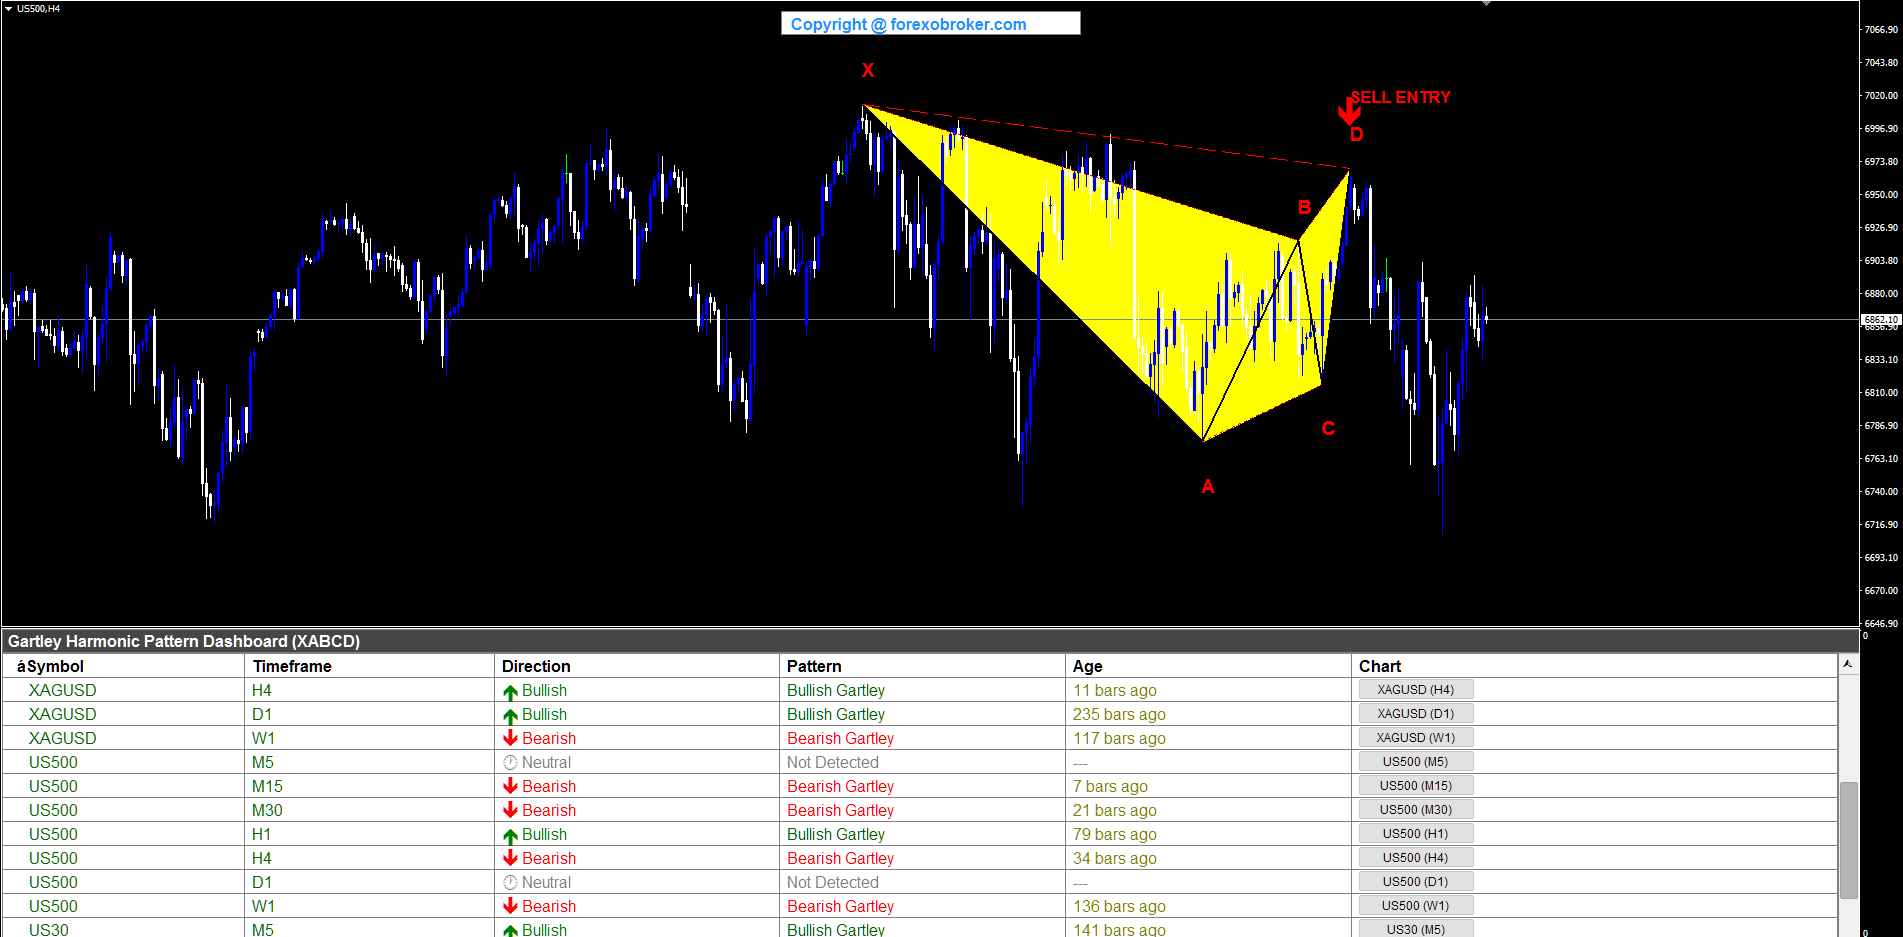
US500 H4 -- Bearish Gartley
The S&P 500 index on the H4 chart produced a bearish Gartley representing a higher-timeframe swing reversal opportunity. X formed at a swing high, A at a swing low. B retraced upward to the 61.8% golden ratio of XA, staying below X. C dropped but remained above A, and D completed at a swing high at the 78.6% XAD retracement -- below X. The SELL ENTRY at D signaled a short entry on the index at a Fibonacci-defined resistance zone. The H4 timeframe gave this pattern significant weight for position traders monitoring equity indices.
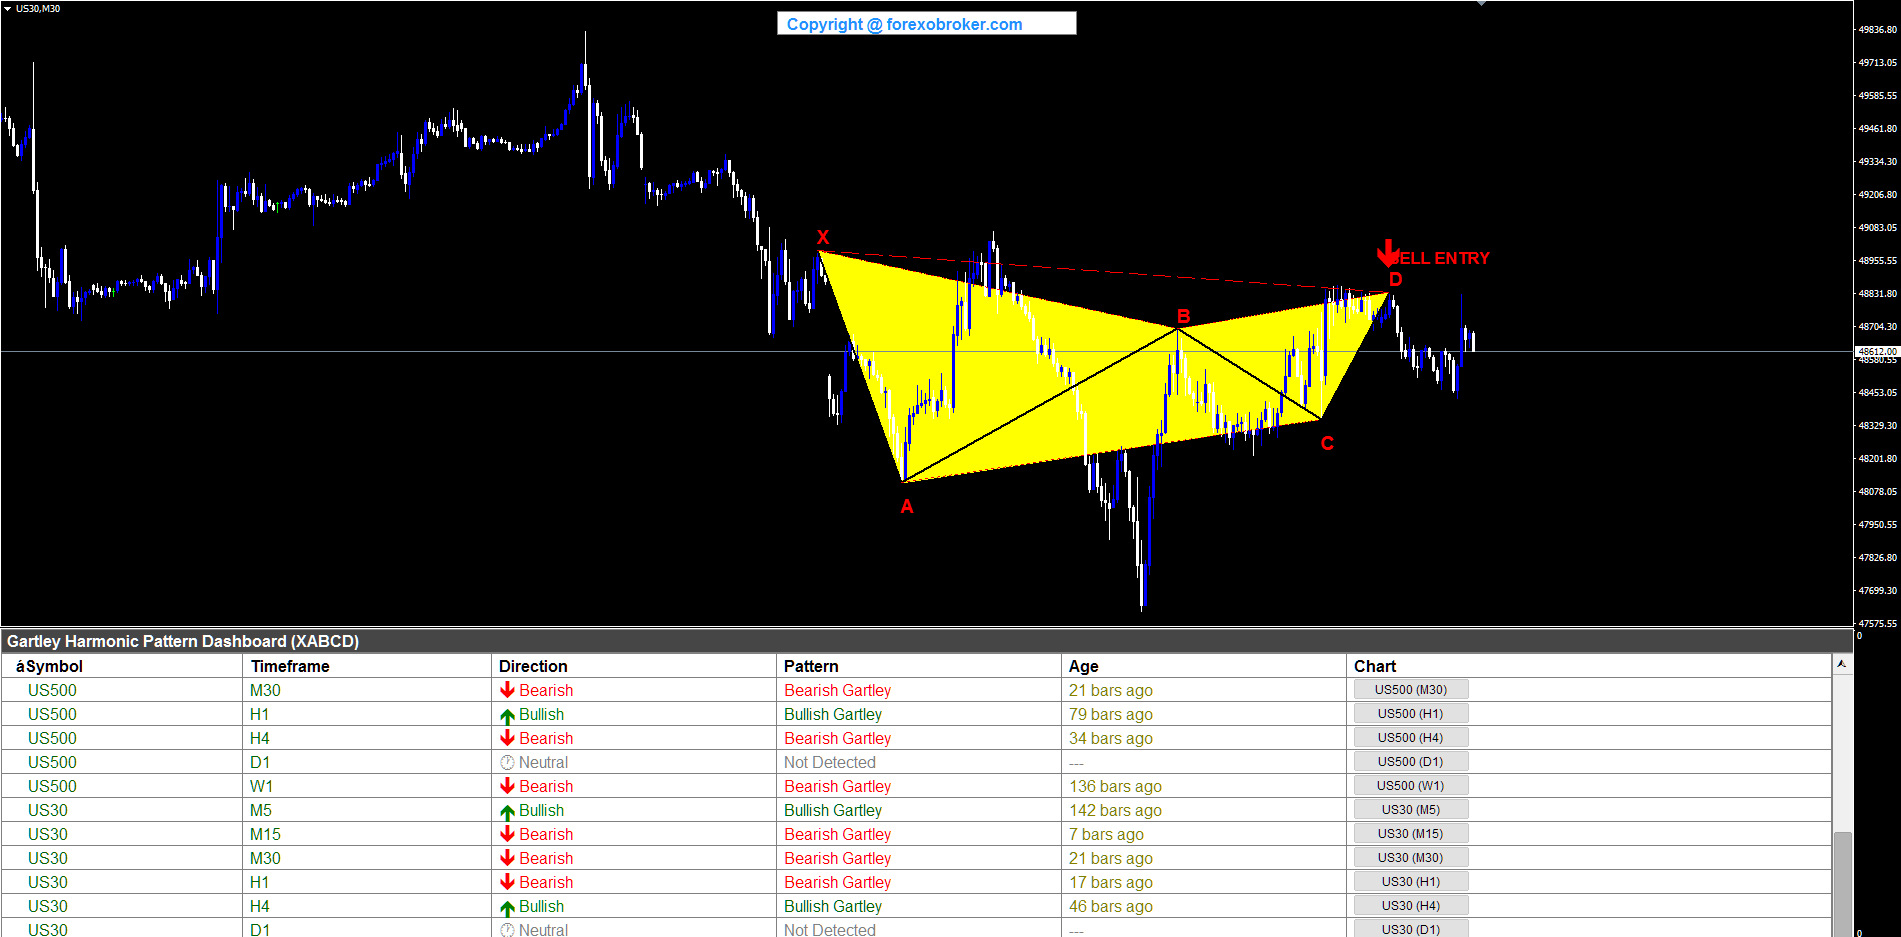
US30 M30 -- Bearish Gartley
The Dow Jones index on the M30 chart showed a bearish Gartley suitable for intraday index trading. X formed at a swing high, with the five-point HLHLH structure unfolding across multiple M30 bars. B landed at the critical 61.8% golden ratio retracement, and D completed at the 78.6% XAD level below X. The SELL ENTRY arrow confirmed the short setup, and the dashboard row displayed US30 with Bearish direction. The pattern demonstrated the indicator's effectiveness on equity indices alongside forex and metals.
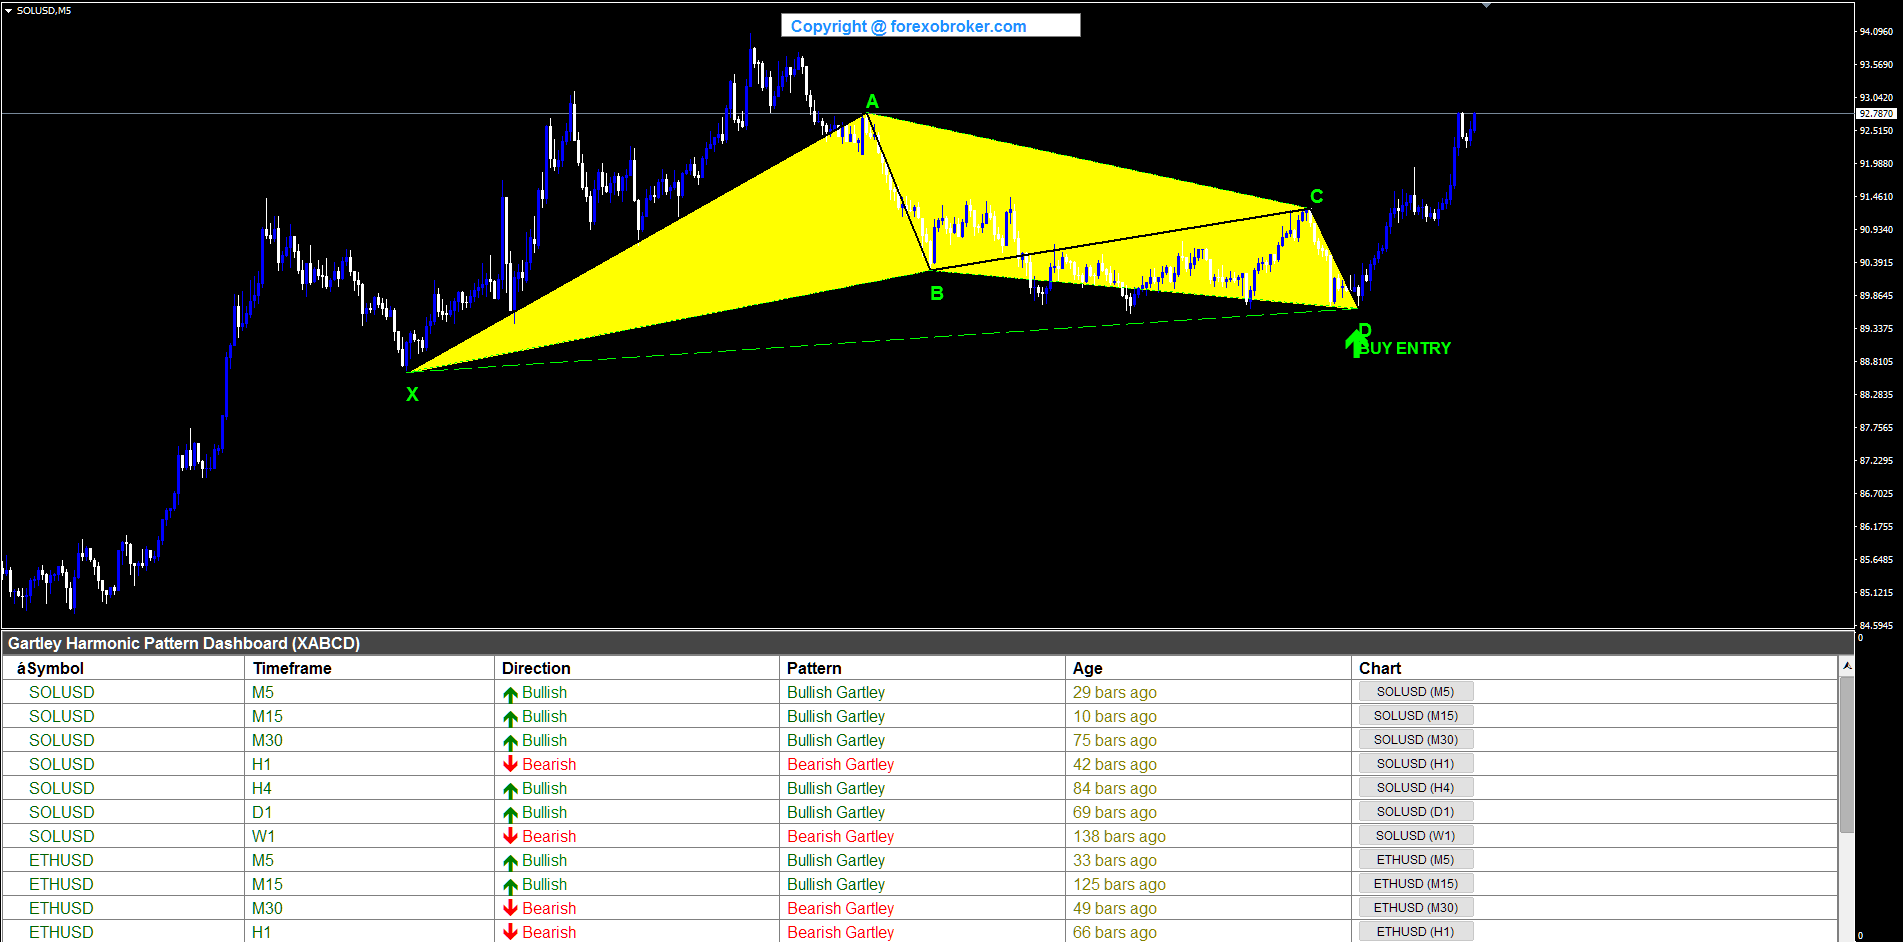
SOLUSD M5 -- Bullish Gartley
Solana on the M5 timeframe produced a compact bullish Gartley suitable for crypto scalping. The five-point LHLHL structure formed quickly on the fast timeframe, with B landing at the golden ratio retracement of XA and D completing at the 78.6% XAD level above X. The BUY ENTRY arrow appeared at D, and the yellow triangles outlined the Gartley geometry within a tight price range. The dashboard row confirmed SOLUSD on M5 with Bullish direction, demonstrating the indicator's ability to detect Gartley patterns on crypto assets at scalping timeframes.
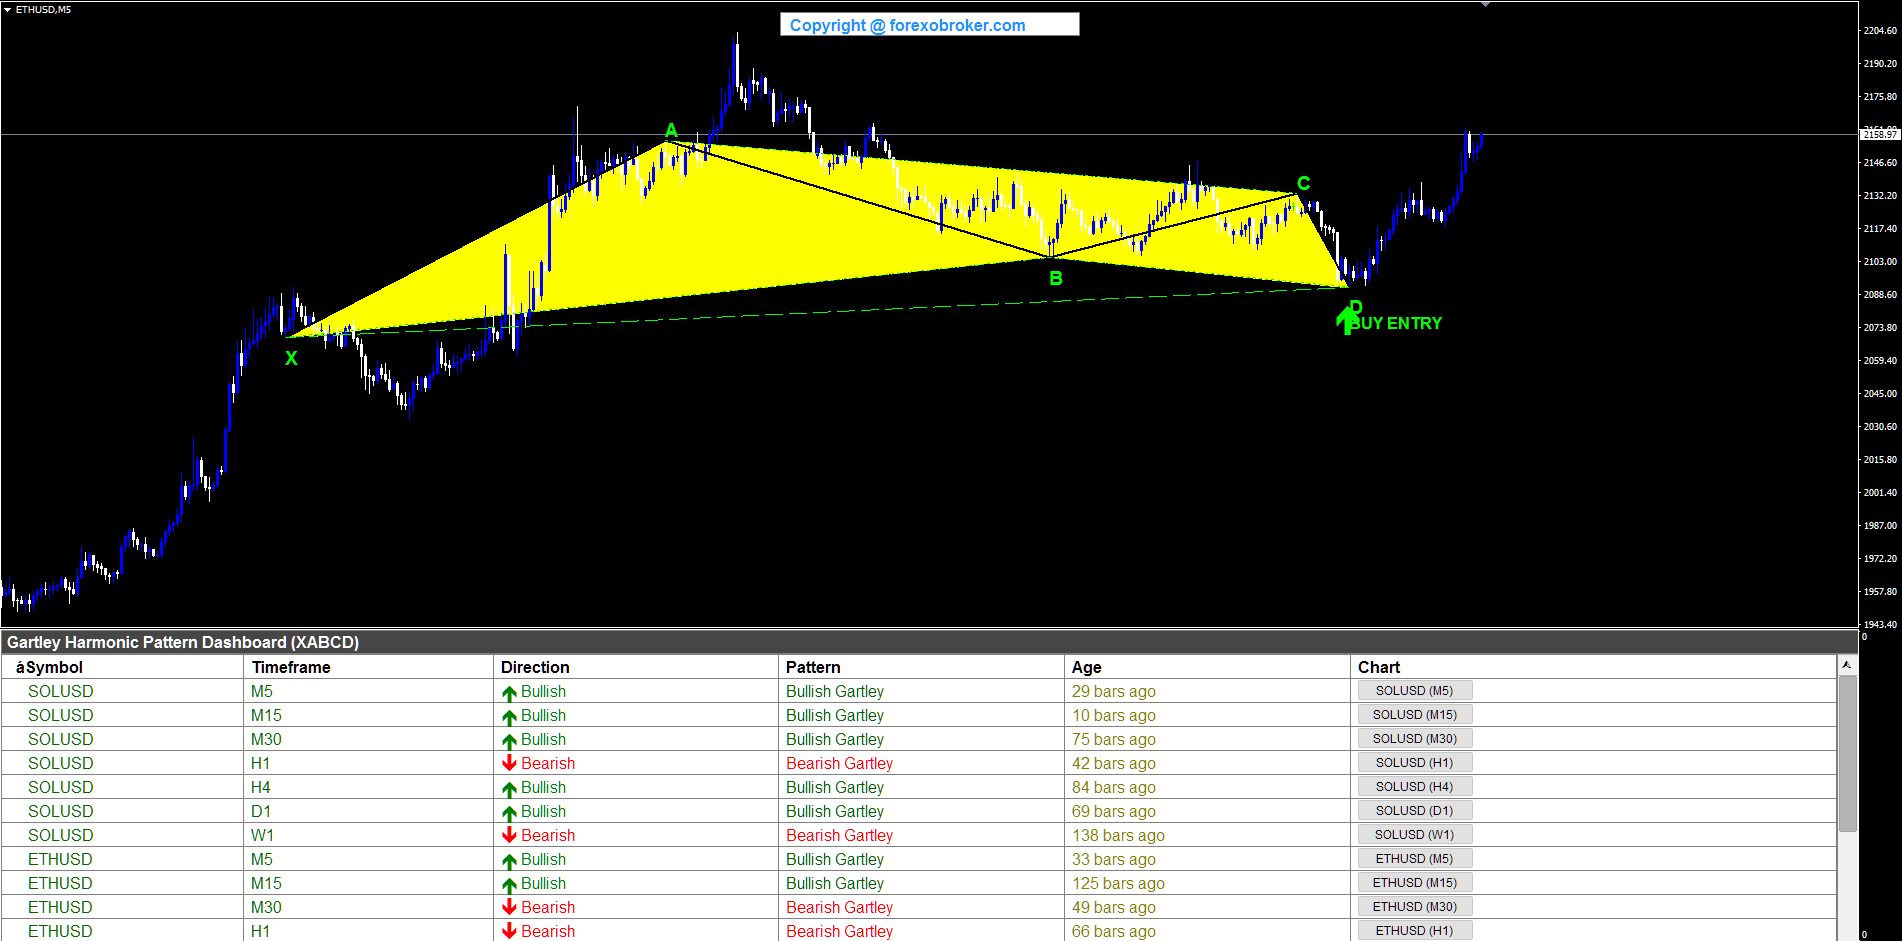
ETHUSD M5 -- Bullish Gartley
Ethereum on the M5 chart displayed a bullish Gartley with well-defined swing points. X formed at a swing low, A rose to a swing high, B pulled back to the 61.8% level, C pushed higher but stayed below A, and D completed at the 78.6% XAD retracement above X. The BUY ENTRY signal at D offered a long entry on Ethereum after the measured harmonic completion. The fast M5 timeframe made this a quick-turnaround trade, and the dashboard captured it alongside patterns on other crypto and forex pairs.
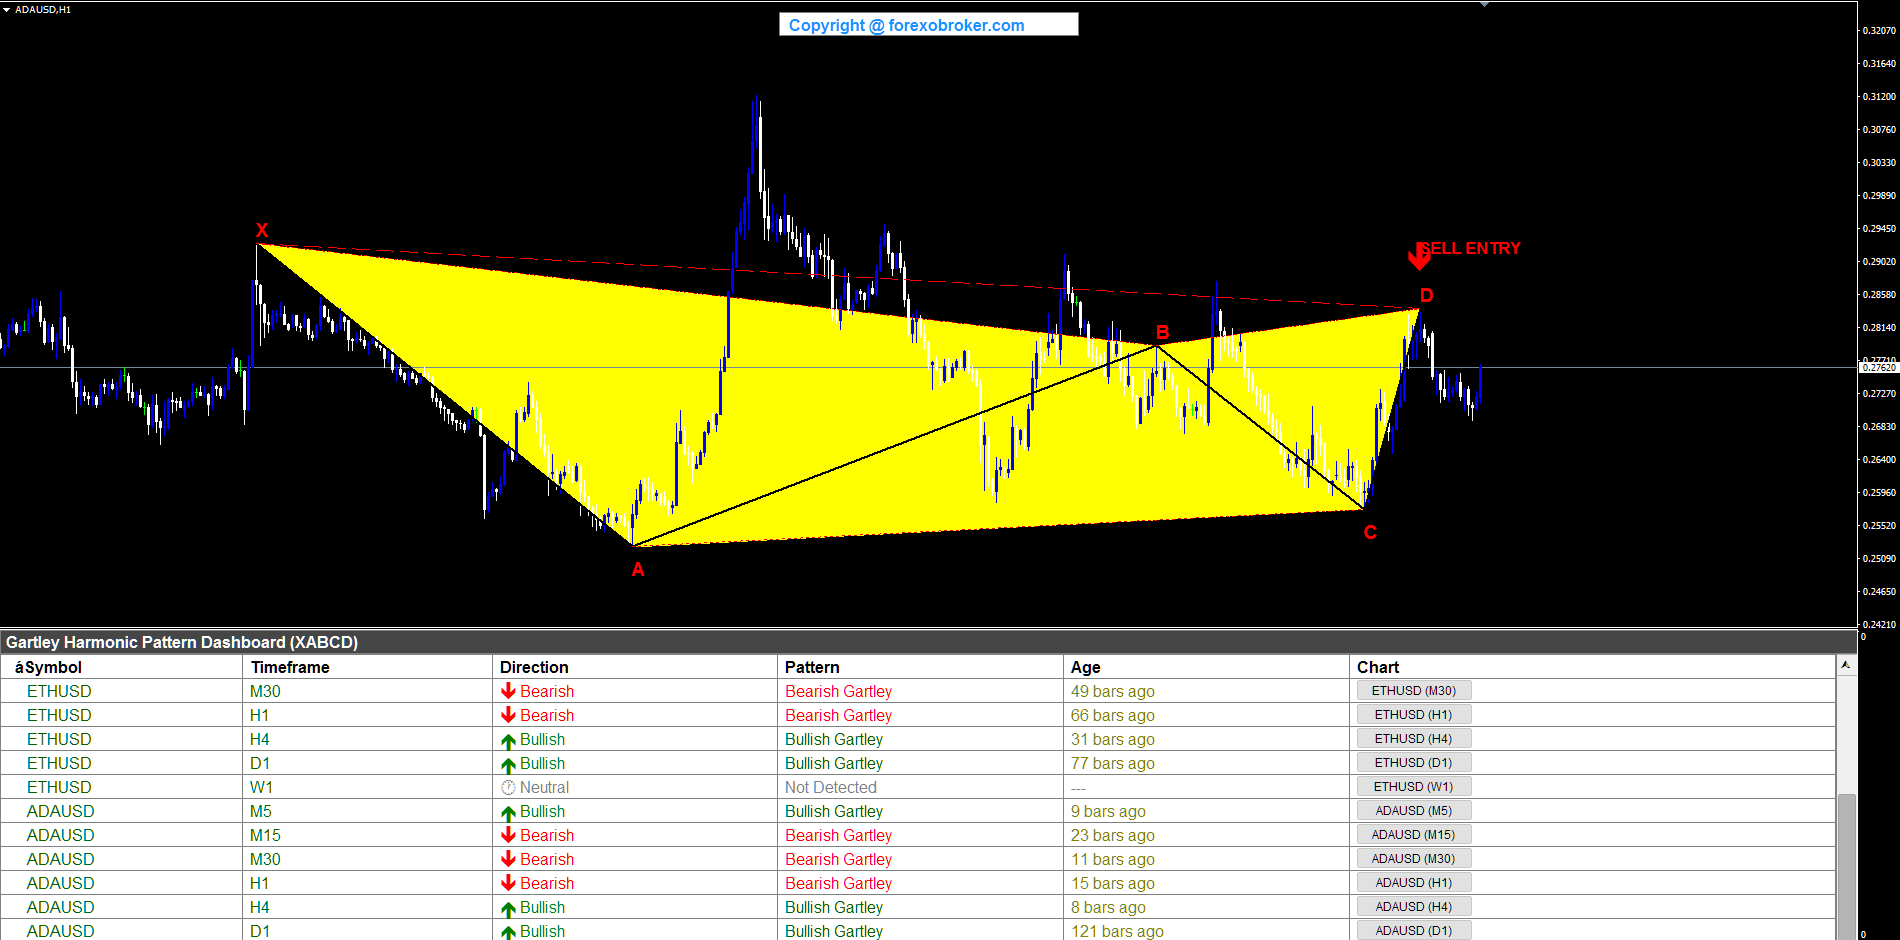
ADAUSD H1 -- Bearish Gartley
Cardano on the hourly chart formed a bearish Gartley spanning a significant price range. X was established at a swing high, A dropped to a swing low. B retraced upward to the 61.8% golden ratio of XA, C pulled back lower but stayed above A, and D completed at a swing high at the 78.6% XAD retracement below X. The SELL ENTRY at D represented a swing short opportunity on Cardano at a Fibonacci-defined resistance zone. The dashboard captured this H1 setup, demonstrating the indicator's coverage across multiple crypto assets on different timeframes.
12. Pivot & Fibonacci Tuning Guide
The Gartley Harmonic Dashboard provides several parameters for fine-tuning pattern detection to match your trading style and the instruments you trade.
Pivot Sensitivity
| Parameter | Default | Effect of Increase | Effect of Decrease |
|---|---|---|---|
| Pivot Left Bars | 5 | Requires more bars before the pivot, finds major swings only | Finds minor swings, more patterns but lower quality |
| Pivot Right Bars | 5 | More confirmation bars needed, fewer but more reliable patterns | Faster pattern detection, more patterns but higher false-positive risk |
For scalping on M1-M5, consider reducing pivot bars to 3-4 for faster pattern detection. For swing trading on H4-D1, the default 5 or even 7-8 gives higher-quality patterns based on significant swing points.
Gartley-Specific Fibonacci Tuning
| Trading Style | XAB Tolerance | ABC Range | XAD Tolerance | Patterns |
|---|---|---|---|---|
| Strict (fewer, higher-quality) | 3% (0.599-0.637) | 0.50 - 0.786 | 3% (0.762-0.810) | Few, high quality |
| Default (balanced) | 5% (0.568-0.668) | 0.382 - 0.886 | 5% (0.747-0.825) | Balanced |
| Relaxed (more patterns) | 8% (0.569-0.667) | 0.30 - 0.90 | 8% (0.723-0.849) | Many, wider net |
Strict settings tighten the XAB and XAD tolerances to just 3% and narrow the ABC range. This filters for near-textbook Gartley patterns where B sits almost exactly at the golden ratio and D lands precisely at 78.6% of XA. You will see fewer signals, but each one is a high-confidence harmonic structure with strict golden ratio geometry. Use this approach for major forex pairs on higher timeframes where price behavior tends to respect Fibonacci levels more precisely.
Default settings use 5% tolerance on both the XAB and XAD ratios and the full 0.382-0.886 ABC range. This accommodates the natural imprecision of real markets while still requiring that B falls near the golden ratio and D falls near the 78.6% level. This is recommended for most traders starting out with the indicator.
Relaxed settings cast a wider net with 8% tolerance. You will see more patterns, but some will be at the edges of what would be considered valid Gartley geometry. The wider XAB tolerance allows B points that are further from the ideal golden ratio. Use this when scanning instruments with irregular price behavior (crypto assets, exotic currency pairs) where patterns tend to be less geometrically precise.
Max History Bars
The Max History Bars parameter (default: 500) controls how far back the indicator looks for pivots. Reducing this value speeds up calculation but may miss larger patterns that span many bars. Increasing it to 1000 or more allows detection of major swing patterns on higher timeframes but increases computation time. For most trading scenarios, 500 bars provides sufficient lookback depth to capture Gartley patterns across all enabled timeframes.
Figure 7. Pivot points require confirmation bars on each side, ensuring patterns are based on confirmed swings rather than noise.
13. Parameter Reference
Dashboard Settings
| Parameter | Default | Description |
|---|---|---|
| Symbols | EURUSD,GBPUSD,USDCAD,USDJPY | Comma-separated list of symbols to monitor (up to 20) |
| Symbol Prefix | (empty) | Broker prefix, e.g., "x" for xEURUSD |
| Symbol Suffix | (empty) | Broker suffix, e.g., ".pro" for EURUSD.pro |
| Enable M1 | false | Toggle M1 timeframe scanning |
| Enable M5 | true | Toggle M5 timeframe scanning |
| Enable M15 | true | Toggle M15 timeframe scanning |
| Enable M30 | true | Toggle M30 timeframe scanning |
| Enable H1 | true | Toggle H1 timeframe scanning |
| Enable H4 | true | Toggle H4 timeframe scanning |
| Enable D1 | true | Toggle D1 timeframe scanning |
| Enable W1 | true | Toggle W1 timeframe scanning |
| Enable MN | false | Toggle Monthly timeframe scanning |
| Visible Rows | 12 | Number of rows displayed in the dashboard |
Gartley Pattern Settings
| Parameter | Default | Description |
|---|---|---|
| Pivot Left Bars | 5 | Number of bars to the left for swing detection |
| Pivot Right Bars | 5 | Number of bars to the right for confirmation |
| XAB Ratio | 0.618 | Target XAB retracement ratio (the golden ratio) |
| XAB Tolerance | 0.05 | Tolerance for XAB ratio (5% means valid range is 0.568-0.668) |
| ABC Min Retracement | 0.382 | Minimum ABC retracement ratio (C retraces at least 38.2% of AB) |
| ABC Max Retracement | 0.886 | Maximum ABC retracement ratio (C retraces at most 88.6% of AB) |
| XAD Ratio | 0.786 | Target XAD retracement ratio (the Gartley completion ratio) |
| XAD Tolerance | 0.05 | Tolerance for XAD ratio (5% means valid range is 0.7467-0.8253) |
| Max History Bars | 500 | Number of historical bars to scan per symbol-timeframe |
Chart Display Settings
| Parameter | Default | Description |
|---|---|---|
| Show Gartley Pattern | true | Draw the pattern overlay on chart |
| Show BUY/SELL Arrows | true | Display entry arrows at point D |
| Show Pattern Labels | true | Display X, A, B, C, D text labels |
| Bullish Pattern Color | Lime | Color for bullish (BUY) patterns |
| Bearish Pattern Color | Red | Color for bearish (SELL) patterns |
| Pattern Fill Color | Yellow | Color for the triangle fills |
| Pattern Line Color | Black | Color for the X-A-B-C-D connecting lines |
| Arrow Size | 4 | Size of entry arrows (1-5) |
| Arrow Gap (ATR mult.) | 0.8 | Distance of arrow from price (ATR multiplier) |
Alert Settings
| Parameter | Default | Description |
|---|---|---|
| Alert Title | "Gartley Harmonic Dashboard" | Title for alert messages |
| Enable Popup Alerts | true | Show MetaTrader popup dialog |
| Enable Sound Alerts | true | Play alert sound |
| Sound File | alert2.wav | WAV file for sound alerts |
| Enable Email Alerts | false | Send email notification |
| Enable Push Notifications | true | Send mobile push notification |
14. Conclusion
The Gartley harmonic pattern is the original XABCD structure -- the pattern that started harmonic trading in 1935 and remains the most widely recognized and traded harmonic formation today. Its effectiveness comes from the convergence of three Fibonacci ratio relationships -- XAB at the 61.8% golden ratio, ABC between 38.2% and 88.6%, and the defining XAD retracement at 78.6% -- that together identify high-probability reversal zones with well-defined risk parameters. The golden ratio at the B point is the most watched Fibonacci level in all of technical analysis, and the 78.6% XAD level (the square root of 0.618) places the D-point completion zone at a mathematically significant support or resistance level.
The challenge has always been operational. Identifying five-point XABCD patterns that simultaneously satisfy three Fibonacci conditions -- including the demanding fixed 61.8% XAB ratio -- across a full watchlist of 20 symbols and nine timeframes requires continuous measurement and validation that exceeds what any manual scanning process can deliver. The cognitive load of verifying the golden ratio at B, checking the ABC retracement, and confirming the 78.6% XAD completion across 180 chart combinations makes comprehensive Gartley pattern scanning humanly impossible to do consistently.
The Gartley Harmonic Dashboard automates this entire process. It identifies confirmed swing pivots, constructs five-point Gartley pattern candidates in both bullish (LHLHL) and bearish (HLHLH) orientations, validates them against three Fibonacci ratios with configurable tolerance, and presents every valid pattern in a clean six-column dashboard with real-time alerts across four channels. The non-repainting design ensures that every signal is based on confirmed price structure, and the yellow triangle fills with dashed internal lines make pattern identification immediate and intuitive.
Whether you trade forex, metals, crypto, or indices -- and whether you scalp on M5 or swing trade on the Daily -- the dashboard adapts to your watchlist and timeframe preferences. Configure it once, and let it scan continuously while you focus on evaluating setups and managing trades.
Try the free demo or get the full version on the MQL5 Market:
- MetaTrader 5: Gartley Harmonic Dashboard MT5
- MetaTrader 4: Gartley Harmonic Dashboard MT4


")

")